South India Silica Gel and Precipitated Silica Market
South India Silica Gel and Precipitated Silica Market Size, Share Global Analysis Report, 2019 – 2027
Press Release
South India Silica Gel and Precipitated Silica Market By Product (Process-Based Rice Husk and Process-Based on Sodium Silicate) and By End-Use (Tire & Rubber, Adhesives & Sealants, Food & Beverages, Agriculture, Battery Separators, and Coatings, Paints, & Ink): Industry Perspective, Comprehensive Analysis, and Forecast 2019 – 2027
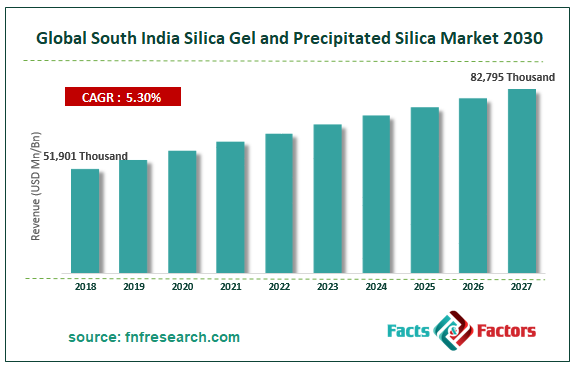
The report covers the forecast and analysis of the South India silica gel and precipitated silica market. The study provides historical data from 2015 to 2018 along with a forecast from 2019 to 2027 based on revenue (USD Thousand). The study includes drivers and restraints of the South India silica gel and precipitated silica market along with the impact they have on the demand over the forecast period. Additionally, the report includes the study of opportunities available in the South India silica gel and precipitated silica market. According to the report, the demand for South India silica gel and precipitated silica market was valued at approximately USD 51,901 thousand in 2018 and is expected to reach a value of around USD 82,795 thousand by 2027, at a CAGR of around 5.3 % between 2019 and 2027.
In order to give the users of this report a comprehensive view of the South India silica gel and precipitated silica market, we have included a competitive landscape and an analysis of Porter’s Five Forces model for the market. The study encompasses a market attractiveness analysis, wherein all the segments are benchmarked based on their market size, growth rate, and general attractiveness.
The report provides company market share analysis to give a broader overview of the key players in the market. In addition, the report also covers key strategic developments of the market including acquisitions & mergers, new product & service launches, agreements, partnerships, collaborations & joint ventures, research & development, and regional expansion of major participants involved in the market on a global and regional basis.
The study provides a decisive view of the South India silica gel and precipitated silica market by segmenting the market based on the cloud type, streaming type, device, and regions. All the segments have been analyzed based on present and future trends and the market is estimated from 2019 to 2027.
The humungous usage of precipitated silica in green tires will notably push the industry progress in the upward direction during the forecast timeline. Apparently, the thriving pharmaceutical sector, consumer goods sector, and packaging sector are likely to drive the industry expansion during the forecast timeline. Nonetheless, the easy availability of the product substitutes like activated alumina, activated charcoal, molecular sieves, and activated clay at lower costs and in large quantities is anticipated to pose a threat to the market growth.
The South India silica gel and precipitated silica industry are segregated based on product and end-use. Based on the product, the market is divided into Process-Based Rice Husk and Process-Based on Sodium Silicate. In terms of end-use, the South India silica gel and precipitated silica industry are classified into Tire & Rubber, Adhesives & Sealants, Food & Beverages, Agriculture, Battery Separators, and Coatings, Paints, & Ink.
Key players in the South India silica gel and precipitated silica industry include Cabot Corporation, W.R. Grace & Co.-Conn, Madhu Silica Pvt. Ltd., Malpro Silica Pvt Ltd., Prabha Chemicals & Allied Products, Evonik Industries AG, Astrra Chemicals, Vishnupriya Chemicals Pvt. Ltd., and Allied Silica Limited.
Table of Content
Chapter 1. Executive Summary 17
Chapter 2. South India Silica Gel and Precipitated Silica market – Product Analysis 20
2.1. South India Silica Gel and Precipitated Silica Market – Product Overview 20
2.2. South India Silica Gel and Precipitated Silica Market Share, by Product, 2018 & 2025 (USD Thousand) 20
2.3. Process-Based Rice Husk 22
2.3.1. Process-Based Rice Husk South India Silica Gel and Precipitated Silica Market, 2015-2027 (USD Thousand) 22
2.4. Process-Based on Sodium Silicate 23
2.4.1. Process-Based on Sodium Silicate South India Silica Gel and Precipitated Silica Market, 2015-2027 (USD Thousand) 23
Chapter 3. South India Silica Gel and Precipitated Silica market – End-Use Analysis 23
3.1. South India Silica Gel and Precipitated Silica Market – End-Use Overview 23
3.2. South India Silica Gel and Precipitated Silica Market Share, by End-Use, 2018 & 2025 (USD Thousand) 24
3.3. Tire & Rubber 26
3.3.1. Tire & Rubber South India Silica Gel and Precipitated Silica Market, 2015-2027 (USD Thousand) 26
3.4. Adhesives & Sealants 27
3.4.1. Adhesives & Sealants South India Silica Gel and Precipitated Silica Market, 2015-2027 (USD Thousand) 27
3.5. Food & Beverages 28
3.5.1. Food & Beverages South India Silica Gel and Precipitated Silica Market, 2015-2027 (USD Thousand) 28
3.6. Agriculture 29
3.6.1. Agriculture South India Silica Gel and Precipitated Silica Market, 2015-2027 (USD Thousand) 29
3.7. Battery Separators 30
3.7.1. Battery Separators South India Silica Gel and Precipitated Silica Market, 2015-2027 (USD Thousand) 30
3.8. Coatings, Paints, & Ink 31
3.8.1. Coatings, Paints, & Ink South India Silica Gel and Precipitated Silica Market, 2015-2027 (USD Thousand) 31
Chapter 4. South India Silica Gel and Precipitated Silica market – Regional Analysis 32
4.1. South India Silica Gel and Precipitated Silica Market Regional Overview 32
4.2. South India Silica Gel and Precipitated Silica Market Share, by Region, 2018 & 2025 (Value) 32
4.3. South India 34
4.3.1. South India Silica Gel and Precipitated Silica Market size and forecast, 2015-2027 34
4.3.2. South India Silica Gel and Precipitated Silica Market, by Country, 2018 & 2025 (USD Thousand) 34
4.3.3. South India Silica Gel and Precipitated Silica Market, by Product, 2015-2027 36
4.3.3.1. South India Silica Gel and Precipitated Silica Market, by Product, 2015-2027 (USD Thousand) 36
4.3.4. South India Silica Gel and Precipitated Silica Market, by End-Use, 2015-2027 37
4.3.4.1. South India Silica Gel and Precipitated Silica Market, by End-Use, 2015-2027 (USD Thousand) 37
FIG. 1  South India Silica Gel and Precipitated Silica Market, 2015-2027 (USD Thousand) 19
FIG. 2  South India Silica Gel and Precipitated Silica Market Share, by Product, 2018 & 2025 (USD Thousand) 20
FIG. 3  Process-Based Rice Husk South India Silica Gel and Precipitated Silica Market, 2015-2027 (USD Thousand) 22
FIG. 4  Process-Based on Sodium Silicate South India Silica Gel and Precipitated Silica Market, 2015-2027 (USD Thousand) 23
FIG. 5  South India Silica Gel and Precipitated Silica Market Share, by End-Use, 2018 & 2025 (USD Thousand) 24
FIG. 6  Tire & Rubber South India Silica Gel and Precipitated Silica Market, 2015-2027 (USD Thousand) 26
FIG. 7  Adhesives & Sealants South India Silica Gel and Precipitated Silica Market, 2015-2027 (USD Thousand) 27
FIG. 8  Food & Beverages South India Silica Gel and Precipitated Silica Market, 2015-2027 (USD Thousand) 28
FIG. 9  Agriculture South India Silica Gel and Precipitated Silica Market, 2015-2027 (USD Thousand) 29
FIG. 10  Battery Separators South India Silica Gel and Precipitated Silica Market, 2015-2027 (USD Thousand) 30
FIG. 11  Coatings, Paints, & Ink South India Silica Gel and Precipitated Silica Market, 2015-2027 (USD Thousand) 31
FIG. 12  South India Silica Gel and Precipitated Silica Market Share, by Region, 2018 & 2025 32
FIG. 13 South India South India Silica Gel and Precipitated Silica Market, 2015-2027 34
FIG. 14 Andhra Pradesh South India Silica Gel and Precipitated Silica Market, 2015-2027 38
FIG. 15 Karnataka South India Silica Gel and Precipitated Silica Market, 2015-2027 39
FIG. 16 Tamil Nadu South India Silica Gel and Precipitated Silica Market, 2015-2027 40
FIG. 17 Telangana South India Silica Gel and Precipitated Silica Market, 2015-2027 41
FIG. 18 Kerala South India Silica Gel and Precipitated Silica Market, 2015-2027 42
FIG. 19 Rest of South India South India Silica Gel and Precipitated Silica Market, 2015-2027 43
FIG. 20 Competitor Market Share – Revenue 44
FIG. 21 Cabot Corporation Revenue and Growth Rate 49
FIG. 22 Cabot Corporation Market Share 49
FIG. 23 W.R. Grace & Co.-Conn Revenue and Growth Rate 51
FIG. 24 W.R. Grace & Co.-Conn Market Share 51
FIG. 25 Madhu Silica Pvt. Ltd. Revenue and Growth Rate 53
FIG. 26 Madhu Silica Pvt. Ltd. Market Share 53
FIG. 27 Malpro Silica Pvt. Ltd. Revenue and Growth Rate 55
FIG. 28 Malpro Silica Pvt. Ltd. Market Share 55
FIG. 29 Prabha Chemicals & Allied Products Revenue and Growth Rate 57
FIG. 30 Prabha Chemicals & Allied Products Market Share 57
FIG. 31 Evonik Industries AG Revenue and Growth Rate 59
FIG. 32 Evonik Industries AG Market Share 59
FIG. 33 Astrra Chemicals Revenue and Growth Rate 61
FIG. 34 Astrra Chemicals Market Share 61
FIG. 35 Vishnupriya Chemicals Pvt. Ltd. Revenue and Growth Rate 63
FIG. 36 Vishnupriya Chemicals Pvt. Ltd. Market Share 63
FIG. 37 Allied Silica Limited Revenue and Growth Rate 65
FIG. 38 Allied Silica Limited Market Share 65
FIG. 39 Market Dynamics 67
FIG. 40  South India Silica Gel and Precipitated Silica – Value Chain Analysis 70
FIG. 41 Technology Roadmap and Timeline 71
FIG. 42 Market Attractiveness Analysis – By Product 72
FIG. 43 Market Attractiveness Analysis – By End-Use 73
FIG. 44 Market Attractiveness Analysis – By Region 74
FIG. 45 Market Channel 75
FIG. 46 Marketing Channel Development Trend 76
FIG. 47 Growth in World Gross Product, 2008-2018 77
List of Tables
TABLE 1  South India Silica Gel and Precipitated Silica Market, 2018 & 2025 (USD Thousand) 17
TABLE 2  South India Silica Gel and Precipitated Silica market, by Product, 2015-2027 (USD Thousand) 19
TABLE 3  South India Silica Gel and Precipitated Silica market, by End-Use, 2015-2027 (USD Thousand) 23
TABLE 4  South India Silica Gel and Precipitated Silica market, by Region, 2015-2027 (USD Thousand) 31
TABLE 5 South India South India Silica Gel and Precipitated Silica Market, by Product, 2015-2027 (USD Thousand) 35
TABLE 6 South India South India Silica Gel and Precipitated Silica Market, by End-Use, 2015-2027 (USD Thousand) 36
TABLE 7  South India Silica Gel and Precipitated Silica Market - Company Revenue Analysis 2015-2018 (USD Thousand) 43
TABLE 8  South India Silica Gel and Precipitated Silica Market - Company Revenue Share Analysis 2015-2018(%) 45
TABLE 9 Acquisitions and Mergers 46
TABLE 10 New Product/Service Launch 46
TABLE 11 Research & Development Activities 46
TABLE 12 Market Drivers 67
TABLE 13 Market Restraints 67
TABLE 14 Market Opportunities 68

 Report Scope


