Search Market Research Report

Discover Our Latest Reports
Discover Our Featured Reports
Discover Top Selling Reports

Smart Textile Market Size, Share Global Analysis Report, 2019–2026

report img

Smart Textile Market By Product (Passive, Active, Very Smart), By End-Use (Fashion & Entertainment, Sports & Fitness, Medical, Transportation, Protection & Military, Architecture) and By Functionality (Sensing, Energy Harvesting, Luminescence & Aesthetics, Thermoelectricity, Others):Global Industry Perspective, Market Size, Statistical Research, Market Intelligence, Comprehensive Analysis, Historical Trends, and Forecast 2019–2026

Industry Insights

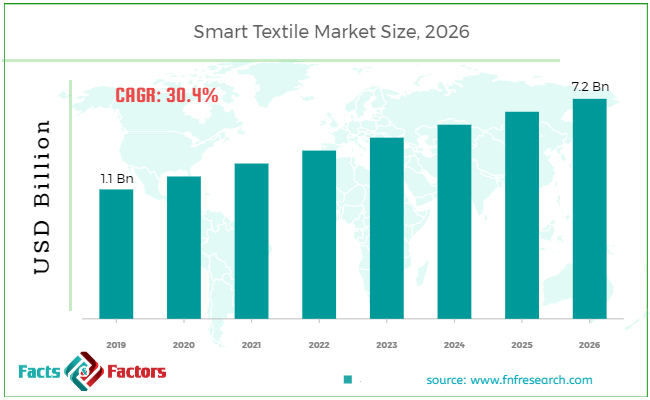
[180+ Pages Report] According to the report published by Facts Factors, the global smart textile market size was worth around USD 1.1 Billion in 2019 and is predicted to grow to around USD 7.2 Billion by 2026 with a compound annual growth rate (CAGR) of roughly 30.4% between 2020 and 2026. The report analyzes the global smart textile market drivers, restraints/challenges, and the effect they have on the demands during the projection period. In addition, the report explores emerging opportunities in the smart textile market.

Smart Textile Market Size

To know more about this report | Request Free Sample Copy

This professional and specialized report study examines the technical and business perspective of the smart textile industry. The report provides a historical analysis of the industry as well as the projected trends expected to be witnessed in the smart textile market. The report study analyzes the market statistics at the global as well as the regional levels to gain an in-depth perspective of the overall smart textile market. The historical insights are provided from 2016 to 2019 and projected trends are provided from 2020 to 2026. The quantitative data is provided in terms of both volume (Tons) and value (USD Million) for 2016 – 2026. The qualitative data is reinforced by analyzing and providing numerous market dynamics (directly or indirectly affecting the industry) such as growth drivers, restraints, challenges, and opportunities.

We have included various industry analysis models in our report and extensively demonstrated the key business strategies and competitive landscape of the smart textile market in our study.


logoKey Insights from Primary Research

  • The smart textile market is set to grow annually at a rate of around 30.4% as per our primary research
  • It was established through primary research that the smart textile market was valued at around USD 1.1 billion in 2019
  • North America held the largest market share of the smart textile market in 2018
  • The “Passive” category, on the basis of fiber product segmentation, was the leading revenue-generating in 2018
  • The “Sensing” category, on the basis of functionality segmentation, was the leading revenue-generating in 2018

logoKey Recommendations from Analysts

  • As per our analysts, the major application of smart textile is anticipated to be in protection and military industry
  • New technological developments such as Nano-Technology are anticipated to create a new opportunity for the smart textile market in the future
  • The Asia Pacific is expected to grow at a steady-state in the upcoming years
  • Asian countries such as China and India are anticipated to be converted into manufacturing hubs in the upcoming years
  • Decreasing manufacturing costs of electronics is anticipated to boost the smart textiles market in the upcoming years

logoGlobal Smart Textile Market Share- 2018


Our study also includes an analysis of Porter’s Five Forces framework for understanding the competitive strategies adopted by various stakeholders involved in the entire value chain of the smart textile market. It also encompasses PESTLE analysis and SWOT analysis.

The report also offers an in-depth analysis of the market shares of each industry player and gives an outline of the market position of key players in the smart textile market. Moreover, the study offers wide coverage of key strategic advances witnessed in the market such as new product launches, acquisitions & mergers, collaborations & joint ventures, funding & VC activities, agreements, partnerships, R&D activities, and regional expansion of key players of the smart textile market.

The research study provides a critical assessment of the smart textile industry by logically segmenting the market on the basis of product, end-use, functionality, and regions. Based on the past, present, and future trends, all the segments were analyzed from the bottom up, and the market sizes have been estimated from 2020 to 2026. The regional segmentation of the smart textile industry includes the holistic bifurcation of all the five major continents including North America, Europe, Asia Pacific, Latin America, and the Middle East & Africa.

The development of new technologies such as nanotechnology and Bluetooth Low Energy (BLE) technology is attributed to the development of the smart textiles market. Similarly, the decreasing manufacturing costs of electronics is anticipated to boost the smart textiles market in the upcoming years. Innovative intelligent fabric with the ability to generate power to light clothes was invented in Portugal by the Center of Nanotechnology and Smart Materials (CeNTI). Such innovations prove to create new opportunities for smart textile markets in the future.

The smart textile market is segmented based on product, end-use, and functionality. On the basis of product segmentation, the market is classified into Passive, Active, Very Smart. In terms of end-use segmentation, the market is bifurcated into Fashion & Entertainment, Sports & Fitness, Medical, Transportation, Protection & Military, Architecture. On the basis of functionality segmentation, the market is classified into sensing, Energy Harvesting, Luminescence & Aesthetics, Thermoelectricity, and others.

logoReport Scope

Report Attribute

Details

Market Size in 2019

USD 1.1 Billion

Projected Market Size in 2026

USD 7.2 Billion

CAGR Growth Rate

30.4% CAGR

Base Year

2021

Forecast Years

2022-2028

Key Market Players

AiQ Smart Clothing Inc., EXO2, Mide Technology Corporation, OhmatexApS, Thermosoft International Corporation, Adidas AG, Clothing+ (Jabil Circuit, Inc.), Gentherm, Inc., Nike, Inc., Sensing Tex SL , and Others

Key Segment

By Product, By End-Use, By Functionality, and By Region

Major Regions Covered

North America, Europe, Asia Pacific, Latin America, and the Middle East & Africa

Purchase Options

Request customized purchase options to meet your research needs. Explore purchase options

logoSome of the leading players in the global market include

  • AiQ Smart Clothing Inc.
  •  EXO2
  •  Mide Technology Corporation
  •  OhmatexApS
  •  Thermosoft International Corporation
  • Adidas AG
  • Clothing+ (Jabil Circuit, Inc.)
  • Gentherm Inc.
  • Nike  Inc.
  • Sensing Tex SL
  • and others.

This report segments the smart textile market as follows:

logoBy Product Segment Analysis

  • Passive
  • Active
  • Very Smart

logoBy End-Use Segment Analysis

  • Fashion & Entertainment
  • Sports & Fitness
  • Medical
  • Transportation
  • Protection & Military
  • Architecture

logoBy Functionality Segment Analysis

  • Sensing
  • Energy Harvesting
  • Luminescence & Aesthetics
  • Thermoelectricity
  • Others

logoBy Regional Segment Analysis

  • North America
    • The U.S.
    • Canada
    • Mexico
  • Europe
    • France
    • The UK
    • Germany
    • Rest of Europe
  • Asia Pacific
    • China
    • Japan
    • India
    • Rest of Asia Pacific
  • The Middle East & Africa
    • GCC Countries
    • South Africa
    • Rest of Middle East & Africa
  • Latin America
    • Brazil
    • Argentina
    • Chile
    • Rest of Latin America

logoKEY BUSINESS POINTERS ADDRESSED & FOREMOST REASONS TO PROCURE THE REPORT:

  • Statistical Analysis of the Past, Current, and Future Trends of the Industry with Validated Market Sizes Data
  • Direct and Indirect Rationales Impacting the Industry
  • In-depth and Micro Analysis of Viable Segments and Sub-segments
  • Companies and Vendors Market Share, Competitive Landscape, and Player Positioning Analysis
  • Demand Side (Consumption) and Supply Side (Production) Perspective and Analysis wherever applicable
  • Key Buyers and End-Users Analysis
  • Value Chain and Manufacturing Cost Structure Analysis wherever relevant
  • Key Marketing Strategies as well as Key Sales Channels adopted in the market
  • Investment Opportunity Analysis & Patents Analysis wherever feasible
  • Technological Road Map & Technical Analysis
  • Robust Research Methodology comprising dynamic mix (65%~35%) of Extensive Primary Research (primary interviews, ad-hoc surveys, questionnaires) and Protracted Secondary Research (proprietary in-house database, paid external databases, publically available validated sources)


Table of Content

  1. CHAPTER 1. Executive Summary
  2. CHAPTER 2. Smart Textile market – Product Analysis
    1. 2.1. Global Smart Textile Market – Product Overview
    2. 2.2. Global Smart Textile Market Share, by Product, 2019 & 2026 (USD Million)
    3. 2.3. Global Smart Textile Market share, by Product, 2019 & 2026 (Tons)
    4. 2.4. Passive
      1. 2.4.1. Global Passive Smart Textile Market, 2016-2026 (USD Million)
      2. 2.4.2. Global Passive Smart Textile Market, 2016-2026 (Tons)
    5. 2.5. Active
      1. 2.5.1. Global Active Smart Textile Market, 2016-2026 (USD Million)
      2. 2.5.2. Global Active Smart Textile Market, 2016-2026 (Tons)
    6. 2.6. Very Smart
      1. 2.6.1. Global Very Smart Smart Textile Market, 2016-2026 (USD Million)
      2. 2.6.2. Global Very Smart Smart Textile Market, 2016-2026 (Tons)
  3. CHAPTER 3. Smart Textile market – End Use Analysis
    1. 3.1. Global Smart Textile Market – End Use Overview
    2. 3.2. Global Smart Textile Market Share, by End Use, 2019 & 2026 (USD Million)
    3. 3.3. Global Smart Textile Market share, by End Use, 2019 & 2026 (Tons)
    4. 3.4. Fashion & Entertainment
      1. 3.4.1. Global Fashion & Entertainment Smart Textile Market, 2016-2026 (USD Million)
      2. 3.4.2. Global Fashion & Entertainment Smart Textile Market, 2016-2026 (Tons)
    5. 3.5. Sports & Fitness
      1. 3.5.1. Global Sports & Fitness Smart Textile Market, 2016-2026 (USD Million)
      2. 3.5.2. Global Sports & Fitness Smart Textile Market, 2016-2026 (Tons)
    6. 3.6. Medical
      1. 3.6.1. Global Medical Smart Textile Market, 2016-2026 (USD Million)
      2. 3.6.2. Global Medical Smart Textile Market, 2016-2026 (Tons)
    7. 3.7. Transportation
      1. 3.7.1. Global Transportation Smart Textile Market, 2016-2026 (USD Million)
      2. 3.7.2. Global Transportation Smart Textile Market, 2016-2026 (Tons)
    8. 3.8. Protection & Military
      1. 3.8.1. Global Protection & Military Smart Textile Market, 2016-2026 (USD Million)
      2. 3.8.2. Global Protection & Military Smart Textile Market, 2016-2026 (Tons)
    9. 3.9. Architecture
      1. 3.9.1. Global Architecture Smart Textile Market, 2016-2026 (USD Million)
      2. 3.9.2. Global Architecture Smart Textile Market, 2016-2026 (Tons)
  4. CHAPTER 4. Smart Textile market – Functionality Analysis
    1. 4.1. Global Smart Textile Market – Functionality Overview
    2. 4.2. Global Smart Textile Market Share, by Functionality, 2019 & 2026 (USD Million)
    3. 4.3. Global Smart Textile Market share, by Functionality, 2019 & 2026 (Tons)
    4. 4.4. Sensing
      1. 4.4.1. Global Sensing Smart Textile Market, 2016-2026 (USD Million)
      2. 4.4.2. Global Sensing Smart Textile Market, 2016-2026 (Tons)
    5. 4.5. Energy Harvesting
      1. 4.5.1. Global Energy Harvesting Smart Textile Market, 2016-2026 (USD Million)
      2. 4.5.2. Global Energy Harvesting Smart Textile Market, 2016-2026 (Tons)
    6. 4.6. Luminescence & Aesthetics
      1. 4.6.1. Global Luminescence & Aesthetics Smart Textile Market, 2016-2026 (USD Million)
      2. 4.6.2. Global Luminescence & Aesthetics Smart Textile Market, 2016-2026 (Tons)
    7. 4.7. Thermoelectricity
      1. 4.7.1. Global Thermoelectricity Smart Textile Market, 2016-2026 (USD Million)
      2. 4.7.2. Global Thermoelectricity Smart Textile Market, 2016-2026 (Tons)
    8. 4.8. Others
      1. 4.8.1. Global Others Smart Textile Market, 2016-2026 (USD Million)
      2. 4.8.2. Global Others Smart Textile Market, 2016-2026 (Tons)
  5. CHAPTER 5. Smart Textile market – Regional Analysis
    1. 5.1. Global Smart Textile Market Regional Overview
    2. 5.2. Global Smart Textile Market Share, by Region, 2019 & 2026 (Value)
    3. 5.3. Global Smart Textile Market Share, by Region, 2019 & 2026 (Volume)
    4. 5.4. North America
      1. 5.4.1. North America Smart Textile Market size and forecast, 2016-2026
      2. 5.4.2. North America Smart Textile Market, by Country, 2019 - 2026 (USD Million)
      3. 5.4.3. North America Market size and forecast, 2016-2026 (Tons)
      4. 5.4.4. North America Smart Textile Market, by Country, 2019 - 2026 (Tons)
      5. 5.4.5. North America Smart Textile Market, by Product, 2016-2026
        1. 5.4.5.1. North America Smart Textile Market, by Product, 2016-2026 (USD Million)
        2. 5.4.5.2. North America Smart Textile Market, by Product, 2016-2026 (Tons)
      6. 5.4.6. North America Smart Textile Market, by End Use, 2016-2026
        1. 5.4.6.1. North America Smart Textile Market, by End Use, 2016-2026 (USD Million)
        2. 5.4.6.2. North America Smart Textile Market, by End Use, 2016-2026 (Tons)
      7. 5.4.7. North America Smart Textile Market, by Functionality, 2016-2026
        1. 5.4.7.1. North America Smart Textile Market, by Functionality, 2016-2026 (USD Million)
        2. 5.4.7.2. North America Smart Textile Market, by Functionality, 2016-2026 (Tons)
      8. 5.4.8. U.S.
        1. 5.4.8.1. U.S. Market size and forecast, 2016-2026 (USD Million)
        2. 5.4.8.2. U.S. Market size and forecast, 2016-2026 (Tons)
      9. 5.4.9. Canada
        1. 5.4.9.1. Canada Market size and forecast, 2016-2026 (USD Million)
        2. 5.4.9.2. Canada Market size and forecast, 2016-2026 (Tons)
    5. 5.5. Europe
      1. 5.5.1. Europe Smart Textile Market size and forecast, 2016-2026
      2. 5.5.2. Europe Smart Textile Market, by Country, 2019 - 2026 (USD Million)
      3. 5.5.3. Europe Market size and forecast, 2016-2026 (Tons)
      4. 5.5.4. Europe Smart Textile Market, by Country, 2019 - 2026 (Tons)
      5. 5.5.5. Europe Smart Textile Market, by Product, 2016-2026
        1. 5.5.5.1. Europe Smart Textile Market, by Product, 2016-2026 (USD Million)
        2. 5.5.5.2. Europe Smart Textile Market, by Product, 2016-2026 (Tons)
      6. 5.5.6. Europe Smart Textile Market, by End Use, 2016-2026
        1. 5.5.6.1. Europe Smart Textile Market, by End Use, 2016-2026 (USD Million)
        2. 5.5.6.2. Europe Smart Textile Market, by End Use, 2016-2026 (Tons)
      7. 5.5.7. Europe Smart Textile Market, by Functionality, 2016-2026
        1. 5.5.7.1. Europe Smart Textile Market, by Functionality, 2016-2026 (USD Million)
        2. 5.5.7.2. Europe Smart Textile Market, by Functionality, 2016-2026 (Tons)
      8. 5.5.8. Germany
        1. 5.5.8.1. Germany Market size and forecast, 2016-2026 (USD Million)
        2. 5.5.8.2. Germany Market size and forecast, 2016-2026 (Tons)
      9. 5.5.9. France
        1. 5.5.9.1. France Market size and forecast, 2016-2026 (USD Million)
        2. 5.5.9.2. France Market size and forecast, 2016-2026 (Tons)
      10. 5.5.10. U.K.
        1. 5.5.10.1. U.K. Market size and forecast, 2016-2026 (USD Million)
        2. 5.5.10.2. U.K. Market size and forecast, 2016-2026 (Tons)
      11. 5.5.11. Italy
        1. 5.5.11.1. Italy Market size and forecast, 2016-2026 (USD Million)
        2. 5.5.11.2. Italy Market size and forecast, 2016-2026 (Tons)
      12. 5.5.12. Spain
        1. 5.5.12.1. Spain Market size and forecast, 2016-2026 (USD Million)
        2. 5.5.12.2. Spain Market size and forecast, 2016-2026 (Tons)
      13. 5.5.13. Rest of Europe
        1. 5.5.13.1. Rest of Europe Market size and forecast, 2016-2026 (USD Million)
        2. 5.5.13.2. Rest of Europe Market size and forecast, 2016-2026 (Tons)
    6. 5.6. Asia Pacific
      1. 5.6.1. Asia Pacific Smart Textile Market size and forecast, 2016-2026
      2. 5.6.2. Asia Pacific Smart Textile Market, by Country, 2019 - 2026 (USD Million)
      3. 5.6.3. Asia Pacific Market size and forecast, 2016-2026 (Tons)
      4. 5.6.4. Asia Pacific Smart Textile Market, by Country, 2019 - 2026 (Tons)
      5. 5.6.5. Asia Pacific Smart Textile Market, by Product, 2016-2026
        1. 5.6.5.1. Asia Pacific Smart Textile Market, by Product, 2016-2026 (USD Million)
        2. 5.6.5.2. Asia Pacific Smart Textile Market, by Product, 2016-2026 (Tons)
      6. 5.6.6. Asia Pacific Smart Textile Market, by End Use, 2016-2026
        1. 5.6.6.1. Asia Pacific Smart Textile Market, by End Use, 2016-2026 (USD Million)
        2. 5.6.6.2. Asia Pacific Smart Textile Market, by End Use, 2016-2026 (Tons)
      7. 5.6.7. Asia Pacific Smart Textile Market, by Functionality, 2016-2026
        1. 5.6.7.1. Asia Pacific Smart Textile Market, by Functionality, 2016-2026 (USD Million)
        2. 5.6.7.2. Asia Pacific Smart Textile Market, by Functionality, 2016-2026 (Tons)
      8. 5.6.8. China
        1. 5.6.8.1. China Market size and forecast, 2016-2026 (USD Million)
        2. 5.6.8.2. China Market size and forecast, 2016-2026 (Tons)
      9. 5.6.9. Japan
        1. 5.6.9.1. Japan Market size and forecast, 2016-2026 (USD Million)
        2. 5.6.9.2. Japan Market size and forecast, 2016-2026 (Tons)
      10. 5.6.10. India
        1. 5.6.10.1. India Market size and forecast, 2016-2026 (USD Million)
        2. 5.6.10.2. India Market size and forecast, 2016-2026 (Tons)
      11. 5.6.11. South Korea
        1. 5.6.11.1. South Korea Market size and forecast, 2016-2026 (USD Million)
        2. 5.6.11.2. South Korea Market size and forecast, 2016-2026 (Tons)
      12. 5.6.12. South-East Asia
        1. 5.6.12.1. South-East Asia Market size and forecast, 2016-2026 (USD Million)
        2. 5.6.12.2. South-East Asia Market size and forecast, 2016-2026 (Tons)
      13. 5.6.13. Rest of Asia Pacific
        1. 5.6.13.1. Rest of Asia Pacific Market size and forecast, 2016-2026 (USD Million)
        2. 5.6.13.2. Rest of Asia Pacific Market size and forecast, 2016-2026 (Tons)
    7. 5.7. Latin America
      1. 5.7.1. Latin America Smart Textile Market size and forecast, 2016-2026
      2. 5.7.2. Latin America Smart Textile Market, by Country, 2019 - 2026 (USD Million)
      3. 5.7.3. Latin America Market size and forecast, 2016-2026 (Tons)
      4. 5.7.4. Latin America Smart Textile Market, by Country, 2019 - 2026 (Tons)
      5. 5.7.5. Latin America Smart Textile Market, by Product, 2016-2026
        1. 5.7.5.1. Latin America Smart Textile Market, by Product, 2016-2026 (USD Million)
        2. 5.7.5.2. Latin America Smart Textile Market, by Product, 2016-2026 (Tons)
      6. 5.7.6. Latin America Smart Textile Market, by End Use, 2016-2026
        1. 5.7.6.1. Latin America Smart Textile Market, by End Use, 2016-2026 (USD Million)
        2. 5.7.6.2. Latin America Smart Textile Market, by End Use, 2016-2026 (Tons)
      7. 5.7.7. Latin America Smart Textile Market, by Functionality, 2016-2026
        1. 5.7.7.1. Latin America Smart Textile Market, by Functionality, 2016-2026 (USD Million)
        2. 5.7.7.2. Latin America Smart Textile Market, by Functionality, 2016-2026 (Tons)
      8. 5.7.8. Brazil
        1. 5.7.8.1. Brazil Market size and forecast, 2016-2026 (USD Million)
        2. 5.7.8.2. Brazil Market size and forecast, 2016-2026 (Tons)
      9. 5.7.9. Mexico
        1. 5.7.9.1. Mexico Market size and forecast, 2016-2026 (USD Million)
        2. 5.7.9.2. Mexico Market size and forecast, 2016-2026 (Tons)
      10. 5.7.10. Rest of Latin America
        1. 5.7.10.1. Rest of Latin America Market size and forecast, 2016-2026 (USD Million)
        2. 5.7.10.2. Rest of Latin America Market size and forecast, 2016-2026 (Tons)
    8. 5.8. The Middle-East and Africa
      1. 5.8.1. The Middle-East and Africa Smart Textile Market size and forecast, 2016-2026
      2. 5.8.2. The Middle-East and Africa Smart Textile Market, by Country, 2019 - 2026 (USD Million)
      3. 5.8.3. The Middle-East and Africa Market size and forecast, 2016-2026 (Tons)
      4. 5.8.4. The Middle-East and Africa Smart Textile Market, by Country, 2019 - 2026 (Tons)
      5. 5.8.5. The Middle-East and Africa Smart Textile Market, by Product, 2016-2026
        1. 5.8.5.1. The Middle-East and Africa Smart Textile Market, by Product, 2016-2026 (USD Million)
        2. 5.8.5.2. The Middle-East and Africa Smart Textile Market, by Product, 2016-2026 (Tons)
      6. 5.8.6. The Middle-East and Africa Smart Textile Market, by End Use, 2016-2026
        1. 5.8.6.1. The Middle-East and Africa Smart Textile Market, by End Use, 2016-2026 (USD Million)
        2. 5.8.6.2. The Middle-East and Africa Smart Textile Market, by End Use, 2016-2026 (Tons)
      7. 5.8.7. The Middle-East and Africa Smart Textile Market, by Functionality, 2016-2026
        1. 5.8.7.1. The Middle-East and Africa Smart Textile Market, by Functionality, 2016-2026 (USD Million)
        2. 5.8.7.2. The Middle-East and Africa Smart Textile Market, by Functionality, 2016-2026 (Tons)
      8. 5.8.8. GCC Countries
        1. 5.8.8.1. GCC Countries Market size and forecast, 2016-2026 (USD Million)
        2. 5.8.8.2. GCC Countries Market size and forecast, 2016-2026 (Tons)
      9. 5.8.9. South Africa
        1. 5.8.9.1. South Africa Market size and forecast, 2016-2026 (USD Million)
        2. 5.8.9.2. South Africa Market size and forecast, 2016-2026 (Tons)
      10. 5.8.10. Rest of Middle-East Africa
        1. 5.8.10.1. Rest of Middle-East Africa Market size and forecast, 2016-2026 (USD Million)
        2. 5.8.10.2. Rest of Middle-East Africa Market size and forecast, 2016-2026 (Tons)
  6. CHAPTER 6. Smart Textile Production, Consumption, Export, Import by Regions
    1. 6.1. Global Smart Textile production and revenue, 2016-2026 (USD Million) (Tons)
    2. 6.2. Global Import and Export Analysis, by Region
  7. CHAPTER 7. Smart Textile market – Competitive Landscape
    1. 7.1. Competitor Market Share – Revenue
    2. 7.2. Market Concentration Rate Analysis, Top 3 and Top 5 Players
    3. 7.3. Competitor Market Share – Volume
    4. 7.4. Strategic Development
      1. 7.4.1. Acquisitions and Mergers
      2. 7.4.2. New Products
      3. 7.4.3. Research & Development Activities
  8. CHAPTER 8. Company Profiles
    1. 8.1. AiQ Smart Clothing Inc.
      1. 8.1.1. Company Overview
      2. 8.1.2. AiQ Smart Clothing Inc. Sales, Revenue, Price, and Gross Margin
      3. 8.1.3. Product portfolio
      4. 8.1.4. Recent initiatives
    2. 8.2. EXO2
      1. 8.2.1. Company Overview
      2. 8.2.2. EXO2 Sales, Revenue, Price, and Gross Margin
      3. 8.2.3. Product portfolio
      4. 8.2.4. Recent initiatives
    3. 8.3. Mide Technology Corporation
      1. 8.3.1. Company Overview
      2. 8.3.2. Mide Technology Corporation Sales, Revenue, Price, and Gross Margin
      3. 8.3.3. Product portfolio
      4. 8.3.4. Recent initiatives
    4. 8.4. Ohmatex ApS
      1. 8.4.1. Company Overview
      2. 8.4.2. Ohmatex ApS Sales, Revenue, Price, and Gross Margin
      3. 8.4.3. Product portfolio
      4. 8.4.4. Recent initiatives
    5. 8.5. Thermosoft International Corporation
      1. 8.5.1. Company Overview
      2. 8.5.2. Thermosoft International Corporation Sales, Revenue, Price, and Gross Margin
      3. 8.5.3. Product portfolio
      4. 8.5.4. Recent initiatives
    6. 8.6. Adidas AG
      1. 8.6.1. Company Overview
      2. 8.6.2. Adidas AG Sales, Revenue, Price, and Gross Margin
      3. 8.6.3. Product portfolio
      4. 8.6.4. Recent initiatives
    7. 8.7. Clothing+ (Jabil Circuit, Inc.)
      1. 8.7.1. Company Overview
      2. 8.7.2. Clothing+ (Jabil Circuit, Inc.) Sales, Revenue, Price, and Gross Margin
      3. 8.7.3. Product portfolio
      4. 8.7.4. Recent initiatives
    8. 8.8. Gentherm, Inc.
      1. 8.8.1. Company Overview
      2. 8.8.2. Gentherm, Inc. Sales, Revenue, Price, and Gross Margin
      3. 8.8.3. Product portfolio
      4. 8.8.4. Recent initiatives
    9. 8.9. Nike, Inc.
      1. 8.9.1. Company Overview
      2. 8.9.2. Nike, Inc. Sales, Revenue, Price, and Gross Margin
      3. 8.9.3. Product portfolio
      4. 8.9.4. Recent initiatives
    10. 8.10. Sensing Tex SL
      1. 8.10.1. Company Overview
      2. 8.10.2. Sensing Tex SL Sales, Revenue, Price, and Gross Margin
      3. 8.10.3. Product portfolio
      4. 8.10.4. Recent initiatives
  9. CHAPTER 9. Smart Textile — Industry Analysis
    1. 9.1. Introduction and Taxonomy
    2. 9.2. Smart Textile Market – Key Trends
      1. 9.2.1. Market Drivers
      2. 9.2.2. Market Restraints
      3. 9.2.3. Market Opportunities
    3. 9.3. Value Chain Analysis
    4. 9.4. Key Mandates and Regulations
    5. 9.5. Technology Roadmap and Timeline
    6. 9.6. Smart Textile market – Attractiveness Analysis
      1. 9.6.1. By Product
      2. 9.6.2. By End Use
      3. 9.6.3. By Functionality
      4. 9.6.4. By Region
  10. CHAPTER 10. Raw Material analysis
    1. 10.1. Smart Textile Key Raw Material Analysis
      1. 10.1.1. Key Raw Materials
      2. 10.1.2. Price Trend of Key Raw Materials
    2. 10.2. Key Suppliers of Raw Materials
    3. 10.3. Proportion of Manufacturing Cost Structure
      1. 10.3.1. Raw Materials
      2. 10.3.2. Labor Cost
    4. 10.4. Manufacturing Expenses Analysis of Smart Textile
  11. CHAPTER 11. Industrial Chain, Sourcing Strategy and Downstream Buyers
    1. 11.1. Smart Textile Industrial Chain Analysis
    2. 11.2. Upstream Raw Materials Sourcing
      1. 11.2.1. Risk Mitigation:
      2. 11.2.2. Supplier Relationships:
      3. 11.2.3. Business Processes:
      4. 11.2.4. Securing the Product:
    3. 11.3. Raw Materials Sources of Smart Textile Major Manufacturers in 2016
    4. 11.4. Downstream Buyers
    5. 11.5. Distributors/Traders List
  12. CHAPTER 12. Marketing Strategy Analysis, Distributors
    1. 12.1. Marketing Channel
    2. 12.2. Direct Marketing
    3. 12.3. Indirect Marketing
    4. 12.4. Marketing Channel Development Trend
    5. 12.5. Economic/Political Environmental Change
  13. CHAPTER 13. Report Conclusion
  14. CHAPTER 14. Research Approach & Methodology
    1. 14.1. Report Description
    2. 14.2. Research Scope
    3. 14.3. Research Methodology
      1. 14.3.1. Secondary Research
      2. 14.3.2. Primary Research
      3. 14.3.3. Models
        1. 14.3.3.1. Company Share Analysis Model
        2. 14.3.3.2. Revenue Based Modeling
        3. 14.3.3.3. Research Limitations

        List of Figures

        FIG. 1 Global Smart Textile Market, 2016-2026 (USD Million)
        FIG. 2 Global Smart Textile Market Share, by Product, 2019 & 2026 (USD Million)
        FIG. 3 Global Smart Textile Market share, by Product, 2019 & 2026 (Tons)
        FIG. 4 Global Passive Smart Textile Market, 2016-2026 (USD Million)
        FIG. 5 Global Passive Smart Textile  Market, 2016-2026 (Tons)
        FIG. 6 Global Active Smart Textile Market, 2016-2026 (USD Million)
        FIG. 7 Global Active Smart Textile  Market, 2016-2026 (Tons)
        FIG. 8 Global Very Smart Smart Textile Market, 2016-2026 (USD Million)
        FIG. 9 Global Very Smart Smart Textile  Market, 2016-2026 (Tons)
        FIG. 10 Global Smart Textile Market Share, by  End Use, 2019 & 2026 (USD Million)
        FIG. 11 Global Smart Textile Market share, by  End Use, 2019 & 2026 (Tons)
        FIG. 12 Global Fashion & Entertainment Smart Textile Market, 2016-2026 (USD Million)
        FIG. 13 Global Fashion & Entertainment Smart Textile  Market, 2016-2026 (Tons)
        FIG. 14 Global Sports & Fitness Smart Textile Market, 2016-2026 (USD Million)
        FIG. 15 Global Sports & Fitness Smart Textile  Market, 2016-2026 (Tons)
        FIG. 16 Global Medical Smart Textile Market, 2016-2026 (USD Million)
        FIG. 17 Global Medical Smart Textile  Market, 2016-2026 (Tons)
        FIG. 18 Global Transportation Smart Textile Market, 2016-2026 (USD Million)
        FIG. 19 Global Transportation Smart Textile  Market, 2016-2026 (Tons)
        FIG. 20 Global Protection & Military Smart Textile Market, 2016-2026 (USD Million)
        FIG. 21 Global Protection & Military Smart Textile  Market, 2016-2026 (Tons)
        FIG. 22 Global Architecture Smart Textile Market, 2016-2026 (USD Million)
        FIG. 23 Global Architecture Smart Textile  Market, 2016-2026 (Tons)
        FIG. 24 Global Smart Textile Market Share, by Functionality, 2019 & 2026 (USD Million)
        FIG. 25 Global Smart Textile Market share, by Functionality, 2019 & 2026 (Tons)
        FIG. 26 Global Sensing Smart Textile Market, 2016-2026 (USD Million)
        FIG. 27 Global Sensing Smart Textile  Market, 2016-2026 (Tons)
        FIG. 28 Global Energy Harvesting Smart Textile Market, 2016-2026 (USD Million)
        FIG. 29 Global Energy Harvesting Smart Textile  Market, 2016-2026 (Tons)
        FIG. 30 Global Luminescence & Aesthetics Smart Textile Market, 2016-2026 (USD Million)
        FIG. 31 Global Luminescence & Aesthetics Smart Textile  Market, 2016-2026 (Tons)
        FIG. 32 Global Thermoelectricity Smart Textile Market, 2016-2026 (USD Million)
        FIG. 33 Global Thermoelectricity Smart Textile  Market, 2016-2026 (Tons)
        FIG. 34 Global Others Smart Textile Market, 2016-2026 (USD Million)
        FIG. 35 Global Others Smart Textile  Market, 2016-2026 (Tons)
        FIG. 36 Global Smart Textile Market Share, by Region, 2019 & 2026
        FIG. 37 Global Smart Textile Market Share, by Region, 2019 & 2026
        FIG. 38 North America Smart Textile Market, 2016-2026
        FIG. 39 North America Smart Textile  Market, 2016-2026 (Tons)
        FIG. 40 U.S. Smart Textile Market, 2016-2026
        FIG. 41 U.S. Smart Textile  Market, 2016-2026 (Tons)
        FIG. 42 Canada Smart Textile Market, 2016-2026
        FIG. 43 Canada Smart Textile  Market, 2016-2026 (Tons)
        FIG. 44 Europe Smart Textile Market, 2016-2026
        FIG. 45 Europe Smart Textile  Market, 2016-2026 (Tons)
        FIG. 46 Germany Smart Textile Market, 2016-2026
        FIG. 47 Germany Smart Textile  Market, 2016-2026 (Tons)
        FIG. 48 France Smart Textile Market, 2016-2026
        FIG. 49 France Smart Textile  Market, 2016-2026 (Tons)
        FIG. 50 U.K. Smart Textile Market, 2016-2026
        FIG. 51 U.K. Smart Textile  Market, 2016-2026 (Tons)
        FIG. 52 Italy Smart Textile Market, 2016-2026
        FIG. 53 Italy Smart Textile  Market, 2016-2026 (Tons)
        FIG. 54 Spain Smart Textile Market, 2016-2026
        FIG. 55 Spain Smart Textile  Market, 2016-2026 (Tons)
        FIG. 56 Rest of Europe Smart Textile Market, 2016-2026
        FIG. 57 Rest of Europe Smart Textile  Market, 2016-2026 (Tons)
        FIG. 58 Asia Pacific Smart Textile Market, 2016-2026
        FIG. 59 Asia Pacific Smart Textile  Market, 2016-2026 (Tons)
        FIG. 60 China Smart Textile Market, 2016-2026
        FIG. 61 China Smart Textile  Market, 2016-2026 (Tons)
        FIG. 62 Japan Smart Textile Market, 2016-2026
        FIG. 63 Japan Smart Textile  Market, 2016-2026 (Tons)
        FIG. 64 India Smart Textile Market, 2016-2026
        FIG. 65 India Smart Textile  Market, 2016-2026 (Tons)
        FIG. 66 South  Korea Smart Textile Market, 2016-2026
        FIG. 67 South  Korea Smart Textile  Market, 2016-2026 (Tons)
        FIG. 68 South-East Asia Smart Textile Market, 2016-2026
        FIG. 69 South-East Asia Smart Textile  Market, 2016-2026 (Tons)
        FIG. 70 Rest of Asia Pacific Smart Textile Market, 2016-2026
        FIG. 71 Rest of Asia Pacific Smart Textile  Market, 2016-2026 (Tons)
        FIG. 72 Latin America Smart Textile Market, 2016-2026
        FIG. 73 Latin America Smart Textile  Market, 2016-2026 (Tons)
        FIG. 74 Brazil Smart Textile Market, 2016-2026
        FIG. 75 Brazil Smart Textile  Market, 2016-2026 (Tons)
        FIG. 76 Mexico Smart Textile Market, 2016-2026
        FIG. 77 Mexico Smart Textile  Market, 2016-2026 (Tons)
        FIG. 78 Rest of Latin America Smart Textile Market, 2016-2026
        FIG. 79 Rest of Latin America Smart Textile  Market, 2016-2026 (Tons)
        FIG. 80 The Middle-East and Africa Smart Textile Market, 2016-2026
        FIG. 81 The Middle-East and Africa Smart Textile  Market, 2016-2026 (Tons)
        FIG. 82 GCC Countries Smart Textile Market, 2016-2026
        FIG. 83 GCC Countries Smart Textile  Market, 2016-2026 (Tons)
        FIG. 84 South Africa Smart Textile Market, 2016-2026
        FIG. 85 South Africa Smart Textile  Market, 2016-2026 (Tons)
        FIG. 86 Rest of Middle-East Africa Smart Textile Market, 2016-2026
        FIG. 87 Rest of Middle-East Africa Smart Textile  Market, 2016-2026 (Tons)
        FIG. 88 Global Smart Textile production and revenue, 2016-2026 (USD Million) (Tons)
        FIG. 89 North America Smart Textile production and revenue, 2016-2026 (USD Million) (Tons)
        FIG. 90 Europe Smart Textile production and revenue, 2016-2026 (USD Million) (Tons)
        FIG. 91 Asia Pacific Smart Textile production and revenue, 2016-2026 (USD Million) (Tons)
        FIG. 92 Latin America Smart Textile production and revenue, 2016-2026 (USD Million) (Tons)
        FIG. 93 Middle East and Africa Smart Textile production and revenue, 2016-2026 (USD Million) (Tons)
        FIG. 94 Competitor Market Share – Revenue
        FIG. 95 Competitor Market Share – Volume
        FIG. 96 AiQ Smart Clothing Inc. Revenue and Growth Rate
        FIG. 97 AiQ Smart Clothing Inc. Market Share
        FIG. 98 EXO2 Revenue and Growth Rate
        FIG. 99 EXO2 Market Share
        FIG. 100 Mide Technology Corporation Revenue and Growth Rate
        FIG. 101 Mide Technology Corporation Market Share
        FIG. 102 Ohmatex ApS Revenue and Growth Rate
        FIG. 103 Ohmatex ApS Market Share
        FIG. 104 Thermosoft International Corporation Revenue and Growth Rate
        FIG. 105 Thermosoft International Corporation Market Share
        FIG. 106 Adidas AG Revenue and Growth Rate
        FIG. 107 Adidas AG Market Share
        FIG. 108 Clothing+ (Jabil Circuit, Inc.) Revenue and Growth Rate
        FIG. 109 Clothing+ (Jabil Circuit, Inc.) Market Share
        FIG. 110 Gentherm, Inc. Revenue and Growth Rate
        FIG. 111 Gentherm, Inc. Market Share
        FIG. 112 Nike, Inc. Revenue and Growth Rate
        FIG. 113 Nike, Inc. Market Share
        FIG. 114 Sensing Tex SL Revenue and Growth Rate
        FIG. 115 Sensing Tex SL Market Share
        FIG. 116 Market Dynamics
        FIG. 117 Global Smart Textile – Value Chain Analysis
        FIG. 118 Key Mandates and Regulations
        FIG. 119 Technology Roadmap and Timeline
        FIG. 120 Market Attractiveness Analysis – By Product
        FIG. 121 Market Attractiveness Analysis – By  End Use
        FIG. 122 Market Attractiveness Analysis – By Functionality
        FIG. 123 Market Attractiveness Analysis – By Region
        FIG. 124 Manufacturing Cost Structure of Smart Textile
        FIG. 125 Smart Textile Industrial Chain Analysis
        FIG. 126 Market Channel
        FIG. 127 Marketing Channel Development Trend
        FIG. 128 Growth in World Gross Product, 2008-2018

        List of Tables

        TABLE 1 Global Smart Textile market, 2019 & 2026 (USD Million)
        TABLE 2 Global Smart Textile market, by Product, 2016-2026 (USD Million)
        TABLE 3 Global Smart Textile market, by Product, 2016-2026 (Tons)
        TABLE 4 Global Smart Textile market, by  End Use, 2016-2026 (USD Million)
        TABLE 5 Global Smart Textile market, by  End Use, 2016-2026 (Tons)
        TABLE 6 Global Smart Textile market, by Functionality, 2016-2026 (USD Million)
        TABLE 7 Global Smart Textile market, by Functionality, 2016-2026 (Tons)
        TABLE 8 Global Smart Textile market, by region, 2016-2026 (USD Million)
        TABLE 9 Global Smart Textile market, by region, 2016-2026 (Tons)
        TABLE 10 North America Smart Textile Market, by Product, 2016-2026 (USD Million)
        TABLE 11 North America Smart Textile Market, by Product, 2016-2026 (Tons)
        TABLE 12 North America Smart Textile Market, by  End Use, 2016-2026 (USD Million)
        TABLE 13 North America Smart Textile Market, by  End Use, 2016-2026 (Tons)
        TABLE 14 North America Smart Textile Market, by Functionality, 2016-2026 (USD Million)
        TABLE 15 North America Smart Textile Market, by Functionality, 2016-2026 (Tons)
        TABLE 16 Europe Smart Textile Market, by Product, 2016-2026 (USD Million)
        TABLE 17 Europe Smart Textile Market, by Product, 2016-2026 (Tons)
        TABLE 18 Europe Smart Textile Market, by  End Use, 2016-2026 (USD Million)
        TABLE 19 Europe Smart Textile Market, by  End Use, 2016-2026 (Tons)
        TABLE 20 Europe Smart Textile Market, by Functionality, 2016-2026 (USD Million)
        TABLE 21 Europe Smart Textile Market, by Functionality, 2016-2026 (Tons)
        TABLE 22 Asia Pacific Smart Textile Market, by Product, 2016-2026 (USD Million)
        TABLE 23 Asia Pacific Smart Textile Market, by Product, 2016-2026 (Tons)
        TABLE 24 Asia Pacific Smart Textile Market, by  End Use, 2016-2026 (USD Million)
        TABLE 25 Asia Pacific Smart Textile Market, by  End Use, 2016-2026 (Tons)
        TABLE 26 Asia Pacific Smart Textile Market, by Functionality, 2016-2026 (USD Million)
        TABLE 27 Asia Pacific Smart Textile Market, by Functionality, 2016-2026 (Tons)
        TABLE 28 Latin America Smart Textile Market, by Product, 2016-2026 (USD Million)
        TABLE 29 Latin America Smart Textile Market, by Product, 2016-2026 (Tons)
        TABLE 30 Latin America Smart Textile Market, by  End Use, 2016-2026 (USD Million)
        TABLE 31 Latin America Smart Textile Market, by  End Use, 2016-2026 (Tons)
        TABLE 32 Latin America Smart Textile Market, by Functionality, 2016-2026 (USD Million)
        TABLE 33 Latin America Smart Textile Market, by Functionality, 2016-2026 (Tons)
        TABLE 34 The Middle-East and Africa Smart Textile Market, by Product, 2016-2026 (USD Million)
        TABLE 35 The Middle-East and Africa Smart Textile Market, by Product, 2016-2026 (Tons)
        TABLE 36 The Middle-East and Africa Smart Textile Market, by  End Use, 2016-2026 (USD Million)
        TABLE 37 The Middle-East and Africa Smart Textile Market, by  End Use, 2016-2026 (Tons)
        TABLE 38 The Middle-East and Africa Smart Textile Market, by Functionality, 2016-2026 (USD Million)
        TABLE 39 The Middle-East and Africa Smart Textile Market, by Functionality, 2016-2026 (Tons)
        TABLE 40 North America Smart Textile Production, Consumption, Export, Import, 2016-2019
        TABLE 41 Europe Smart Textile Production, Consumption, Export, Import, 2016-2019
        TABLE 42 Asia Pacific Smart Textile Production, Consumption, Export, Import, 2016-2019
        TABLE 43 Latin America Smart Textile Production, Consumption, Export, Import, 2016-2019
        TABLE 44 Middle East & Africa Smart Textile Production, Consumption, Export, Import, 2016-2019
        TABLE 45 Global Smart Textile Market - Company Revenue Analysis 2016-2019 (USD Million)
        TABLE 46 Global Smart Textile Market - Company Revenue Share Analysis 2016-2019(%)
        TABLE 47 Global Smart Textile Market - Company Volume Analysis 2016-2019 (Tons)
        TABLE 48 Global Smart Textile Market - Company Volume Share Analysis 2016-2019(%)
        TABLE 49 Acquisitions and Mergers
        TABLE 50 New Product/Service Launch
        TABLE 51 Research & Development Activities
        TABLE 52 Market Drivers
        TABLE 53 Market Restraints
        TABLE 54 Market Opportunities
        TABLE 55 Production Base and Market Concentration Rate of Raw Material
        TABLE 56 Key Suppliers of Raw Materials
        TABLE 57 Raw Materials Sources of Smart Textile Major Manufacturers in 2016
        TABLE 58 Major Buyers of Smart Textile
        TABLE 59 Distributors/Traders of Smart Textile by Region

Industry Major Market Players

  • AiQ Smart Clothing Inc.
  •  EXO2
  •  Mide Technology Corporation
  •  OhmatexApS
  •  Thermosoft International Corporation
  • Clothing+ (Jabil Circuit, Inc.)
  • Gentherm Inc.
  • Nike  Inc.
  • Sensing Tex SL
  • Adidas AG
  • and others.