Search Market Research Report

Discover Our Latest Reports
Discover Our Featured Reports
Discover Top Selling Reports

Smart Pneumatics Market Size, Share Global Analysis Report, 2021 – 2026

report img

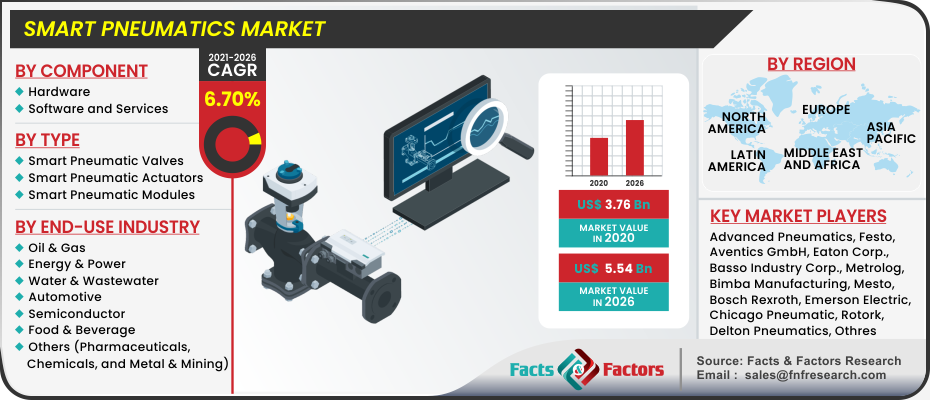
Smart Pneumatics Market By Component (Hardware, Software and Services), By Type (Smart Pneumatic Valves, Smart Pneumatic Actuators, Smart Pneumatic Modules), By End-Use Industry (Oil & Gas, Energy & Power, Water & Wastewater, Automotive, Semiconductor, Food & Beverage, and Others (Pharmaceuticals, Chemicals, and Metal & Mining)) By Region: Global & Regional Industry Perspective, Comprehensive Analysis, and Forecast 2021 – 2026

Industry Insights

[197+ Pages Report] According to a recent survey report issued by Facts and Factors, the global Smart Pneumatics Market stood at USD 3.76 Billion in 2020 and is projected to rise to USD 5.54 Billion in the year 2026, expanding at a CAGR of nearly 6.70% between 2021 and 2026.

logoMarket Overview     

Smart pneumatics is one of the most often used and favored pieces of equipment in the world, and it may be utilized in a variety of situations. It is a piece of machinery that is used to handle and carry items inside the confines of an industry. It is used in a variety of sectors, including automotive, manufacturing, retail, food and beverage, and transportation. Smart Pneumatics encompass a wide range of items, including belt conveyors, rollers, and pallets, among others. The usage of Smart pneumatics enables a bigger volume of commodities to be handled with greater efficiency. Smart pneumatics are material handling machinery and equipment that transfer heavy or bulky raw materials and/or completed goods from one location to another in a fraction of the time that human labor would take.

logoIndustry Growth Factors

The growing use of smart pneumatics in various sectors such as automotive, software, and services, among others, has fueled the worldwide smart pneumatics market's rise. Smart pneumatics are widely used in the automobile industry since they assist in ensuring that the production process is carried out efficiently. Automobile manufacturers are also implementing IoT technologies in order to improve asset monitoring and energy efficiency. In the automobile sector, this has generated a great development potential for smart pneumatics. Smart pneumatics is also increasingly being used in software and service components.  

One of the primary factors driving the growth of the smart pneumatics market is the increasing usage of the Internet of Things (IoT) across industries. By integrating smart technologies into traditional industrial components, the industrial internet of things (IIoT) has taken control. Pneumatic systems were formerly popular in industry because of their speed and dependability. By allowing pneumatic equipment to supply data for analytical procedures, the IIoT has extended its possibilities.

Smart Pneumatics Market

To know more about this report | Request Free Sample Copy

logoSegmentation Analysis

The global Smart Pneumatics market is segregated based on component, type, end-use industry, and region. Based on components, the global smart pneumatics industry is categorized into hardware, software, and services. Based on type, the global smart pneumatics industry is categorized into smart pneumatic actuators, smart pneumatic valves, and smart pneumatic modules. Based on the end-use industry, the global smart pneumatics industry is categorized into oil & gas, energy & power, water & wastewater, automotive, semiconductor, food & beverage, and others (pharmaceuticals, chemicals, and metal & mining).

logoReport Scope

Report Attribute

Details

Market Size in 2020

USD 3.76 Billion

Projected Market Size in 2026

USD 5.54 Billion

CAGR Growth Rate

6.70% CAGR

Base Year

2020

Historical Years

2016-2020

Forecast Years

2021-2026

Key Market Players

Advanced Pneumatics, Aventics GmbH, Basso Industry Corp., Bimba Manufacturing, Bosch Rexroth, Chicago Pneumatic, Cypress EnviroSystems Corp, Delton Pneumatics, Eaton Corp., Emerson Electric, Festo, Gardner Denver, Ham-Let Group, Hitachi Koki, Ingersoll Rand Inc., Jiffy Air Tool, Kramer Air Tools Inc., Makita Corp., Mann+Hummel, Mesto, Metrolog, Mitsubishi Heavy Industries Ltd., Ningbo Smart Pneumatic Co. Ltd., and others.

Key Segment

By Component, By Type, By End-Use Industry, and By Region

Major Regions Covered

North America, Europe, Asia Pacific, Latin America, and the Middle East & Africa

Purchase Options

Request customized purchase options to meet your research needs. Explore purchase options

logo Regional Analysis

In 2020, Asia Pacific is likely to be the leading regional Smart Pneumatics market As a result of the increased adoption of smart manufacturing or Industry 4.0 in numerous sectors, the Asia Pacific is expected to dominate over the forecast period, creating a substantial demand for smart pneumatics in the region. Also boosting demand for smart pneumatic systems in the Asia Pacific is a growing focus on optimum asset application, stringent regulatory rules for the workplace and personal safety, and rigorous quality control in the automotive, semiconductor, chemicals, and food & beverage sectors.

logo Competitive Players

Some main participants of the global Smart Pneumatics market are

  • Advanced Pneumatics
  • Aventics GmbH
  • Basso Industry Corp.
  • Bimba Manufacturing
  • Bosch Rexroth
  • Chicago Pneumatic
  • Cypress EnviroSystems Corp
  • Delton Pneumatics
  • Eaton Corp.
  • Emerson Electric
  • Festo
  • Gardner Denver
  • Ham-Let Group
  • Hitachi Koki
  • Ingersoll Rand Inc.
  • Jiffy Air Tool
  • K ramer Air Tools Inc.
  • Makita Corp.
  • Mann+Hummel
  • Mesto
  • Metrolog
  • Mitsubishi Heavy Industries Ltd.
  • Ningbo Smart Pneumatic Co. Ltd.
  • P&F Industries
  • Parker Hannifin
  • Pneumatic Products
  • Rotex Automation Limited
  • Rotork
  • SMC Corp. of America
  • Solution Control and Engineering Co.
  • Stanley Black & Decker Inc.
  • The Smart Actuator Company
  • Thomson Industries
  • VAC-U-MAX 

logoSmart Pneumatics Market: By Component

  • Hardware
  • Software and Services

logoSmart Pneumatics Market: By Type

  • Smart Pneumatic Valves
  • Smart Pneumatic Actuators
  • Smart Pneumatic Modules

logoSmart Pneumatics Market: By End-Use Industry

  • Oil & Gas
  • Energy & Power
  • Water & Wastewater
  • Automotive
  • Semiconductor
  • Food & Beverage
  • Others (Pharmaceuticals, Chemicals, and Metal & Mining)

logoSmart Pneumatics Market: Regional Segment Analysis

  • North America
    • U.S.
    • Canada
  • Europe
    • UK
    • France
    • Germany
    • Italy
    • Spain
    • Rest of Europe
  • Asia Pacific
    • China
    • Japan
    • India
    • South Korea
    • Southeast Asia
    • Rest of Asia Pacific
  • Latin America
    • Brazil
    • Mexico
    • Rest of Latin America
  • Middle East and Africa
    • GCC Countries
    • South Africa
    • Rest of MEA

Table of Content

  1. Chapter 1 Executive Summary
    1. 1.1. Introduction of Smart Pneumatics
    2. 1.2. Global Smart Pneumatics Market, 2020 & 2026 (USD Million)
    3. 1.3. Global Smart Pneumatics Market, 2016 – 2026 (USD Million)
    4. 1.4. Global Smart Pneumatics Market Absolute Revenue Opportunity, 2016 – 2026 (USD Million)
    5. 1.5. Global Smart Pneumatics Market Incremental Revenue Opportunity, 2020 – 2026 (USD Million)
  2. Chapter 2 Smart Pneumatics Market – Component Analysis
    1. 2.1. Global Smart Pneumatics Market – Component Overview
    2. 2.2. Global Smart Pneumatics Market Share, by Component, 2020 & 2026 (USD Million)
    3. 2.3. Hardware
      1. 2.3.1. Global Hardware Smart Pneumatics Market, 2016 – 2026 (USD Million)
    4. 2.4. Software and Services
      1. 2.4.1. Global Software and Services Smart Pneumatics Market, 2016 – 2026 (USD Million)
  3. Chapter 3 Smart Pneumatics Market – Type Analysis
    1. 3.1. Global Smart Pneumatics Market – Type Overview
    2. 3.2. Global Smart Pneumatics Market Share, by Type, 2020 & 2026 (USD Million)
    3. 3.3. Smart Pneumatic Valves
      1. 3.3.1. Global Smart Pneumatic Valves Smart Pneumatics Market, 2016 – 2026 (USD Million)
    4. 3.4. Smart Pneumatic Actuators
      1. 3.4.1. Global Smart Pneumatic Actuators Smart Pneumatics Market, 2016 – 2026 (USD Million)
    5. 3.5. Smart Pneumatic Modules
      1. 3.5.1. Global Smart Pneumatic Modules Smart Pneumatics Market, 2016 – 2026 (USD Million)
  4. Chapter 4 Smart Pneumatics Market – End-Use Industry Analysis
    1. 4.1. Global Smart Pneumatics Market – End-Use Industry Overview
    2. 4.2. Global Smart Pneumatics Market Share, by End-Use Industry, 2020 & 2026 (USD Million)
    3. 4.3. Oil & Gas
      1. 4.3.1. Global Oil & Gas Smart Pneumatics Market, 2016 – 2026 (USD Million)
    4. 4.4. Energy & Power
      1. 4.4.1. Global Energy & Power Smart Pneumatics Market, 2016 – 2026 (USD Million)
    5. 4.5. Water & Wastewater
      1. 4.5.1. Global Water & Wastewater Smart Pneumatics Market, 2016 – 2026 (USD Million)
    6. 4.6. Automotive
      1. 4.6.1. Global Automotive Smart Pneumatics Market, 2016 – 2026 (USD Million)
    7. 4.7. Semiconductor
      1. 4.7.1. Global Semiconductor Smart Pneumatics Market, 2016 – 2026 (USD Million)
    8. 4.8. Food & Beverage
      1. 4.8.1. Global Food & Beverage Smart Pneumatics Market, 2016 – 2026 (USD Million)
    9. 4.9. Others (Pharmaceuticals, Chemicals, and Metal & Mining)
      1. 4.9.1. Global Others (Pharmaceuticals, Chemicals, and Metal & Mining) Smart Pneumatics Market, 2016 – 2026 (USD Million)
  5. Chapter 5 Smart Pneumatics Market – Regional Analysis
    1. 5.1. Global Smart Pneumatics Market Regional Overview
    2. 5.2. Global Smart Pneumatics Market Share, by Region, 2020 & 2026 (USD Million)
    3. 5.3. North America
      1. 5.3.1. North America Smart Pneumatics Market, 2016 – 2026 (USD Million)
        1. 5.3.1.1. North America Smart Pneumatics Market, by Country, 2016 - 2026 (USD Million)
      2. 5.3.2. North America Smart Pneumatics Market, by Component, 2016 – 2026
        1. 5.3.2.1. North America Smart Pneumatics Market, by Component, 2016 – 2026 (USD Million)
      3. 5.3.3. North America Smart Pneumatics Market, by Type, 2016 – 2026
        1. 5.3.3.1. North America Smart Pneumatics Market, by Type, 2016 – 2026 (USD Million)
      4. 5.3.4. North America Smart Pneumatics Market, by End-Use Industry, 2016 – 2026
        1. 5.3.4.1. North America Smart Pneumatics Market, by End-Use Industry, 2016 – 2026 (USD Million)
      5. 5.3.5. U.S.
        1. 5.3.5.1. U.S. Smart Pneumatics Market, 2016 – 2026 (USD Million)
      6. 5.3.6. Canada
        1. 5.3.6.1. Canada Smart Pneumatics Market, 2016 – 2026 (USD Million)
    4. 5.4. Europe
      1. 5.4.1. Europe Smart Pneumatics Market, 2016 – 2026 (USD Million)
        1. 5.4.1.1. Europe Smart Pneumatics Market, by Country, 2016 - 2026 (USD Million)
      2. 5.4.2. Europe Smart Pneumatics Market, by Component, 2016 – 2026
        1. 5.4.2.1. Europe Smart Pneumatics Market, by Component, 2016 – 2026 (USD Million)
      3. 5.4.3. Europe Smart Pneumatics Market, by Type, 2016 – 2026
        1. 5.4.3.1. Europe Smart Pneumatics Market, by Type, 2016 – 2026 (USD Million)
      4. 5.4.4. Europe Smart Pneumatics Market, by End-Use Industry, 2016 – 2026
        1. 5.4.4.1. Europe Smart Pneumatics Market, by End-Use Industry, 2016 – 2026 (USD Million)
      5. 5.4.5. Germany
        1. 5.4.5.1. Germany Smart Pneumatics Market, 2016 – 2026 (USD Million)
      6. 5.4.6. France
        1. 5.4.6.1. France Smart Pneumatics Market, 2016 – 2026 (USD Million)
      7. 5.4.7. U.K.
        1. 5.4.7.1. U.K. Smart Pneumatics Market, 2016 – 2026 (USD Million)
      8. 5.4.8. Italy
        1. 5.4.8.1. Italy Smart Pneumatics Market, 2016 – 2026 (USD Million)
      9. 5.4.9. Spain
        1. 5.4.9.1. Spain Smart Pneumatics Market, 2016 – 2026 (USD Million)
      10. 5.4.10. Rest of Europe
        1. 5.4.10.1. Rest of Europe Smart Pneumatics Market, 2016 – 2026 (USD Million)
    5. 5.5. Asia Pacific
      1. 5.5.1. Asia Pacific Smart Pneumatics Market, 2016 – 2026 (USD Million)
        1. 5.5.1.1. Asia Pacific Smart Pneumatics Market, by Country, 2016 - 2026 (USD Million)
      2. 5.5.2. Asia Pacific Smart Pneumatics Market, by Component, 2016 – 2026
        1. 5.5.2.1. Asia Pacific Smart Pneumatics Market, by Component, 2016 – 2026 (USD Million)
      3. 5.5.3. Asia Pacific Smart Pneumatics Market, by Type, 2016 – 2026
        1. 5.5.3.1. Asia Pacific Smart Pneumatics Market, by Type, 2016 – 2026 (USD Million)
      4. 5.5.4. Asia Pacific Smart Pneumatics Market, by End-Use Industry, 2016 – 2026
        1. 5.5.4.1. Asia Pacific Smart Pneumatics Market, by End-Use Industry, 2016 – 2026 (USD Million)
      5. 5.5.5. China
        1. 5.5.5.1. China Smart Pneumatics Market, 2016 – 2026 (USD Million)
      6. 5.5.6. Japan
        1. 5.5.6.1. Japan Smart Pneumatics Market, 2016 – 2026 (USD Million)
      7. 5.5.7. India
        1. 5.5.7.1. India Smart Pneumatics Market, 2016 – 2026 (USD Million)
      8. 5.5.8. South Korea
        1. 5.5.8.1. South Korea Smart Pneumatics Market, 2016 – 2026 (USD Million)
      9. 5.5.9. South-East Asia
        1. 5.5.9.1. South-East Asia Smart Pneumatics Market, 2016 – 2026 (USD Million)
      10. 5.5.10. Rest of Asia Pacific
        1. 5.5.10.1. Rest of Asia Pacific Smart Pneumatics Market, 2016 – 2026 (USD Million)
    6. 5.6. Latin America
      1. 5.6.1. Latin America Smart Pneumatics Market, 2016 – 2026 (USD Million)
        1. 5.6.1.1. Latin America Smart Pneumatics Market, by Country, 2016 - 2026 (USD Million)
      2. 5.6.2. Latin America Smart Pneumatics Market, by Component, 2016 – 2026
        1. 5.6.2.1. Latin America Smart Pneumatics Market, by Component, 2016 – 2026 (USD Million)
      3. 5.6.3. Latin America Smart Pneumatics Market, by Type, 2016 – 2026
        1. 5.6.3.1. Latin America Smart Pneumatics Market, by Type, 2016 – 2026 (USD Million)
      4. 5.6.4. Latin America Smart Pneumatics Market, by End-Use Industry, 2016 – 2026
        1. 5.6.4.1. Latin America Smart Pneumatics Market, by End-Use Industry, 2016 – 2026 (USD Million)
      5. 5.6.5. Brazil
        1. 5.6.5.1. Brazil Smart Pneumatics Market, 2016 – 2026 (USD Million)
      6. 5.6.6. Mexico
        1. 5.6.6.1. Mexico Smart Pneumatics Market, 2016 – 2026 (USD Million)
      7. 5.6.7. Rest of Latin America
        1. 5.6.7.1. Rest of Latin America Smart Pneumatics Market, 2016 – 2026 (USD Million)
    7. 5.7. The Middle-East and Africa
      1. 5.7.1. The Middle-East and Africa Smart Pneumatics Market, 2016 – 2026 (USD Million)
        1. 5.7.1.1. The Middle-East and Africa Smart Pneumatics Market, by Country, 2016 - 2026 (USD Million)
      2. 5.7.2. The Middle-East and Africa Smart Pneumatics Market, by Component, 2016 – 2026
        1. 5.7.2.1. The Middle-East and Africa Smart Pneumatics Market, by Component, 2016 – 2026 (USD Million)
      3. 5.7.3. The Middle-East and Africa Smart Pneumatics Market, by Type, 2016 – 2026
        1. 5.7.3.1. The Middle-East and Africa Smart Pneumatics Market, by Type, 2016 – 2026 (USD Million)
      4. 5.7.4. The Middle-East and Africa Smart Pneumatics Market, by End-Use Industry, 2016 – 2026
        1. 5.7.4.1. The Middle-East and Africa Smart Pneumatics Market, by End-Use Industry, 2016 – 2026 (USD Million)
      5. 5.7.5. GCC Countries
        1. 5.7.5.1. GCC Countries Smart Pneumatics Market, 2016 – 2026 (USD Million)
      6. 5.7.6. South Africa
        1. 5.7.6.1. South Africa Smart Pneumatics Market, 2016 – 2026 (USD Million)
      7. 5.7.7. Rest of Middle-East Africa
        1. 5.7.7.1. Rest of Middle-East Africa Smart Pneumatics Market, 2016 – 2026 (USD Million)
  6. Chapter 6 Smart Pneumatics Market – Competitive Landscape
    1. 6.1. Competitor Market Share – Revenue
    2. 6.2. Market Concentration Rate Analysis, Top 3 and Top 5 Players
    3. 6.3. Strategic Developments
      1. 6.3.1. Acquisitions and Mergers
      2. 6.3.2. New Products
      3. 6.3.3. Research & Development Activities
  7. Chapter 7 Company Profiles
    1. 7.1. Advanced Pneumatics
      1. 7.1.1. Company Overview
      2. 7.1.2. Product/Service Portfolio
      3. 7.1.3. Advanced Pneumatics Sales, Revenue, and Gross Margin
      4. 7.1.4. Advanced Pneumatics Revenue and Growth Rate
      5. 7.1.5. Advanced Pneumatics Market Share
      6. 7.1.6. Recent Initiatives, Funding/VC Activities, and Technological Innovations
    2. 7.2. Aventics GmbH
      1. 7.2.1. Company Overview
      2. 7.2.2. Product/Service Portfolio
      3. 7.2.3. Aventics GmbH Sales, Revenue, and Gross Margin
      4. 7.2.4. Aventics GmbH Revenue and Growth Rate
      5. 7.2.5. Aventics GmbH Market Share
      6. 7.2.6. Recent Initiatives, Funding/VC Activities, and Technological Innovations
    3. 7.3. Basso Industry Corp.
      1. 7.3.1. Company Overview
      2. 7.3.2. Product/Service Portfolio
      3. 7.3.3. Basso Industry Corp. Sales, Revenue, and Gross Margin
      4. 7.3.4. Basso Industry Corp. Revenue and Growth Rate
      5. 7.3.5. Basso Industry Corp. Market Share
      6. 7.3.6. Recent Initiatives, Funding/VC Activities, and Technological Innovations
    4. 7.4. Bimba Manufcatruing
      1. 7.4.1. Company Overview
      2. 7.4.2. Product/Service Portfolio
      3. 7.4.3. Bimba Manufcatruing Sales, Revenue, and Gross Margin
      4. 7.4.4. Bimba Manufcatruing Revenue and Growth Rate
      5. 7.4.5. Bimba Manufcatruing Market Share
      6. 7.4.6. Recent Initiatives, Funding/VC Activities, and Technological Innovations
    5. 7.5. Bosch Rexroth
      1. 7.5.1. Company Overview
      2. 7.5.2. Product/Service Portfolio
      3. 7.5.3. Bosch Rexroth Sales, Revenue, and Gross Margin
      4. 7.5.4. Bosch Rexroth Revenue and Growth Rate
      5. 7.5.5. Bosch Rexroth Market Share
      6. 7.5.6. Recent Initiatives, Funding/VC Activities, and Technological Innovations
    6. 7.6. Chicago Pneumatic
      1. 7.6.1. Company Overview
      2. 7.6.2. Product/Service Portfolio
      3. 7.6.3. Chicago Pneumatic Sales, Revenue, and Gross Margin
      4. 7.6.4. Chicago Pneumatic Revenue and Growth Rate
      5. 7.6.5. Chicago Pneumatic Market Share
      6. 7.6.6. Recent Initiatives, Funding/VC Activities, and Technological Innovations
    7. 7.7. Cypress EnviroSystems Corp
      1. 7.7.1. Company Overview
      2. 7.7.2. Product/Service Portfolio
      3. 7.7.3. Cypress EnviroSystems Corp Sales, Revenue, and Gross Margin
      4. 7.7.4. Cypress EnviroSystems Corp Revenue and Growth Rate
      5. 7.7.5. Cypress EnviroSystems Corp Market Share
      6. 7.7.6. Recent Initiatives, Funding/VC Activities, and Technological Innovations
    8. 7.8. Delton Pneumatics
      1. 7.8.1. Company Overview
      2. 7.8.2. Product/Service Portfolio
      3. 7.8.3. Delton Pneumatics Sales, Revenue, and Gross Margin
      4. 7.8.4. Delton Pneumatics Revenue and Growth Rate
      5. 7.8.5. Delton Pneumatics Market Share
      6. 7.8.6. Recent Initiatives, Funding/VC Activities, and Technological Innovations
    9. 7.9. Eaton Corp.
      1. 7.9.1. Company Overview
      2. 7.9.2. Product/Service Portfolio
      3. 7.9.3. Eaton Corp. Sales, Revenue, and Gross Margin
      4. 7.9.4. Eaton Corp. Revenue and Growth Rate
      5. 7.9.5. Eaton Corp. Market Share
      6. 7.9.6. Recent Initiatives, Funding/VC Activities, and Technological Innovations
    10. 7.10. Emerson Electric
      1. 7.10.1. Company Overview
      2. 7.10.2. Product/Service Portfolio
      3. 7.10.3. Emerson Electric Sales, Revenue, and Gross Margin
      4. 7.10.4. Emerson Electric Revenue and Growth Rate
      5. 7.10.5. Emerson Electric Market Share
      6. 7.10.6. Recent Initiatives, Funding/VC Activities, and Technological Innovations
    11. 7.11. Festo
      1. 7.11.1. Company Overview
      2. 7.11.2. Product/Service Portfolio
      3. 7.11.3. Festo Sales, Revenue, and Gross Margin
      4. 7.11.4. Festo Revenue and Growth Rate
      5. 7.11.5. Festo Market Share
      6. 7.11.6. Recent Initiatives, Funding/VC Activities, and Technological Innovations
    12. 7.12. Gardner Denver
      1. 7.12.1. Company Overview
      2. 7.12.2. Product/Service Portfolio
      3. 7.12.3. Gardner Denver Sales, Revenue, and Gross Margin
      4. 7.12.4. Gardner Denver Revenue and Growth Rate
      5. 7.12.5. Gardner Denver Market Share
      6. 7.12.6. Recent Initiatives, Funding/VC Activities, and Technological Innovations
    13. 7.13. Ham-Let Group
      1. 7.13.1. Company Overview
      2. 7.13.2. Product/Service Portfolio
      3. 7.13.3. Ham-Let Group Sales, Revenue, and Gross Margin
      4. 7.13.4. Ham-Let Group Revenue and Growth Rate
      5. 7.13.5. Ham-Let Group Market Share
      6. 7.13.6. Recent Initiatives, Funding/VC Activities, and Technological Innovations
    14. 7.14. Hitachi Koki
      1. 7.14.1. Company Overview
      2. 7.14.2. Product/Service Portfolio
      3. 7.14.3. Hitachi Koki Sales, Revenue, and Gross Margin
      4. 7.14.4. Hitachi Koki Revenue and Growth Rate
      5. 7.14.5. Hitachi Koki Market Share
      6. 7.14.6. Recent Initiatives, Funding/VC Activities, and Technological Innovations
    15. 7.15. Ingersoll Rand Inc.
      1. 7.15.1. Company Overview
      2. 7.15.2. Product/Service Portfolio
      3. 7.15.3. Ingersoll Rand Inc. Sales, Revenue, and Gross Margin
      4. 7.15.4. Ingersoll Rand Inc. Revenue and Growth Rate
      5. 7.15.5. Ingersoll Rand Inc. Market Share
      6. 7.15.6. Recent Initiatives, Funding/VC Activities, and Technological Innovations
    16. 7.16. Jiffy Air Tool
      1. 7.16.1. Company Overview
      2. 7.16.2. Product/Service Portfolio
      3. 7.16.3. Jiffy Air Tool Sales, Revenue, and Gross Margin
      4. 7.16.4. Jiffy Air Tool Revenue and Growth Rate
      5. 7.16.5. Jiffy Air Tool Market Share
      6. 7.16.6. Recent Initiatives, Funding/VC Activities, and Technological Innovations
    17. 7.17. Kramer Air Tools Inc.
      1. 7.17.1. Company Overview
      2. 7.17.2. Product/Service Portfolio
      3. 7.17.3. Kramer Air Tools Inc. Sales, Revenue, and Gross Margin
      4. 7.17.4. Kramer Air Tools Inc. Revenue and Growth Rate
      5. 7.17.5. Kramer Air Tools Inc. Market Share
      6. 7.17.6. Recent Initiatives, Funding/VC Activities, and Technological Innovations
    18. 7.18. Makita Corp.
      1. 7.18.1. Company Overview
      2. 7.18.2. Product/Service Portfolio
      3. 7.18.3. Makita Corp. Sales, Revenue, and Gross Margin
      4. 7.18.4. Makita Corp. Revenue and Growth Rate
      5. 7.18.5. Makita Corp. Market Share
      6. 7.18.6. Recent Initiatives, Funding/VC Activities, and Technological Innovations
    19. 7.19. Mann+Hummel
      1. 7.19.1. Company Overview
      2. 7.19.2. Product/Service Portfolio
      3. 7.19.3. Mann+Hummel Sales, Revenue, and Gross Margin
      4. 7.19.4. Mann+Hummel Revenue and Growth Rate
      5. 7.19.5. Mann+Hummel Market Share
      6. 7.19.6. Recent Initiatives, Funding/VC Activities, and Technological Innovations
    20. 7.20. Mesto
      1. 7.20.1. Company Overview
      2. 7.20.2. Product/Service Portfolio
      3. 7.20.3. Mesto Sales, Revenue, and Gross Margin
      4. 7.20.4. Mesto Revenue and Growth Rate
      5. 7.20.5. Mesto Market Share
      6. 7.20.6. Recent Initiatives, Funding/VC Activities, and Technological Innovations
    21. 7.21. Metrolog
      1. 7.21.1. Company Overview
      2. 7.21.2. Product/Service Portfolio
      3. 7.21.3. Metrolog Sales, Revenue, and Gross Margin
      4. 7.21.4. Metrolog Revenue and Growth Rate
      5. 7.21.5. Metrolog Market Share
      6. 7.21.6. Recent Initiatives, Funding/VC Activities, and Technological Innovations
    22. 7.22. Mitsubishi Heavy Industries Ltd.
      1. 7.22.1. Company Overview
      2. 7.22.2. Product/Service Portfolio
      3. 7.22.3. Mitsubishi Heavy Industries Ltd. Sales, Revenue, and Gross Margin
      4. 7.22.4. Mitsubishi Heavy Industries Ltd. Revenue and Growth Rate
      5. 7.22.5. Mitsubishi Heavy Industries Ltd. Market Share
      6. 7.22.6. Recent Initiatives, Funding/VC Activities, and Technological Innovations
    23. 7.23. Ningbo Smart Pneumatic Co. Ltd
      1. 7.23.1. Company Overview
      2. 7.23.2. Product/Service Portfolio
      3. 7.23.3. Ningbo Smart Pneumatic Co. Ltd Sales, Revenue, and Gross Margin
      4. 7.23.4. Ningbo Smart Pneumatic Co. Ltd Revenue and Growth Rate
      5. 7.23.5. Ningbo Smart Pneumatic Co. Ltd Market Share
      6. 7.23.6. Recent Initiatives, Funding/VC Activities, and Technological Innovations
    24. 7.24. P&F Industries
      1. 7.24.1. Company Overview
      2. 7.24.2. Product/Service Portfolio
      3. 7.24.3. P&F Industries Sales, Revenue, and Gross Margin
      4. 7.24.4. P&F Industries Revenue and Growth Rate
      5. 7.24.5. P&F Industries Market Share
      6. 7.24.6. Recent Initiatives, Funding/VC Activities, and Technological Innovations
    25. 7.25. Parker Hannifin
      1. 7.25.1. Company Overview
      2. 7.25.2. Product/Service Portfolio
      3. 7.25.3. Parker Hannifin Sales, Revenue, and Gross Margin
      4. 7.25.4. Parker Hannifin Revenue and Growth Rate
      5. 7.25.5. Parker Hannifin Market Share
      6. 7.25.6. Recent Initiatives, Funding/VC Activities, and Technological Innovations
    26. 7.26. Pneumatic Products
      1. 7.26.1. Company Overview
      2. 7.26.2. Product/Service Portfolio
      3. 7.26.3. Pneumatic Products Sales, Revenue, and Gross Margin
      4. 7.26.4. Pneumatic Products Revenue and Growth Rate
      5. 7.26.5. Pneumatic Products Market Share
      6. 7.26.6. Recent Initiatives, Funding/VC Activities, and Technological Innovations
    27. 7.27. Rotex Automation Limited
      1. 7.27.1. Company Overview
      2. 7.27.2. Product/Service Portfolio
      3. 7.27.3. Rotex Automation Limited Sales, Revenue, and Gross Margin
      4. 7.27.4. Rotex Automation Limited Revenue and Growth Rate
      5. 7.27.5. Rotex Automation Limited Market Share
      6. 7.27.6. Recent Initiatives, Funding/VC Activities, and Technological Innovations
    28. 7.28. Rotork
      1. 7.28.1. Company Overview
      2. 7.28.2. Product/Service Portfolio
      3. 7.28.3. Rotork Sales, Revenue, and Gross Margin
      4. 7.28.4. Rotork Revenue and Growth Rate
      5. 7.28.5. Rotork Market Share
      6. 7.28.6. Recent Initiatives, Funding/VC Activities, and Technological Innovations
    29. 7.29. SMC Corp. of America
      1. 7.29.1. Company Overview
      2. 7.29.2. Product/Service Portfolio
      3. 7.29.3. SMC Corp. of America Sales, Revenue, and Gross Margin
      4. 7.29.4. SMC Corp. of America Revenue and Growth Rate
      5. 7.29.5. SMC Corp. of America Market Share
      6. 7.29.6. Recent Initiatives, Funding/VC Activities, and Technological Innovations
    30. 7.30. Solution Control and Engineering Co
      1. 7.30.1. Company Overview
      2. 7.30.2. Product/Service Portfolio
      3. 7.30.3. Solution Control and Engineering Co Sales, Revenue, and Gross Margin
      4. 7.30.4. Solution Control and Engineering Co Revenue and Growth Rate
      5. 7.30.5. Solution Control and Engineering Co Market Share
      6. 7.30.6. Recent Initiatives, Funding/VC Activities, and Technological Innovations
    31. 7.31. Stanley Black & Decker Inc.
      1. 7.31.1. Company Overview
      2. 7.31.2. Product/Service Portfolio
      3. 7.31.3. Stanley Black & Decker Inc. Sales, Revenue, and Gross Margin
      4. 7.31.4. Stanley Black & Decker Inc. Revenue and Growth Rate
      5. 7.31.5. Stanley Black & Decker Inc. Market Share
      6. 7.31.6. Recent Initiatives, Funding/VC Activities, and Technological Innovations
    32. 7.32. The Smart Actuator Company
      1. 7.32.1. Company Overview
      2. 7.32.2. Product/Service Portfolio
      3. 7.32.3. The Smart Actuator Company Sales, Revenue, and Gross Margin
      4. 7.32.4. The Smart Actuator Company Revenue and Growth Rate
      5. 7.32.5. The Smart Actuator Company Market Share
      6. 7.32.6. Recent Initiatives, Funding/VC Activities, and Technological Innovations
    33. 7.33. Thomson Industries
      1. 7.33.1. Company Overview
      2. 7.33.2. Product/Service Portfolio
      3. 7.33.3. Thomson Industries Sales, Revenue, and Gross Margin
      4. 7.33.4. Thomson Industries Revenue and Growth Rate
      5. 7.33.5. Thomson Industries Market Share
      6. 7.33.6. Recent Initiatives, Funding/VC Activities, and Technological Innovations
    34. 7.34. VAC-U-MAX
      1. 7.34.1. Company Overview
      2. 7.34.2. Product/Service Portfolio
      3. 7.34.3. VAC-U-MAX Sales, Revenue, and Gross Margin
      4. 7.34.4. VAC-U-MAX Revenue and Growth Rate
      5. 7.34.5. VAC-U-MAX Market Share
      6. 7.34.6. Recent Initiatives, Funding/VC Activities, and Technological Innovations
  8. Chapter 8 Smart Pneumatics — Industry Analysis
    1. 8.1. Introduction and Taxonomy
    2. 8.2. Smart Pneumatics Market – Key Trends
      1. 8.2.1. Market Drivers
      2. 8.2.2. Market Restraints
      3. 8.2.3. Market Opportunities
    3. 8.3. Value Chain Analysis
    4. 8.4. Key Mandates and Regulations
    5. 8.5. Technology Roadmap and Timeline
    6. 8.6. Smart Pneumatics Market – Attractiveness Analysis
      1. 8.6.1. By Component
      2. 8.6.2. By Type
      3. 8.6.3. By End-Use Industry
      4. 8.6.4. By Region
  9. Chapter 9 Industrial Chain, Sourcing Strategy, and Downstream Buyers
    1. 9.1. Smart Pneumatics Industrial Chain Analysis
    2. 9.2. Downstream Buyers
    3. 9.3. Distributors/Traders List
  10. Chapter 10 Marketing Strategy Analysis
    1. 10.1. Marketing Channel
    2. 10.2. Direct Marketing
    3. 10.3. Indirect Marketing
    4. 10.4. Marketing Channel Development Trends
    5. 10.5. Economic/Political Environmental Change
  11. Chapter 11 Report Conclusion & Key Insights
    1. 11.1. Key Insights from Primary Interviews & Surveys Respondents
    2. 11.2. Key Takeaways from Analysts, Consultants, and Industry Leaders
  12. Chapter 12 Research Approach & Methodology
    1. 12.1. Report Description
    2. 12.2. Research Scope
    3. 12.3. Research Methodology
      1. 12.3.1. Secondary Research
      2. 12.3.2. Primary Research
      3. 12.3.3. Statistical Models
        1. 12.3.3.1. Company Share Analysis Model
        2. 12.3.3.2. Revenue Based Modeling
      4. 12.3.4. Research Limitations

      List of Figures

      Fig.1	Product Picture of Smart Pneumatics
      Fig.2	Global Smart Pneumatics Market, 2016 – 2026 (USD Million)
      Fig.3	Global Smart Pneumatics Market Absolute Revenue Opportunity, 2016 – 2026 (USD Million)
      Fig.4	Global Smart Pneumatics Market Incremental Revenue Opportunity, 2020 – 2026 (USD Million)
      Fig.5	Global Smart Pneumatics Market Share, by Component, 2020 & 2026 (USD Million)
      Fig.6	Global Hardware Smart Pneumatics Market, 2016 – 2026 (USD Million)
      Fig.7	Global Software and Services Smart Pneumatics Market, 2016 – 2026 (USD Million)
      Fig.8	Global Smart Pneumatics Market Share, by Type, 2020 & 2026 (USD Million)
      Fig.9	Global Smart Pneumatic Valves Smart Pneumatics Market, 2016 – 2026 (USD Million)
      Fig.10	Global Smart Pneumatic Actuators Smart Pneumatics Market, 2016 – 2026 (USD Million)
      Fig.11	Global Smart Pneumatic Modules Smart Pneumatics Market, 2016 – 2026 (USD Million)
      Fig.12	Global Smart Pneumatics Market Share, by End-Use Industry, 2020 & 2026 (USD Million)
      Fig.13	Global Oil & Gas Smart Pneumatics Market, 2016 – 2026 (USD Million)
      Fig.14	Global Energy & Power Smart Pneumatics Market, 2016 – 2026 (USD Million)
      Fig.15	Global Water & Wastewater Smart Pneumatics Market, 2016 – 2026 (USD Million)
      Fig.16	Global Automotive Smart Pneumatics Market, 2016 – 2026 (USD Million)
      Fig.17	Global Semiconductor Smart Pneumatics Market, 2016 – 2026 (USD Million)
      Fig.18	Global Food & Beverage Smart Pneumatics Market, 2016 – 2026 (USD Million)
      Fig.19	Global Others (Pharmaceuticals, Chemicals, and Metal & Mining) Smart Pneumatics Market, 2016 – 2026 (USD Million)
      Fig.20	Global Smart Pneumatics Market Share, by Region, 2020 & 2026 (USD Million)
      Fig.21	North America Smart Pneumatics Market, 2016 – 2026 (USD Million)
      Fig.22	U.S. Smart Pneumatics Market, 2016 – 2026 (USD Million)
      Fig.23	Canada Smart Pneumatics Market, 2016 – 2026 (USD Million)
      Fig.24	Europe Smart Pneumatics Market, 2016 – 2026 (USD Million)
      Fig.25	Germany Smart Pneumatics Market, 2016 – 2026 (USD Million)
      Fig.26	France Smart Pneumatics Market, 2016 – 2026 (USD Million)
      Fig.27	U.K. Smart Pneumatics Market, 2016 – 2026 (USD Million)
      Fig.28	Italy Smart Pneumatics Market, 2016 – 2026 (USD Million)
      Fig.29	Spain Smart Pneumatics Market, 2016 – 2026 (USD Million)
      Fig.30	Rest of Europe Smart Pneumatics Market, 2016 – 2026 (USD Million)
      Fig.31	Asia Pacific Smart Pneumatics Market, 2016 – 2026 (USD Million)
      Fig.32	China Smart Pneumatics Market, 2016 – 2026 (USD Million)
      Fig.33	Japan Smart Pneumatics Market, 2016 – 2026 (USD Million)
      Fig.34	India Smart Pneumatics Market, 2016 – 2026 (USD Million)
      Fig.35	South  Korea Smart Pneumatics Market, 2016 – 2026 (USD Million)
      Fig.36	South-East Asia Smart Pneumatics Market, 2016 – 2026 (USD Million)
      Fig.37	Rest of Asia Pacific Smart Pneumatics Market, 2016 – 2026 (USD Million)
      Fig.38	Latin America Smart Pneumatics Market, 2016 – 2026 (USD Million)
      Fig.39	Brazil Smart Pneumatics Market, 2016 – 2026 (USD Million)
      Fig.40	Mexico Smart Pneumatics Market, 2016 – 2026 (USD Million)
      Fig.41	Rest of Latin America Smart Pneumatics Market, 2016 – 2026 (USD Million)
      Fig.42	The Middle-East and Africa Smart Pneumatics Market, 2016 – 2026 (USD Million)
      Fig.43	GCC Countries Smart Pneumatics Market, 2016 – 2026 (USD Million)
      Fig.44	South Africa Smart Pneumatics Market, 2016 – 2026 (USD Million)
      Fig.45	Rest of Middle-East Africa Smart Pneumatics Market, 2016 – 2026 (USD Million)
      Fig.46	Competitor Market Share – Revenue
      Fig.47	Advanced Pneumatics Revenue and Growth Rate
      Fig.48	Advanced Pneumatics Market Share
      Fig.49	Aventics GmbH Revenue and Growth Rate
      Fig.50	Aventics GmbH Market Share
      Fig.51	Basso Industry Corp. Revenue and Growth Rate
      Fig.52	Basso Industry Corp. Market Share
      Fig.53	Bimba Manufcatruing Revenue and Growth Rate
      Fig.54	Bimba Manufcatruing Market Share
      Fig.55	Bosch Rexroth Revenue and Growth Rate
      Fig.56	Bosch Rexroth Market Share
      Fig.57	Chicago Pneumatic Revenue and Growth Rate
      Fig.58	Chicago Pneumatic Market Share
      Fig.59	Cypress EnviroSystems Corp Revenue and Growth Rate
      Fig.60	Cypress EnviroSystems Corp Market Share
      Fig.61	Delton Pneumatics Revenue and Growth Rate
      Fig.62	Delton Pneumatics Market Share
      Fig.63	Eaton Corp. Revenue and Growth Rate
      Fig.64	Eaton Corp. Market Share
      Fig.65	Emerson Electric Revenue and Growth Rate
      Fig.66	Emerson Electric Market Share
      Fig.67	Festo Revenue and Growth Rate
      Fig.68	Festo Market Share
      Fig.69	Gardner Denver Revenue and Growth Rate
      Fig.70	Gardner Denver Market Share
      Fig.71	Ham-Let Group Revenue and Growth Rate
      Fig.72	Ham-Let Group Market Share
      Fig.73	Hitachi Koki Revenue and Growth Rate
      Fig.74	Hitachi Koki Market Share
      Fig.75	Ingersoll Rand Inc. Revenue and Growth Rate
      Fig.76	Ingersoll Rand Inc. Market Share
      Fig.77	Jiffy Air Tool Revenue and Growth Rate
      Fig.78	Jiffy Air Tool Market Share
      Fig.79	Kramer Air Tools Inc. Revenue and Growth Rate
      Fig.80	Kramer Air Tools Inc. Market Share
      Fig.81	Makita Corp. Revenue and Growth Rate
      Fig.82	Makita Corp. Market Share
      Fig.83	Mann+Hummel Revenue and Growth Rate
      Fig.84	Mann+Hummel Market Share
      Fig.85	Mesto Revenue and Growth Rate
      Fig.86	Mesto Market Share
      Fig.87	Metrolog Revenue and Growth Rate
      Fig.88	Metrolog Market Share
      Fig.89	Mitsubishi Heavy Industries Ltd. Revenue and Growth Rate
      Fig.90	Mitsubishi Heavy Industries Ltd. Market Share
      Fig.91	Ningbo Smart Pneumatic Co. Ltd Revenue and Growth Rate
      Fig.92	Ningbo Smart Pneumatic Co. Ltd Market Share
      Fig.93	P&F Industries Revenue and Growth Rate
      Fig.94	P&F Industries Market Share
      Fig.95	Parker Hannifin Revenue and Growth Rate
      Fig.96	Parker Hannifin Market Share
      Fig.97	Pneumatic Products Revenue and Growth Rate
      Fig.98	Pneumatic Products Market Share
      Fig.99	Rotex Automation Limited Revenue and Growth Rate
      Fig.100	Rotex Automation Limited Market Share
      Fig.101	Rotork Revenue and Growth Rate
      Fig.102	Rotork Market Share
      Fig.103	SMC Corp. of America Revenue and Growth Rate
      Fig.104	SMC Corp. of America Market Share
      Fig.105	Solution Control and Engineering Co Revenue and Growth Rate
      Fig.106	Solution Control and Engineering Co Market Share
      Fig.107	Stanley Black & Decker Inc. Revenue and Growth Rate
      Fig.108	Stanley Black & Decker Inc. Market Share
      Fig.109	The Smart Actuator Company Revenue and Growth Rate
      Fig.110	The Smart Actuator Company Market Share
      Fig.111	Thomson Industries Revenue and Growth Rate
      Fig.112	Thomson Industries Market Share
      Fig.113	VAC-U-MAX Revenue and Growth Rate
      Fig.114	VAC-U-MAX Market Share
      Fig.115	Market Dynamics
      Fig.116	Global Smart Pneumatics – Value Chain Analysis
      Fig.117	Key Mandates and Regulations
      Fig.118	Technology Roadmap and Timeline
      Fig.119	Market Attractiveness Analysis – By Component
      Fig.120	Market Attractiveness Analysis – By Type
      Fig.121	Market Attractiveness Analysis – By End-Use Industry
      Fig.122	Market Attractiveness Analysis – By Region
      Fig.123	Smart Pneumatics Industrial Chain Analysis
      Fig.124	Market Channels
      Fig.125	Marketing Channel Development Trend
      Fig.126	Growth in World Gross Product, 2008-2018
      

      List of Tables

      Table 1	Global Smart Pneumatics Market, 2020 & 2026 (USD Million)
      Table 2	Global Smart Pneumatics Market, by Component, 2016 – 2026 (USD Million)
      Table 3	Global Smart Pneumatics Market, by Type, 2016 – 2026 (USD Million)
      Table 4	Global Smart Pneumatics Market, by End-Use Industry, 2016 – 2026 (USD Million)
      Table 5	Global Smart Pneumatics Market, by Region, 2016 – 2026 (USD Million)
      Table 6	North America Smart Pneumatics Market, by Country, 2016 – 2026 (USD Million)
      Table 7	North America Smart Pneumatics Market, by Component, 2016 – 2026 (USD Million)
      Table 8	North America Smart Pneumatics Market, by Type, 2016 – 2026 (USD Million)
      Table 9	North America Smart Pneumatics Market, by End-Use Industry, 2016 – 2026 (USD Million)
      Table 10 Europe Smart Pneumatics Market, by Country, 2016 – 2026 (USD Million)
      Table 11 Europe Smart Pneumatics Market, by Component, 2016 – 2026 (USD Million)
      Table 12 Europe Smart Pneumatics Market, by Type, 2016 – 2026 (USD Million)
      Table 13 Europe Smart Pneumatics Market, by End-Use Industry, 2016 – 2026 (USD Million)
      Table 14 Asia Pacific Smart Pneumatics Market, by Country, 2016 – 2026 (USD Million)
      Table 15 Asia Pacific Smart Pneumatics Market, by Component, 2016 – 2026 (USD Million)
      Table 16 Asia Pacific Smart Pneumatics Market, by Type, 2016 – 2026 (USD Million)
      Table 17 Asia Pacific Smart Pneumatics Market, by End-Use Industry, 2016 – 2026 (USD Million)
      Table 18 Latin America Smart Pneumatics Market, by Country, 2016 – 2026 (USD Million)
      Table 19 Latin America Smart Pneumatics Market, by Component, 2016 – 2026 (USD Million)
      Table 20 Latin America Smart Pneumatics Market, by Type, 2016 – 2026 (USD Million)
      Table 21 Latin America Smart Pneumatics Market, by End-Use Industry, 2016 – 2026 (USD Million)
      Table 22 The Middle-East and Africa Smart Pneumatics Market, by Country, 2016 – 2026 (USD Million)
      Table 23 The Middle-East and Africa Smart Pneumatics Market, by Component, 2016 – 2026 (USD Million)
      Table 24 The Middle-East and Africa Smart Pneumatics Market, by Type, 2016 – 2026 (USD Million)
      Table 25 The Middle-East and Africa Smart Pneumatics Market, by End-Use Industry, 2016 – 2026 (USD Million)
      Table 26 Global Smart Pneumatics Market - Company Revenue Analysis, 2016 – 2020 (USD Million)
      Table 27 Global Smart Pneumatics Market - Company Revenue Share Analysis, 2016 – 2020 (%)
      Table 28 Acquisitions and Mergers
      Table 29 Market Drivers – Impact Analysis
      Table 30 Market Restraints
      Table 31 Market Opportunities
      Table 32 Major Buyers of Smart Pneumatics
      Table 33 Distributors/Traders of Smart Pneumatics by Region
      

Industry Major Market Players

  • Advanced Pneumatics
  • Aventics GmbH
  • Basso Industry Corp.
  • Bimba Manufacturing
  • Bosch Rexroth
  • Chicago Pneumatic
  • Cypress EnviroSystems Corp
  • Delton Pneumatics
  • Eaton Corp.
  • Emerson Electric
  • Festo
  • Gardner Denver
  • Ham-Let Group
  • Hitachi Koki
  • Ingersoll Rand Inc.
  • Jiffy Air Tool
  • K ramer Air Tools Inc.
  • Makita Corp.
  • Mann+Hummel
  • Mesto
  • Metrolog
  • Mitsubishi Heavy Industries Ltd.
  • Ningbo Smart Pneumatic Co. Ltd.
  • P&F Industries
  • Parker Hannifin
  • Pneumatic Products
  • Rotex Automation Limited
  • Rotork
  • SMC Corp. of America
  • Solution Control and Engineering Co.
  • Stanley Black & Decker Inc.
  • The Smart Actuator Company
  • Thomson Industries
  • VAC-U-MAX