Search Market Research Report

Discover Our Latest Reports
Discover Our Featured Reports
Discover Top Selling Reports

Smart Healthcare Market Size, Share Global Analysis Report, 2021–2026

report img

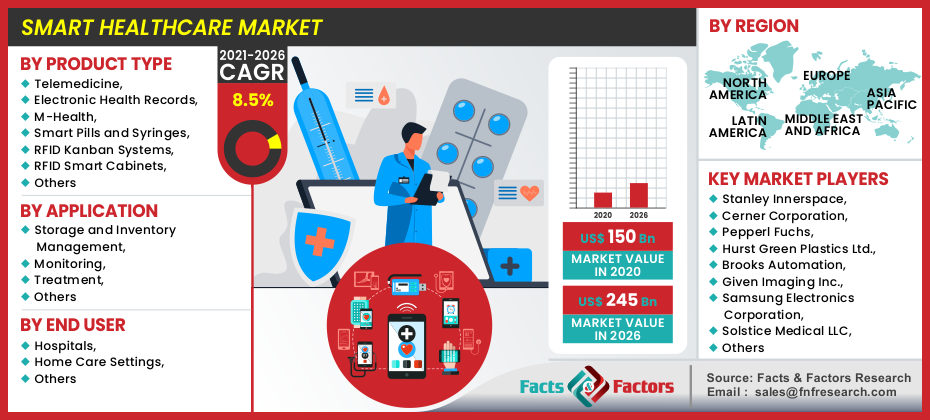
Smart Healthcare Market by Product Type (Telemedicine, Electronic Health Records, M-Health, Smart Pills and Syringes, RFID Kanban Systems, RFID Smart Cabinets, Others), by Application (Storage and Inventory Management, Monitoring, Treatment, Others), by End User (Hospitals, Home Care Settings, Others): Global & Regional Industry Outlook, Market Size, Business Intelligence, Consumer Preferences, Statistical Surveys, Comprehensive Analysis, Historical Developments, Current Trends, and Forecast 2021–2026

Industry Insights

[221+ Pages Report] According to a survey issued by Facts and Factors, the global smart healthcare market was estimated to be worth over USD 150 billion in 2020, and is predicted to be worth about USD 245 billion by the end of 2026, with a CAGR of roughly 8.5% between 2021 and 2026.

logoMarket Overview      

Smart healthcare goods are devices that use cutting-edge technology to provide patients with better care and a higher quality of life. They provide clinicians with precise patient data, allowing them to better treat their patients.

The use of mobile health, the prevalence of chronic diseases, and government initiatives to digitize healthcare are all projected to drive up demand for smart healthcare systems. Digitalization has altered the healthcare industry. The popularity of mHealth has skyrocketed in recent years, owing to the widespread use of smartphones and digitization.

logoIndustry Growth Factors

One of the major factors projected to drive the growth and demand of the smart healthcare market is the increasing prevalence of the Internet of Things.

The rapid growth of the senior population, quick changes in lifestyle, and increased government measures to digitize healthcare infrastructure are all expected to boost market growth. Furthermore, the increased demand for small electronic devices to get real-time information is likely to be a significant element in the smart healthcare market's growth.

Market growth is projected to be aided by increased engagement from industry players along with that market growth is expected to be aided by government initiatives. Phillips, for example, launched a new application for the eCareManager acuity-based scoring tools in April 2020 to analyze patient conditions for deterioration or any undesirable patterns associated with COVID-19 in April 2020. Teladoc Health, meanwhile, debuts Teladoc medical experts in October 2019 for patients with complex mental and physical health concerns. This is designed to seamlessly connect expert medical services and clinicians with their patients. During the projected period, such advances are projected to drive the market.

Smart Healthcare Market

To know more about this report | Request Free Sample Copy

logoSegmentation Analysis

Based on the products segment in the smart healthcare market, the segments are telemedicine, electronic health records, m-health, smart pills and syringes, RFID Kanban systems, RFID smart cabinets, and others. In 2020, mHealth led the smart healthcare business. The dominance is aided by high internet usage, cellphones, and the adoption of mHealth apps. In addition, the introduction of wearable devices by Apple, Fitbit, and MI have a positive impact on the market. In April 2020, Proxxi, a Canadian startup, presented Halo, a wearable device. This device is meant to ensure workplace compliance with social distance during the ongoing global COVID-19 pandemic. This device would constantly inform of separation to achieve sufficient social distancing. The RFID Kanban System is predicted to be the smart healthcare market's fastest-growing category, with excellent growth rates. RFID adoption is influenced by supply chain management, automation, real-time intelligence, and asset tracking, among other factors. RFID technology helps spot difficulties in hospital operations, especially when it comes to transporting patients in and out more quickly and efficiently. The smart healthcare market is divided into four categories based on application: storage and inventory management, monitoring, treatment, and others. The smart healthcare market is divided into three categories based on the end user: hospitals, home care settings, and others.

logo Regional Analysis

North America dominated the smart healthcare market. This is due to government initiatives that encourage the deployment of digital health and infrastructure that is accessible to people who have a high level of digital literacy. Furthermore, the existence of significant market participants, increased awareness about linked healthcare, high internet, and smartphone penetration, as well as the use of health-related apps, are all contributing to the market's growth.

Over the forecast period, Asia Pacific is predicted to grow at a healthy rate. Because of their mature healthcare IT infrastructure and expanding investments in smart healthcare, countries like Japan, Australia, and India have a lot of potential. The adoption of digital healthcare solutions such as health services is predicted to increase as the number of government digitization programs in emerging nations such as China and India increases.

logoReport Scope

Report Attribute

Details

Market Size in 2020

USD 150 Billion

Projected Market Size in 2026

USD 245 Billion

CAGR Growth Rate

8.5%

Base Year

2020

Forecast Years

2021-2026

Key Market Players

Stanley Innerspace, Cerner Corporation, Pepperl Fuchs, Hurst Green Plastics Ltd., Brooks Automation, Given Imaging Inc., Samsung Electronics Corporation, Solstice Medical LLC, Siemens Medical Solutions, Allscripts Healthcare Solutions, Bollhoff Group, Wurth Group, IBM, Cisco, GE Healthcare, Olympus Corporation, Philips, AirStrip Technologies Inc., Apple Inc., AT&T Inc., Logi-Tag, McKesson Corporation, Brooks Automation, and LogTag among others.

Key Segment

by Product Type, By Application, By End User, and By Region

Major Regions Covered

North America, Europe, Asia Pacific, Latin America, and the Middle East & Africa

Purchase Options

Request customized purchase options to meet your research needs. Explore purchase options

logo Competitive Players

Major players in the smart healthcare market are

  • Stanley Innerspace
  • Cerner Corporation
  • Pepperl Fuchs
  • Hurst Green Plastics Ltd.
  • Brooks Automation
  • Given Imaging Inc.
  • Samsung Electronics Corporation
  • Solstice Medical LLC
  • Siemens Medical Solutions
  • Allscripts Healthcare Solutions
  • Bollhoff Group
  • Wurth Group
  • IBM
  • Cisco
  • GE Healthcare
  • Olympus Corporation
  • Philips
  • AirStrip Technologies Inc.
  • Apple Inc.
  • AT&T Inc.
  • Logi-Tag
  • McKesson Corporation
  • Brooks Automation
  • LogTag

logoSmart Healthcare Market: Regional Segment Analysis

  • North America
    • U.S.
    • Canada
  • Europe
    • UK
    • France
    • Germany
    • Italy
    • Spain
    • Rest of Europe
  • Asia Pacific
    • China
    • Japan
    • India
    • South Korea
    • Southeast Asia
    • Rest of Asia Pacific
  • Latin America
    • Brazil
    • Mexico
    • Rest of Latin America
  • Middle East and Africa
    • GCC Countries
    • South Africa
    • Rest of MEA

Table of Content

  1. Chapter 1 Executive Summary
    1. 1.1. Introduction of Smart Healthcare
    2. 1.2. Global Smart Healthcare Market, 2020 & 2026 (USD Billion)
    3. 1.3. Global Smart Healthcare Market, 2016 – 2026 (USD Billion)
    4. 1.4. Global Smart Healthcare Market Absolute Revenue Opportunity, 2016 – 2026 (USD Billion)
    5. 1.5. Global Smart Healthcare Market Incremental Revenue Opportunity, 2020 – 2026 (USD Billion)
  2. Chapter 2 Smart Healthcare Market – Product Type Analysis
    1. 2.1. Global Smart Healthcare Market – Product Type Overview
    2. 2.2. Global Smart Healthcare Market Share, by Product Type, 2020 & 2026 (USD Billion)
    3. 2.3. Telemedicine
      1. 2.3.1. Global Telemedicine Smart Healthcare Market, 2016 – 2026 (USD Billion)
    4. 2.4. Electronic Health Records
      1. 2.4.1. Global Electronic Health Records Smart Healthcare Market, 2016 – 2026 (USD Billion)
    5. 2.5. M-Health
      1. 2.5.1. Global M-Health Smart Healthcare Market, 2016 – 2026 (USD Billion)
    6. 2.6. Smart Pills and Syringes
      1. 2.6.1. Global Smart Pills and Syringes Smart Healthcare Market, 2016 – 2026 (USD Billion)
    7. 2.7. RFID Kanban Systems
      1. 2.7.1. Global RFID Kanban Systems Smart Healthcare Market, 2016 – 2026 (USD Billion)
    8. 2.8. RFID Smart Cabinets
      1. 2.8.1. Global RFID Smart Cabinets Smart Healthcare Market, 2016 – 2026 (USD Billion)
    9. 2.9. Others
      1. 2.9.1. Global Others Smart Healthcare Market, 2016 – 2026 (USD Billion)
  3. Chapter 3 Smart Healthcare Market – Application Analysis
    1. 3.1. Global Smart Healthcare Market – Application Overview
    2. 3.2. Global Smart Healthcare Market Share, by Application, 2020 & 2026 (USD Billion)
    3. 3.3. Storage and Inventory Management
      1. 3.3.1. Global Storage and Inventory Management Smart Healthcare Market, 2016 – 2026 (USD Billion)
    4. 3.4. Monitoring
      1. 3.4.1. Global Monitoring Smart Healthcare Market, 2016 – 2026 (USD Billion)
    5. 3.5. Treatment
      1. 3.5.1. Global Treatment Smart Healthcare Market, 2016 – 2026 (USD Billion)
    6. 3.6. Others
      1. 3.6.1. Global Others Smart Healthcare Market, 2016 – 2026 (USD Billion)
  4. Chapter 4 Smart Healthcare Market – End User Analysis
    1. 4.1. Global Smart Healthcare Market – End User Overview
    2. 4.2. Global Smart Healthcare Market Share, by End User, 2020 & 2026 (USD Billion)
    3. 4.3. Hospitals
      1. 4.3.1. Global Hospitals Smart Healthcare Market, 2016 – 2026 (USD Billion)
    4. 4.4. Home Care Settings
      1. 4.4.1. Global Home Care Settings Smart Healthcare Market, 2016 – 2026 (USD Billion)
  5. Chapter 5 Smart Healthcare Market – Regional Analysis
    1. 5.1. Global Smart Healthcare Market Regional Overview
    2. 5.2. Global Smart Healthcare Market Share, by Region, 2020 & 2026 (USD Billion)
    3. 5.3. North America
      1. 5.3.1. North America Smart Healthcare Market, 2016 – 2026 (USD Billion)
        1. 5.3.1.1. North America Smart Healthcare Market, by Country, 2016 - 2026 (USD Billion)
      2. 5.3.2. North America Smart Healthcare Market, by Product Type, 2016 – 2026
        1. 5.3.2.1. North America Smart Healthcare Market, by Product Type, 2016 – 2026 (USD Billion)
      3. 5.3.3. North America Smart Healthcare Market, by Application, 2016 – 2026
        1. 5.3.3.1. North America Smart Healthcare Market, by Application, 2016 – 2026 (USD Billion)
      4. 5.3.4. North America Smart Healthcare Market, by End User, 2016 – 2026
        1. 5.3.4.1. North America Smart Healthcare Market, by End User, 2016 – 2026 (USD Billion)
      5. 5.3.5. U.S.
        1. 5.3.5.1. U.S. Smart Healthcare Market, 2016 – 2026 (USD Billion)
      6. 5.3.6. Canada
        1. 5.3.6.1. Canada Smart Healthcare Market, 2016 – 2026 (USD Billion)
    4. 5.4. Europe
      1. 5.4.1. Europe Smart Healthcare Market, 2016 – 2026 (USD Billion)
        1. 5.4.1.1. Europe Smart Healthcare Market, by Country, 2016 - 2026 (USD Billion)
      2. 5.4.2. Europe Smart Healthcare Market, by Product Type, 2016 – 2026
        1. 5.4.2.1. Europe Smart Healthcare Market, by Product Type, 2016 – 2026 (USD Billion)
      3. 5.4.3. Europe Smart Healthcare Market, by Application, 2016 – 2026
        1. 5.4.3.1. Europe Smart Healthcare Market, by Application, 2016 – 2026 (USD Billion)
      4. 5.4.4. Europe Smart Healthcare Market, by End User, 2016 – 2026
        1. 5.4.4.1. Europe Smart Healthcare Market, by End User, 2016 – 2026 (USD Billion)
      5. 5.4.5. Germany
        1. 5.4.5.1. Germany Smart Healthcare Market, 2016 – 2026 (USD Billion)
      6. 5.4.6. France
        1. 5.4.6.1. France Smart Healthcare Market, 2016 – 2026 (USD Billion)
      7. 5.4.7. U.K.
        1. 5.4.7.1. U.K. Smart Healthcare Market, 2016 – 2026 (USD Billion)
      8. 5.4.8. Italy
        1. 5.4.8.1. Italy Smart Healthcare Market, 2016 – 2026 (USD Billion)
      9. 5.4.9. Spain
        1. 5.4.9.1. Spain Smart Healthcare Market, 2016 – 2026 (USD Billion)
      10. 5.4.10. Rest of Europe
        1. 5.4.10.1. Rest of Europe Smart Healthcare Market, 2016 – 2026 (USD Billion)
    5. 5.5. Asia Pacific
      1. 5.5.1. Asia Pacific Smart Healthcare Market, 2016 – 2026 (USD Billion)
        1. 5.5.1.1. Asia Pacific Smart Healthcare Market, by Country, 2016 - 2026 (USD Billion)
      2. 5.5.2. Asia Pacific Smart Healthcare Market, by Product Type, 2016 – 2026
        1. 5.5.2.1. Asia Pacific Smart Healthcare Market, by Product Type, 2016 – 2026 (USD Billion)
      3. 5.5.3. Asia Pacific Smart Healthcare Market, by Application, 2016 – 2026
        1. 5.5.3.1. Asia Pacific Smart Healthcare Market, by Application, 2016 – 2026 (USD Billion)
      4. 5.5.4. Asia Pacific Smart Healthcare Market, by End User, 2016 – 2026
        1. 5.5.4.1. Asia Pacific Smart Healthcare Market, by End User, 2016 – 2026 (USD Billion)
      5. 5.5.5. China
        1. 5.5.5.1. China Smart Healthcare Market, 2016 – 2026 (USD Billion)
      6. 5.5.6. Japan
        1. 5.5.6.1. Japan Smart Healthcare Market, 2016 – 2026 (USD Billion)
      7. 5.5.7. India
        1. 5.5.7.1. India Smart Healthcare Market, 2016 – 2026 (USD Billion)
      8. 5.5.8. South Korea
        1. 5.5.8.1. South Korea Smart Healthcare Market, 2016 – 2026 (USD Billion)
      9. 5.5.9. South-East Asia
        1. 5.5.9.1. South-East Asia Smart Healthcare Market, 2016 – 2026 (USD Billion)
      10. 5.5.10. Rest of Asia Pacific
        1. 5.5.10.1. Rest of Asia Pacific Smart Healthcare Market, 2016 – 2026 (USD Billion)
    6. 5.6. Latin America
      1. 5.6.1. Latin America Smart Healthcare Market, 2016 – 2026 (USD Billion)
        1. 5.6.1.1. Latin America Smart Healthcare Market, by Country, 2016 - 2026 (USD Billion)
      2. 5.6.2. Latin America Smart Healthcare Market, by Product Type, 2016 – 2026
        1. 5.6.2.1. Latin America Smart Healthcare Market, by Product Type, 2016 – 2026 (USD Billion)
      3. 5.6.3. Latin America Smart Healthcare Market, by Application, 2016 – 2026
        1. 5.6.3.1. Latin America Smart Healthcare Market, by Application, 2016 – 2026 (USD Billion)
      4. 5.6.4. Latin America Smart Healthcare Market, by End User, 2016 – 2026
        1. 5.6.4.1. Latin America Smart Healthcare Market, by End User, 2016 – 2026 (USD Billion)
      5. 5.6.5. Brazil
        1. 5.6.5.1. Brazil Smart Healthcare Market, 2016 – 2026 (USD Billion)
      6. 5.6.6. Mexico
        1. 5.6.6.1. Mexico Smart Healthcare Market, 2016 – 2026 (USD Billion)
      7. 5.6.7. Rest of Latin America
        1. 5.6.7.1. Rest of Latin America Smart Healthcare Market, 2016 – 2026 (USD Billion)
    7. 5.7. The Middle-East and Africa
      1. 5.7.1. The Middle-East and Africa Smart Healthcare Market, 2016 – 2026 (USD Billion)
        1. 5.7.1.1. The Middle-East and Africa Smart Healthcare Market, by Country, 2016 - 2026 (USD Billion)
      2. 5.7.2. The Middle-East and Africa Smart Healthcare Market, by Product Type, 2016 – 2026
        1. 5.7.2.1. The Middle-East and Africa Smart Healthcare Market, by Product Type, 2016 – 2026 (USD Billion)
      3. 5.7.3. The Middle-East and Africa Smart Healthcare Market, by Application, 2016 – 2026
        1. 5.7.3.1. The Middle-East and Africa Smart Healthcare Market, by Application, 2016 – 2026 (USD Billion)
      4. 5.7.4. The Middle-East and Africa Smart Healthcare Market, by End User, 2016 – 2026
        1. 5.7.4.1. The Middle-East and Africa Smart Healthcare Market, by End User, 2016 – 2026 (USD Billion)
      5. 5.7.5. GCC Countries
        1. 5.7.5.1. GCC Countries Smart Healthcare Market, 2016 – 2026 (USD Billion)
      6. 5.7.6. South Africa
        1. 5.7.6.1. South Africa Smart Healthcare Market, 2016 – 2026 (USD Billion)
      7. 5.7.7. Rest of Middle-East Africa
        1. 5.7.7.1. Rest of Middle-East Africa Smart Healthcare Market, 2016 – 2026 (USD Billion)
  6. Chapter 6 Smart Healthcare Market – Competitive Landscape
    1. 6.1. Competitor Market Share – Revenue
    2. 6.2. Market Concentration Rate Analysis, Top 3 and Top 5 Players
    3. 6.3. Strategic Developments
      1. 6.3.1. Acquisitions and Mergers
      2. 6.3.2. New Products
      3. 6.3.3. Research & Development Activities
  7. Chapter 7 Company Profiles
    1. 7.1. Stanley Innerspace
      1. 7.1.1. Company Overview
      2. 7.1.2. Product/Service Portfolio
      3. 7.1.3. Stanley Innerspace Sales, Revenue, and Gross Margin
      4. 7.1.4. Stanley Innerspace Revenue and Growth Rate
      5. 7.1.5. Stanley Innerspace Market Share
      6. 7.1.6. Recent Initiatives, Funding/VC Activities, and Technological Innovations
    2. 7.2. Cerner Corporation
      1. 7.2.1. Company Overview
      2. 7.2.2. Product/Service Portfolio
      3. 7.2.3. Cerner Corporation Sales, Revenue, and Gross Margin
      4. 7.2.4. Cerner Corporation Revenue and Growth Rate
      5. 7.2.5. Cerner Corporation Market Share
      6. 7.2.6. Recent Initiatives, Funding/VC Activities, and Technological Innovations
    3. 7.3. Pepperl Fuchs
      1. 7.3.1. Company Overview
      2. 7.3.2. Product/Service Portfolio
      3. 7.3.3. Pepperl Fuchs Sales, Revenue, and Gross Margin
      4. 7.3.4. Pepperl Fuchs Revenue and Growth Rate
      5. 7.3.5. Pepperl Fuchs Market Share
      6. 7.3.6. Recent Initiatives, Funding/VC Activities, and Technological Innovations
    4. 7.4. Hurst Green Plastics Ltd.
      1. 7.4.1. Company Overview
      2. 7.4.2. Product/Service Portfolio
      3. 7.4.3. Hurst Green Plastics Ltd. Sales, Revenue, and Gross Margin
      4. 7.4.4. Hurst Green Plastics Ltd. Revenue and Growth Rate
      5. 7.4.5. Hurst Green Plastics Ltd. Market Share
      6. 7.4.6. Recent Initiatives, Funding/VC Activities, and Technological Innovations
    5. 7.5. Brooks Automation
      1. 7.5.1. Company Overview
      2. 7.5.2. Product/Service Portfolio
      3. 7.5.3. Brooks Automation Sales, Revenue, and Gross Margin
      4. 7.5.4. Brooks Automation Revenue and Growth Rate
      5. 7.5.5. Brooks Automation Market Share
      6. 7.5.6. Recent Initiatives, Funding/VC Activities, and Technological Innovations
    6. 7.6. Given Imaging Inc.
      1. 7.6.1. Company Overview
      2. 7.6.2. Product/Service Portfolio
      3. 7.6.3. Given Imaging Inc. Sales, Revenue, and Gross Margin
      4. 7.6.4. Given Imaging Inc. Revenue and Growth Rate
      5. 7.6.5. Given Imaging Inc. Market Share
      6. 7.6.6. Recent Initiatives, Funding/VC Activities, and Technological Innovations
    7. 7.7. Samsung Electronics Corporation
      1. 7.7.1. Company Overview
      2. 7.7.2. Product/Service Portfolio
      3. 7.7.3. Samsung Electronics Corporation Sales, Revenue, and Gross Margin
      4. 7.7.4. Samsung Electronics Corporation Revenue and Growth Rate
      5. 7.7.5. Samsung Electronics Corporation Market Share
      6. 7.7.6. Recent Initiatives, Funding/VC Activities, and Technological Innovations
    8. 7.8. Solstice Medical LLC
      1. 7.8.1. Company Overview
      2. 7.8.2. Product/Service Portfolio
      3. 7.8.3. Solstice Medical LLC Sales, Revenue, and Gross Margin
      4. 7.8.4. Solstice Medical LLC Revenue and Growth Rate
      5. 7.8.5. Solstice Medical LLC Market Share
      6. 7.8.6. Recent Initiatives, Funding/VC Activities, and Technological Innovations
    9. 7.9. Siemens Medical Solutions
      1. 7.9.1. Company Overview
      2. 7.9.2. Product/Service Portfolio
      3. 7.9.3. Siemens Medical Solutions Sales, Revenue, and Gross Margin
      4. 7.9.4. Siemens Medical Solutions Revenue and Growth Rate
      5. 7.9.5. Siemens Medical Solutions Market Share
      6. 7.9.6. Recent Initiatives, Funding/VC Activities, and Technological Innovations
    10. 7.10. Allscripts Healthcare Solutions
      1. 7.10.1. Company Overview
      2. 7.10.2. Product/Service Portfolio
      3. 7.10.3. Allscripts Healthcare Solutions Sales, Revenue, and Gross Margin
      4. 7.10.4. Allscripts Healthcare Solutions Revenue and Growth Rate
      5. 7.10.5. Allscripts Healthcare Solutions Market Share
      6. 7.10.6. Recent Initiatives, Funding/VC Activities, and Technological Innovations
    11. 7.11. Bollhoff Group
      1. 7.11.1. Company Overview
      2. 7.11.2. Product/Service Portfolio
      3. 7.11.3. Bollhoff Group Sales, Revenue, and Gross Margin
      4. 7.11.4. Bollhoff Group Revenue and Growth Rate
      5. 7.11.5. Bollhoff Group Market Share
      6. 7.11.6. Recent Initiatives, Funding/VC Activities, and Technological Innovations
    12. 7.12. Wurth Group
      1. 7.12.1. Company Overview
      2. 7.12.2. Product/Service Portfolio
      3. 7.12.3. Wurth Group Sales, Revenue, and Gross Margin
      4. 7.12.4. Wurth Group Revenue and Growth Rate
      5. 7.12.5. Wurth Group Market Share
      6. 7.12.6. Recent Initiatives, Funding/VC Activities, and Technological Innovations
    13. 7.13. IBM
      1. 7.13.1. Company Overview
      2. 7.13.2. Product/Service Portfolio
      3. 7.13.3. IBM Sales, Revenue, and Gross Margin
      4. 7.13.4. IBM Revenue and Growth Rate
      5. 7.13.5. IBM Market Share
      6. 7.13.6. Recent Initiatives, Funding/VC Activities, and Technological Innovations
    14. 7.14. Cisco
      1. 7.14.1. Company Overview
      2. 7.14.2. Product/Service Portfolio
      3. 7.14.3. Cisco Sales, Revenue, and Gross Margin
      4. 7.14.4. Cisco Revenue and Growth Rate
      5. 7.14.5. Cisco Market Share
      6. 7.14.6. Recent Initiatives, Funding/VC Activities, and Technological Innovations
    15. 7.15. GE Healthcare
      1. 7.15.1. Company Overview
      2. 7.15.2. Product/Service Portfolio
      3. 7.15.3. GE Healthcare Sales, Revenue, and Gross Margin
      4. 7.15.4. GE Healthcare Revenue and Growth Rate
      5. 7.15.5. GE Healthcare Market Share
      6. 7.15.6. Recent Initiatives, Funding/VC Activities, and Technological Innovations
    16. 7.16. Olympus Corporation
      1. 7.16.1. Company Overview
      2. 7.16.2. Product/Service Portfolio
      3. 7.16.3. Olympus Corporation Sales, Revenue, and Gross Margin
      4. 7.16.4. Olympus Corporation Revenue and Growth Rate
      5. 7.16.5. Olympus Corporation Market Share
      6. 7.16.6. Recent Initiatives, Funding/VC Activities, and Technological Innovations
    17. 7.17. Philips
      1. 7.17.1. Company Overview
      2. 7.17.2. Product/Service Portfolio
      3. 7.17.3. Philips Sales, Revenue, and Gross Margin
      4. 7.17.4. Philips Revenue and Growth Rate
      5. 7.17.5. Philips Market Share
      6. 7.17.6. Recent Initiatives, Funding/VC Activities, and Technological Innovations
    18. 7.18. AirStrip Technologies Inc.
      1. 7.18.1. Company Overview
      2. 7.18.2. Product/Service Portfolio
      3. 7.18.3. AirStrip Technologies Inc. Sales, Revenue, and Gross Margin
      4. 7.18.4. AirStrip Technologies Inc. Revenue and Growth Rate
      5. 7.18.5. AirStrip Technologies Inc. Market Share
      6. 7.18.6. Recent Initiatives, Funding/VC Activities, and Technological Innovations
    19. 7.19. Apple Inc.
      1. 7.19.1. Company Overview
      2. 7.19.2. Product/Service Portfolio
      3. 7.19.3. Apple Inc. Sales, Revenue, and Gross Margin
      4. 7.19.4. Apple Inc. Revenue and Growth Rate
      5. 7.19.5. Apple Inc. Market Share
      6. 7.19.6. Recent Initiatives, Funding/VC Activities, and Technological Innovations
    20. 7.20. AT&T Inc.
      1. 7.20.1. Company Overview
      2. 7.20.2. Product/Service Portfolio
      3. 7.20.3. AT&T Inc. Sales, Revenue, and Gross Margin
      4. 7.20.4. AT&T Inc. Revenue and Growth Rate
      5. 7.20.5. AT&T Inc. Market Share
      6. 7.20.6. Recent Initiatives, Funding/VC Activities, and Technological Innovations
    21. 7.21. Logi-Tag
      1. 7.21.1. Company Overview
      2. 7.21.2. Product/Service Portfolio
      3. 7.21.3. Logi-Tag Sales, Revenue, and Gross Margin
      4. 7.21.4. Logi-Tag Revenue and Growth Rate
      5. 7.21.5. Logi-Tag Market Share
      6. 7.21.6. Recent Initiatives, Funding/VC Activities, and Technological Innovations
    22. 7.22. McKesson Corporation
      1. 7.22.1. Company Overview
      2. 7.22.2. Product/Service Portfolio
      3. 7.22.3. McKesson Corporation Sales, Revenue, and Gross Margin
      4. 7.22.4. McKesson Corporation Revenue and Growth Rate
      5. 7.22.5. McKesson Corporation Market Share
      6. 7.22.6. Recent Initiatives, Funding/VC Activities, and Technological Innovations
    23. 7.23. Brooks Automation
      1. 7.23.1. Company Overview
      2. 7.23.2. Product/Service Portfolio
      3. 7.23.3. Brooks Automation Sales, Revenue, and Gross Margin
      4. 7.23.4. Brooks Automation Revenue and Growth Rate
      5. 7.23.5. Brooks Automation Market Share
      6. 7.23.6. Recent Initiatives, Funding/VC Activities, and Technological Innovations
    24. 7.24. LogTag
      1. 7.24.1. Company Overview
      2. 7.24.2. Product/Service Portfolio
      3. 7.24.3. LogTag Sales, Revenue, and Gross Margin
      4. 7.24.4. LogTag Revenue and Growth Rate
      5. 7.24.5. LogTag Market Share
      6. 7.24.6. Recent Initiatives, Funding/VC Activities, and Technological Innovations
  8. Chapter 8 Smart Healthcare — Industry Analysis
    1. 8.1. Introduction and Taxonomy
    2. 8.2. Smart Healthcare Market – Key Trends
      1. 8.2.1. Market Drivers
      2. 8.2.2. Market Restraints
      3. 8.2.3. Market Opportunities
    3. 8.3. Value Chain Analysis
    4. 8.4. Key Mandates and Regulations
    5. 8.5. Technology Roadmap and Timeline
    6. 8.6. Smart Healthcare Market – Attractiveness Analysis
      1. 8.6.1. By Product Type
      2. 8.6.2. By Application
      3. 8.6.3. By End User
      4. 8.6.4. By Region
  9. Chapter 9 Industrial Chain, Sourcing Strategy, and Downstream Buyers
    1. 9.1. Smart Healthcare Industrial Chain Analysis
    2. 9.2. Downstream Buyers
    3. 9.3. Distributors/Traders List
  10. Chapter 10 Marketing Strategy Analysis
    1. 10.1. Marketing Channel
    2. 10.2. Direct Marketing
    3. 10.3. Indirect Marketing
    4. 10.4. Marketing Channel Development Trends
    5. 10.5. Economic/Political Environmental Change
  11. Chapter 11 Report Conclusion & Key Insights
    1. 11.1. Key Insights from Primary Interviews & Surveys Respondents
    2. 11.2. Key Takeaways from Analysts, Consultants, and Industry Leaders
  12. Chapter 12 Research Approach & Methodology
    1. 12.1. Report Description
    2. 12.2. Research Scope
    3. 12.3. Research Methodology
      1. 12.3.1. Secondary Research
      2. 12.3.2. Primary Research
      3. 12.3.3. Statistical Models
        1. 12.3.3.1. Company Share Analysis Model
        2. 12.3.3.2. Revenue Based Modeling
      4. 12.3.4. Research Limitations

      List of Figures

      Fig.1	Product Picture of Smart Healthcare
      Fig.2	Global Smart Healthcare Market, 2016 – 2026 (USD Billion)
      Fig.3	Global Smart Healthcare Market Absolute Revenue Opportunity, 2016 – 2026 (USD Billion)
      Fig.4	Global Smart Healthcare Market Incremental Revenue Opportunity, 2020 – 2026 (USD Billion)
      Fig.5	Global Smart Healthcare Market Share, by Product Type, 2020 & 2026 (USD Billion)
      Fig.6	Global Telemedicine Smart Healthcare Market, 2016 – 2026 (USD Billion)
      Fig.7	Global Electronic Health Records Smart Healthcare Market, 2016 – 2026 (USD Billion)
      Fig.8	Global M-Health Smart Healthcare Market, 2016 – 2026 (USD Billion)
      Fig.9	Global Smart Pills and Syringes Smart Healthcare Market, 2016 – 2026 (USD Billion)
      Fig.10	Global RFID Kanban Systems Smart Healthcare Market, 2016 – 2026 (USD Billion)
      Fig.11	Global RFID Smart Cabinets Smart Healthcare Market, 2016 – 2026 (USD Billion)
      Fig.12	Global Others Smart Healthcare Market, 2016 – 2026 (USD Billion)
      Fig.13	Global Smart Healthcare Market Share, by Application, 2020 & 2026 (USD Billion)
      Fig.14	Global Storage and Inventory Management Smart Healthcare Market, 2016 – 2026 (USD Billion)
      Fig.15	Global Monitoring Smart Healthcare Market, 2016 – 2026 (USD Billion)
      Fig.16	Global Treatment Smart Healthcare Market, 2016 – 2026 (USD Billion)
      Fig.17	Global Others Smart Healthcare Market, 2016 – 2026 (USD Billion)
      Fig.18	Global Smart Healthcare Market Share, by End User, 2020 & 2026 (USD Billion)
      Fig.19	Global Hospitals Smart Healthcare Market, 2016 – 2026 (USD Billion)
      Fig.20	Global Home Care Settings Smart Healthcare Market, 2016 – 2026 (USD Billion)
      Fig.21	Global Smart Healthcare Market Share, by Region, 2020 & 2026 (USD Billion)
      Fig.22	North America Smart Healthcare Market, 2016 – 2026 (USD Billion)
      Fig.23	U.S. Smart Healthcare Market, 2016 – 2026 (USD Billion)
      Fig.24	Canada Smart Healthcare Market, 2016 – 2026 (USD Billion)
      Fig.25	Europe Smart Healthcare Market, 2016 – 2026 (USD Billion)
      Fig.26	Germany Smart Healthcare Market, 2016 – 2026 (USD Billion)
      Fig.27	France Smart Healthcare Market, 2016 – 2026 (USD Billion)
      Fig.28	U.K. Smart Healthcare Market, 2016 – 2026 (USD Billion)
      Fig.29	Italy Smart Healthcare Market, 2016 – 2026 (USD Billion)
      Fig.30	Spain Smart Healthcare Market, 2016 – 2026 (USD Billion)
      Fig.31	Rest of Europe Smart Healthcare Market, 2016 – 2026 (USD Billion)
      Fig.32	Asia Pacific Smart Healthcare Market, 2016 – 2026 (USD Billion)
      Fig.33	China Smart Healthcare Market, 2016 – 2026 (USD Billion)
      Fig.34	Japan Smart Healthcare Market, 2016 – 2026 (USD Billion)
      Fig.35	India Smart Healthcare Market, 2016 – 2026 (USD Billion)
      Fig.36	South  Korea Smart Healthcare Market, 2016 – 2026 (USD Billion)
      Fig.37	South-East Asia Smart Healthcare Market, 2016 – 2026 (USD Billion)
      Fig.38	Rest of Asia Pacific Smart Healthcare Market, 2016 – 2026 (USD Billion)
      Fig.39	Latin America Smart Healthcare Market, 2016 – 2026 (USD Billion)
      Fig.40	Brazil Smart Healthcare Market, 2016 – 2026 (USD Billion)
      Fig.41	Mexico Smart Healthcare Market, 2016 – 2026 (USD Billion)
      Fig.42	Rest of Latin America Smart Healthcare Market, 2016 – 2026 (USD Billion)
      Fig.43	The Middle-East and Africa Smart Healthcare Market, 2016 – 2026 (USD Billion)
      Fig.44	GCC Countries Smart Healthcare Market, 2016 – 2026 (USD Billion)
      Fig.45	South Africa Smart Healthcare Market, 2016 – 2026 (USD Billion)
      Fig.46	Rest of Middle-East Africa Smart Healthcare Market, 2016 – 2026 (USD Billion)
      Fig.47	Competitor Market Share – Revenue
      Fig.48	Stanley Innerspace Revenue and Growth Rate
      Fig.49	Stanley Innerspace Market Share
      Fig.50	Cerner Corporation Revenue and Growth Rate
      Fig.51	Cerner Corporation Market Share
      Fig.52	Pepperl Fuchs Revenue and Growth Rate
      Fig.53	Pepperl Fuchs Market Share
      Fig.54	Hurst Green Plastics Ltd. Revenue and Growth Rate
      Fig.55	Hurst Green Plastics Ltd. Market Share
      Fig.56	Brooks Automation Revenue and Growth Rate
      Fig.57	Brooks Automation Market Share
      Fig.58	Given Imaging Inc. Revenue and Growth Rate
      Fig.59	Given Imaging Inc. Market Share
      Fig.60	Samsung Electronics Corporation Revenue and Growth Rate
      Fig.61	Samsung Electronics Corporation Market Share
      Fig.62	Solstice Medical LLC Revenue and Growth Rate
      Fig.63	Solstice Medical LLC Market Share
      Fig.64	Siemens Medical Solutions Revenue and Growth Rate
      Fig.65	Siemens Medical Solutions Market Share
      Fig.66	Allscripts Healthcare Solutions Revenue and Growth Rate
      Fig.67	Allscripts Healthcare Solutions Market Share
      Fig.68	Bollhoff Group Revenue and Growth Rate
      Fig.69	Bollhoff Group Market Share
      Fig.70	Wurth Group Revenue and Growth Rate
      Fig.71	Wurth Group Market Share
      Fig.72	IBM Revenue and Growth Rate
      Fig.73	IBM Market Share
      Fig.74	Cisco Revenue and Growth Rate
      Fig.75	Cisco Market Share
      Fig.76	GE Healthcare Revenue and Growth Rate
      Fig.77	GE Healthcare Market Share
      Fig.78	Olympus Corporation Revenue and Growth Rate
      Fig.79	Olympus Corporation Market Share
      Fig.80	Philips Revenue and Growth Rate
      Fig.81	Philips Market Share
      Fig.82	AirStrip Technologies Inc. Revenue and Growth Rate
      Fig.83	AirStrip Technologies Inc. Market Share
      Fig.84	Apple Inc. Revenue and Growth Rate
      Fig.85	Apple Inc. Market Share
      Fig.86	AT&T Inc. Revenue and Growth Rate
      Fig.87	AT&T Inc. Market Share
      Fig.88	Logi-Tag Revenue and Growth Rate
      Fig.89	Logi-Tag Market Share
      Fig.90	McKesson Corporation Revenue and Growth Rate
      Fig.91	McKesson Corporation Market Share
      Fig.92	Brooks Automation Revenue and Growth Rate
      Fig.93	Brooks Automation Market Share
      Fig.94	LogTag Revenue and Growth Rate
      Fig.95	LogTag Market Share
      Fig.96	Market Dynamics
      Fig.97	Global Smart Healthcare – Value Chain Analysis
      Fig.98	Key Mandates and Regulations
      Fig.99	Technology Roadmap and Timeline
      Fig.100	Market Attractiveness Analysis – By Product Type
      Fig.101	Market Attractiveness Analysis – By Application
      Fig.102	Market Attractiveness Analysis – By End User
      Fig.103	Market Attractiveness Analysis – By Region
      Fig.104	Smart Healthcare Industrial Chain Analysis
      Fig.105	Market Channels
      Fig.106	Marketing Channel Development Trend
      Fig.107	Growth in World Gross Product, 2008-2018
      

      List of Tables

      Table 1	Global Smart Healthcare Market, 2020 & 2026 (USD Billion)
      Table 2	Global Smart Healthcare Market, by Product Type, 2016 – 2026 (USD Billion)
      Table 3	Global Smart Healthcare Market, by Application, 2016 – 2026 (USD Billion)
      Table 4	Global Smart Healthcare Market, by End User, 2016 – 2026 (USD Billion)
      Table 5	Global Smart Healthcare Market, by Region, 2016 – 2026 (USD Billion)
      Table 6	North America Smart Healthcare Market, by Country, 2016 – 2026 (USD Billion)
      Table 7	North America Smart Healthcare Market, by Product Type, 2016 – 2026 (USD Billion)
      Table 8	North America Smart Healthcare Market, by Application, 2016 – 2026 (USD Billion)
      Table 9	North America Smart Healthcare Market, by End User, 2016 – 2026 (USD Billion)
      Table 10 Europe Smart Healthcare Market, by Country, 2016 – 2026 (USD Billion)
      Table 11 Europe Smart Healthcare Market, by Product Type, 2016 – 2026 (USD Billion)
      Table 12 Europe Smart Healthcare Market, by Application, 2016 – 2026 (USD Billion)
      Table 13 Europe Smart Healthcare Market, by End User, 2016 – 2026 (USD Billion)
      Table 14 Asia Pacific Smart Healthcare Market, by Country, 2016 – 2026 (USD Billion)
      Table 15 Asia Pacific Smart Healthcare Market, by Product Type, 2016 – 2026 (USD Billion)
      Table 16 Asia Pacific Smart Healthcare Market, by Application, 2016 – 2026 (USD Billion)
      Table 17 Asia Pacific Smart Healthcare Market, by End User, 2016 – 2026 (USD Billion)
      Table 18 Latin America Smart Healthcare Market, by Country, 2016 – 2026 (USD Billion)
      Table 19 Latin America Smart Healthcare Market, by Product Type, 2016 – 2026 (USD Billion)
      Table 20 Latin America Smart Healthcare Market, by Application, 2016 – 2026 (USD Billion)
      Table 21 Latin America Smart Healthcare Market, by End User, 2016 – 2026 (USD Billion)
      Table 22 The Middle-East and Africa Smart Healthcare Market, by Country, 2016 – 2026 (USD Billion)
      Table 23 The Middle-East and Africa Smart Healthcare Market, by Product Type, 2016 – 2026 (USD Billion)
      Table 24 The Middle-East and Africa Smart Healthcare Market, by Application, 2016 – 2026 (USD Billion)
      Table 25 The Middle-East and Africa Smart Healthcare Market, by End User, 2016 – 2026 (USD Billion)
      Table 26 Global Smart Healthcare Market - Company Revenue Analysis, 2016 – 2020 (USD Billion)
      Table 27 Global Smart Healthcare Market - Company Revenue Share Analysis, 2016 – 2020 (%)
      Table 28 Acquisitions and Mergers
      Table 29 Market Drivers – Impact Analysis
      Table 30 Market Restraints
      Table 31 Market Opportunities
      Table 32 Major Buyers of Smart Healthcare
      Table 33 Distributors/Traders of Smart Healthcare by Region
      

Industry Major Market Players

  • Stanley Innerspace
  • Cerner Corporation
  • Pepperl Fuchs
  • Hurst Green Plastics Ltd.
  • Brooks Automation
  • Given Imaging Inc.
  • Samsung Electronics Corporation
  • Solstice Medical LLC
  • Siemens Medical Solutions
  • Allscripts Healthcare Solutions
  • Bollhoff Group
  • Wurth Group
  • IBM
  • Cisco
  • GE Healthcare
  • Olympus Corporation
  • Philips
  • AirStrip Technologies Inc.
  • Apple Inc.
  • AT&T Inc.
  • Logi-Tag
  • McKesson Corporation
  • Brooks Automation
  • LogTag