Search Market Research Report

Discover Our Latest Reports
Discover Our Featured Reports
Discover Top Selling Reports

Smart Grid Analytics Market Size, Share Global Analysis Report, 2020–2026

report img

Smart Grid Analytics Market By Solution Analysis (Grid Optimization, AMI Analytics, Asset Management, Demand Response Analytics, and Others), By Deployment Analysis (Cloud Based, On-Premises, and Hybrid), By Service Analysis (Professional Services, and Support and Maintenance Services), and BY End-User Analysis (Small & Medium Enterprises, Large Enterprises, Public Sector): Global Industry Outlook, Market Size, Business Intelligence, Consumer Preferences, Statistical Surveys, Comprehensive Analysis, Historical Developments, Current Trends, and Forecast 2020–2026

Industry Insights

The smart grid analytics market report analyzes and notifies the industry statistics at the global as well as regional and country levels in order to acquire a thorough perspective of the entire smart grid analytics market. The historical and past insights are provided for FY 2016 to FY 2019 whereas projected trends are delivered for FY 2020 to FY 2026. The quantitative and numerical data is represented in terms of value (USD Million) from FY 2016 – 2026.

This specialized and expertise-oriented industry research report scrutinizes the technical and commercial business outlook of the smart grid analytics industry. The report analyzes and declares the historical and current trends analysis of the smart grid analytics industry and subsequently recommends the projected trends anticipated to be observed in the smart grid analytics market during the upcoming years.

Smart Grid Analytics Market Size

To know more about this report | Request Free Sample Copy


logoKey Insights from Primary Research

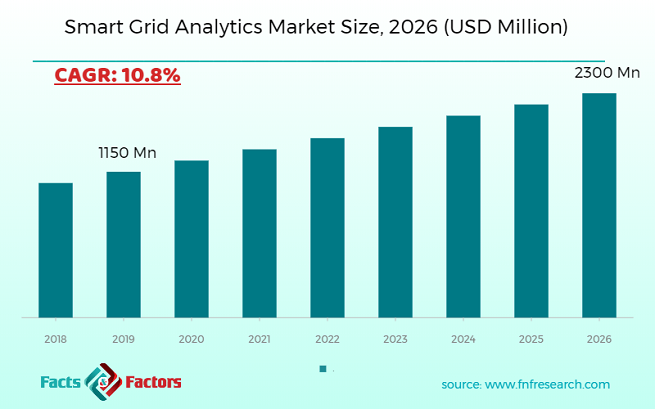
  • According to the CXO,s working in the smart grid analytics industry, the market is predicted to witness a substantial growth of above 10% during the years 2020-2026.
  • Due to the increasing demand for smart grid analytics, the market is expected to develop over USD 2,300 million by 2026. In 2019, the market accounted for USD 1,150 million.
  • The solution analysis segment, the AMI Analytics segment headed the market with more than USD 280 million, in 2019 and it is expected to grow over the forecast period owing to Increased investment by energy utilities in the deployment of AMI analytics.
  • On the basis of deployment, on-premises dominated the global smart grid data analytics market in 2019. It accounted for more than 58% share of the total market in 2019.
  • On the basis of the service, the support and maintenance services segment dominated the global smart grid analytics market in 2019. It accounted for above USD 900 million and is expected to grow during the forthcoming years attributed to the cost and easy availability of its services.

logoKey Recommendations from Analysts

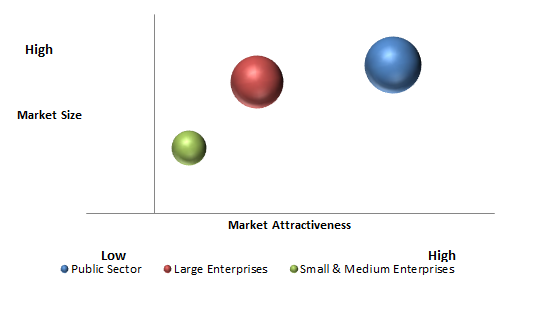
  • Our analysts recommend that the public sector segment is expected to be the fastest-growing market for smart grid analytics during the years to come attributed to the trust of the population in public sector companies and the huge budget provided by the government.
  • The Asia Pacific is expected to be the fastest-growing market for smart grid data analytics in the years to come, due to the increasing awareness about the benefits of smart grid analytics and low maintenance cost.
  • Owing to the rising investment and technological advancement, North America is expected to boost the market in the forthcoming years.
  • The large enterprise's category is anticipated to grow the market attributed of the implementation of the smart grid in their power station and increasing R&D activities.
  • Owing to the growing installation of smart meters, new innovations in smart grid technologies, and increasing demand for smart grid analytics, is expected to create lucrative opportunities in the market.

logoMarket Attractiveness By End-User Analysis

Smart Grid Analytics Market

To know more about this report | Request Free Sample Copy


The quantitative data is further underlined and reinforced by comprehensive qualitative data which comprises various across-the-board market dynamics. The rationales which directly or indirectly impact the smart grid analytics industry are exemplified through parameters such as growth drivers, restraints, challenges, and opportunities among other impacting factors.

Throughout our research report, we have encompassed all the proven models and tools of industry analysis and extensively illustrated all the key business strategies and business models adopted in the smart grid analytics industry. The report provides an all-inclusive and detailed competitive landscape prevalent in the smart grid analytics market.

The report utilizes established industry analysis tools and models such as Porter’s Five Forces framework to analyze and recognize critical business strategies adopted by various stakeholders involved in the entire value chain of the smart grid analytics industry. The smart grid analytics market report additionally employs SWOT analysis and PESTLE analysis models for further in-depth analysis.

The report study further includes an in-depth analysis of industry players' market shares and provides an overview of leading players' market positions in the smart grid analytics sector. Key strategic developments in the smart grid analytics market competitive landscape such as acquisitions & mergers, inaugurations of different products and services, partnerships & joint ventures, MoU agreements, VC & funding activities, R&D activities, and geographic expansion among other noteworthy activities by key players of the smart grid analytics market are appropriately highlighted in the report.

To examine the data produced from the smart grid network, smart grid analytics solutions are used. It is used for energy and utilities. Smart grid analytics are used in the utility and energy sectors, to enhance the efficiency of utility providers and to prevent the loss that occurs at the time of electricity generation and distribution. The rising investment in the smart grid system may drive the global market. Increasing adoption of the smart grid, increasing innovations in the Internet Of Things (IoT), and growing awareness about the advantages of smart analytics are driving market growth. Moreover, the low maintenance cost is also propelling the market. However, the lack of awareness and low availability of trained workers may impede market growth. On the other hand, growing installations of smart meters are expected to create many opportunities for the global smart grid analytics market.

The smart grid analytics market research report delivers an acute valuation and taxonomy of the smart grid analytics industry by practically splitting the market on the basis of different types, applications, and regions. Through the analysis of the historical and projected trends, all the segments and sub-segments were evaluated through the bottom-up approach, and different market sizes have been projected for FY 2020 to FY 2026. The regional segmentation of the smart grid analytics industry includes the complete classification of all the major continents including North America, Latin America, Europe, Asia Pacific, and the Middle East & Africa. Further, country-wise data for the smart grid analytics industry is provided for the leading economies of the world.

The smart grid analytics market is segmented based on solution analysis, deployment analysis, services analysis, and end-user analysis. On the basis of solution analysis segmentation, the market is classified into grid optimization, AMI analytics, asset management, demand response analytics, and others. In terms of deployment analysis segmentation, the market is bifurcated into cloud-based, on-premises, and hybrid. By services analysis, the market is separated into professional services, support, and maintenance services. And on the basis of end-user analysis, the market is classified into small & medium enterprises, large enterprises, and the public sector.

logoReport Scope

Report Attribute

Details

Market Size in 2019

USD 1,150 Million

Projected Market Size in 2026

USD 2,300 Million

CAGR Growth Rate

10.8% CAGR

Base Year

2019

Forecast Years

2020-2026

Key Market Players

SAP AG, Opower Inc., Siemens AG, Accenture Plc, Capgemini S.A., EMC Corporation, IBM Corporation, SAS Institute Inc., Oracle Corporation, Hewlett-Packard Company, and others.

Key Segment

By Solution, By Deployment, By Services, By End-User, By Region

Major Regions Covered

North America, Europe, Asia Pacific, Latin America, and the Middle East & Africa

Purchase Options

Request customized purchase options to meet your research needs. Explore purchase options

logoSome of the essential players operating in the smart grid analytics market, but not restricted to include

  •  Hewlett-Packard Company
  •  Opower Inc.
  •  SAP AG
  •  SAP AG
  •  Accenture Plc
  •  Capgemini S.A.
  •  SAP AG
  •  SAP AG
  •  IBM Corporation
  •  SAP AG
  •  Oracle Corporation
  •  SAS Institute Inc.

The taxonomy of the smart grid analytics industry by its scope and segmentation is as follows:

logo By Solution Segmentation Analysis

  • Grid Optimization
  • AMI Analytics
  • Asset Management
  • Demand Response Analytics
  • Others

logo By Deployment Segmentation Analysis

  • Cloud-Based
  • On-Premises
  • Hybrid

logo By Services Segmentation Analysis

  • Professional Services
  • Support and Maintenance Services

logo By End-User Segmentation Analysis

  • Small & Medium Enterprises
  • Large Enterprises
  • Public Sector

logo Regional Segmentation Analysis

  • North America
    • The U.S.
    • Canada
  • Europe
    • Germany
    • The UK
    • France
    • Spain
    • Italy
    • Rest of Europe
  • Asia Pacific
    • China
    • Japan
    • India
    • South Korea
    • Southeast Asia
    • Rest of Asia Pacific
  • Latin America
    • Brazil
    • Mexico
    • Rest of Latin America
  • Middle East & Africa
    • GCC
    • South Africa
    • Rest of the Middle East & Africa

Table of Content

  1. CHAPTER 1. Executive Summary
  2. CHAPTER 2. Smart Grid Analytics market – Solution Analysis
    1. 2.1. Global Smart Grid Analytics Market – Solution Overview
    2. 2.2. Global Smart Grid Analytics Market Share, by Solution, 2019 & 2026 (USD Million)
    3. 2.3. Grid Optimization
      1. 2.3.1. Global Grid Optimization Smart Grid Analytics Market, 2016-2026 (USD Million)
    4. 2.4. AMI Analytics
      1. 2.4.1. Global AMI Analytics Smart Grid Analytics Market, 2016-2026 (USD Million)
    5. 2.5. Asset Management
      1. 2.5.1. Global Asset Management Smart Grid Analytics Market, 2016-2026 (USD Million)
    6. 2.6. Demand Response Analytics
      1. 2.6.1. Global Demand Response Analytics Smart Grid Analytics Market, 2016-2026 (USD Million)
    7. 2.7. Others
      1. 2.7.1. Global Others Smart Grid Analytics Market, 2016-2026 (USD Million)
  3. CHAPTER 3. Smart Grid Analytics market – Deployment Analysis
    1. 3.1. Global Smart Grid Analytics Market – Deployment Overview
    2. 3.2. Global Smart Grid Analytics Market Share, by Deployment, 2019 & 2026 (USD Million)
    3. 3.3. Cloud Based
      1. 3.3.1. Global Cloud Based Smart Grid Analytics Market, 2016-2026 (USD Million)
    4. 3.4. On-Premises
      1. 3.4.1. Global On-Premises Smart Grid Analytics Market, 2016-2026 (USD Million)
    5. 3.5. Hybrid
      1. 3.5.1. Global Hybrid Smart Grid Analytics Market, 2016-2026 (USD Million)
  4. CHAPTER 4. Smart Grid Analytics market – Services Analysis
    1. 4.1. Global Smart Grid Analytics Market – Services Overview
    2. 4.2. Global Smart Grid Analytics Market Share, by Services, 2019 & 2026 (USD Million)
    3. 4.3. Professional Services
      1. 4.3.1. Global Professional Services Smart Grid Analytics Market, 2016-2026 (USD Million)
    4. 4.4. Support and Maintenance Services
      1. 4.4.1. Global Support and Maintenance Services Smart Grid Analytics Market, 2016-2026 (USD Million)
  5. CHAPTER 5. Smart Grid Analytics market – End-User Analysis
    1. 5.1. Global Smart Grid Analytics Market – End-User Overview
    2. 5.2. Global Smart Grid Analytics Market Share, by End-User , 2019 & 2026 (USD Million)
    3. 5.3. Small & Medium Enterprises
      1. 5.3.1. Global Small & Medium Enterprises Smart Grid Analytics Market, 2016-2026 (USD Million)
    4. 5.4. Large Enterprises
      1. 5.4.1. Global Large Enterprises Smart Grid Analytics Market, 2016-2026 (USD Million)
    5. 5.5. Public Sector
      1. 5.5.1. Global Public Sector Smart Grid Analytics Market, 2016-2026 (USD Million)
  6. CHAPTER 6. Smart Grid Analytics market – Regional Analysis
    1. 6.1. Global Smart Grid Analytics Market Regional Overview
    2. 6.2. Global Smart Grid Analytics Market Share, by Region, 2019 & 2026 (Value)
    3. 6.3. North America
      1. 6.3.1. North America Smart Grid Analytics Market size and forecast, 2016-2026
      2. 6.3.2. North America Smart Grid Analytics Market, by Country, 2019 & 2026 (USD Million)
      3. 6.3.3. North America Smart Grid Analytics Market, by Solution, 2016-2026
        1. 6.3.3.1. North America Smart Grid Analytics Market, by Solution, 2016-2026 (USD Million)
      4. 6.3.4. North America Smart Grid Analytics Market, by Deployment, 2016-2026
        1. 6.3.4.1. North America Smart Grid Analytics Market, by Deployment, 2016-2026 (USD Million)
      5. 6.3.5. North America Smart Grid Analytics Market, by Services, 2016-2026
        1. 6.3.5.1. North America Smart Grid Analytics Market, by Services, 2016-2026 (USD Million)
      6. 6.3.6. North America Smart Grid Analytics Market, by End-User , 2016-2026
        1. 6.3.6.1. North America Smart Grid Analytics Market, by End-User , 2016-2026 (USD Million)
      7. 6.3.7. U.S.
        1. 6.3.7.1. U.S. Market size and forecast, 2016-2026 (USD Million)
      8. 6.3.8. Canada
        1. 6.3.8.1. Canada Market size and forecast, 2016-2026 (USD Million)
    4. 6.4. Europe
      1. 6.4.1. Europe Smart Grid Analytics Market size and forecast, 2016-2026
      2. 6.4.2. Europe Smart Grid Analytics Market, by Country, 2019 & 2026 (USD Million)
      3. 6.4.3. Europe Smart Grid Analytics Market, by Solution, 2016-2026
        1. 6.4.3.1. Europe Smart Grid Analytics Market, by Solution, 2016-2026 (USD Million)
      4. 6.4.4. Europe Smart Grid Analytics Market, by Deployment, 2016-2026
        1. 6.4.4.1. Europe Smart Grid Analytics Market, by Deployment, 2016-2026 (USD Million)
      5. 6.4.5. Europe Smart Grid Analytics Market, by Services, 2016-2026
        1. 6.4.5.1. Europe Smart Grid Analytics Market, by Services, 2016-2026 (USD Million)
      6. 6.4.6. Europe Smart Grid Analytics Market, by End-User , 2016-2026
        1. 6.4.6.1. Europe Smart Grid Analytics Market, by End-User , 2016-2026 (USD Million)
      7. 6.4.7. Germany
        1. 6.4.7.1. Germany Market size and forecast, 2016-2026 (USD Million)
      8. 6.4.8. France
        1. 6.4.8.1. France Market size and forecast, 2016-2026 (USD Million)
      9. 6.4.9. U.K.
        1. 6.4.9.1. U.K. Market size and forecast, 2016-2026 (USD Million)
      10. 6.4.10. Italy
        1. 6.4.10.1. Italy Market size and forecast, 2016-2026 (USD Million)
      11. 6.4.11. Spain
        1. 6.4.11.1. Spain Market size and forecast, 2016-2026 (USD Million)
      12. 6.4.12. Rest of Europe
        1. 6.4.12.1. Rest of Europe Market size and forecast, 2016-2026 (USD Million)
    5. 6.5. Asia Pacific
      1. 6.5.1. Asia Pacific Smart Grid Analytics Market size and forecast, 2016-2026
      2. 6.5.2. Asia Pacific Smart Grid Analytics Market, by Country, 2019 & 2026 (USD Million)
      3. 6.5.3. Asia Pacific Smart Grid Analytics Market, by Solution, 2016-2026
        1. 6.5.3.1. Asia Pacific Smart Grid Analytics Market, by Solution, 2016-2026 (USD Million)
      4. 6.5.4. Asia Pacific Smart Grid Analytics Market, by Deployment, 2016-2026
        1. 6.5.4.1. Asia Pacific Smart Grid Analytics Market, by Deployment, 2016-2026 (USD Million)
      5. 6.5.5. Asia Pacific Smart Grid Analytics Market, by Services, 2016-2026
        1. 6.5.5.1. Asia Pacific Smart Grid Analytics Market, by Services, 2016-2026 (USD Million)
      6. 6.5.6. Asia Pacific Smart Grid Analytics Market, by End-User , 2016-2026
        1. 6.5.6.1. Asia Pacific Smart Grid Analytics Market, by End-User , 2016-2026 (USD Million)
      7. 6.5.7. China
        1. 6.5.7.1. China Market size and forecast, 2016-2026 (USD Million)
      8. 6.5.8. Japan
        1. 6.5.8.1. Japan Market size and forecast, 2016-2026 (USD Million)
      9. 6.5.9. India
        1. 6.5.9.1. India Market size and forecast, 2016-2026 (USD Million)
      10. 6.5.10. South Korea
        1. 6.5.10.1. South Korea Market size and forecast, 2016-2026 (USD Million)
      11. 6.5.11. South-East Asia
        1. 6.5.11.1. South-East Asia Market size and forecast, 2016-2026 (USD Million)
      12. 6.5.12. Rest of Asia Pacific
        1. 6.5.12.1. Rest of Asia Pacific Market size and forecast, 2016-2026 (USD Million)
    6. 6.6. Latin America
      1. 6.6.1. Latin America Smart Grid Analytics Market size and forecast, 2016-2026
      2. 6.6.2. Latin America Smart Grid Analytics Market, by Country, 2019 & 2026 (USD Million)
      3. 6.6.3. Latin America Smart Grid Analytics Market, by Solution, 2016-2026
        1. 6.6.3.1. Latin America Smart Grid Analytics Market, by Solution, 2016-2026 (USD Million)
      4. 6.6.4. Latin America Smart Grid Analytics Market, by Deployment, 2016-2026
        1. 6.6.4.1. Latin America Smart Grid Analytics Market, by Deployment, 2016-2026 (USD Million)
      5. 6.6.5. Latin America Smart Grid Analytics Market, by Services, 2016-2026
        1. 6.6.5.1. Latin America Smart Grid Analytics Market, by Services, 2016-2026 (USD Million)
      6. 6.6.6. Latin America Smart Grid Analytics Market, by End-User , 2016-2026
        1. 6.6.6.1. Latin America Smart Grid Analytics Market, by End-User , 2016-2026 (USD Million)
      7. 6.6.7. Brazil
        1. 6.6.7.1. Brazil Market size and forecast, 2016-2026 (USD Million)
      8. 6.6.8. Mexico
        1. 6.6.8.1. Mexico Market size and forecast, 2016-2026 (USD Million)
      9. 6.6.9. Rest of Latin America
        1. 6.6.9.1. Rest of Latin America Market size and forecast, 2016-2026 (USD Million)
    7. 6.7. The Middle-East and Africa
      1. 6.7.1. The Middle-East and Africa Smart Grid Analytics Market size and forecast, 2016-2026
      2. 6.7.2. The Middle-East and Africa Smart Grid Analytics Market, by Country, 2019 & 2026 (USD Million)
      3. 6.7.3. The Middle-East and Africa Smart Grid Analytics Market, by Solution, 2016-2026
        1. 6.7.3.1. The Middle-East and Africa Smart Grid Analytics Market, by Solution, 2016-2026 (USD Million)
      4. 6.7.4. The Middle-East and Africa Smart Grid Analytics Market, by Deployment, 2016-2026
        1. 6.7.4.1. The Middle-East and Africa Smart Grid Analytics Market, by Deployment, 2016-2026 (USD Million)
      5. 6.7.5. The Middle-East and Africa Smart Grid Analytics Market, by Services, 2016-2026
        1. 6.7.5.1. The Middle-East and Africa Smart Grid Analytics Market, by Services, 2016-2026 (USD Million)
      6. 6.7.6. The Middle-East and Africa Smart Grid Analytics Market, by End-User , 2016-2026
        1. 6.7.6.1. The Middle-East and Africa Smart Grid Analytics Market, by End-User , 2016-2026 (USD Million)
      7. 6.7.7. GCC Countries
        1. 6.7.7.1. GCC Countries Market size and forecast, 2016-2026 (USD Million)
      8. 6.7.8. South Africa
        1. 6.7.8.1. South Africa Market size and forecast, 2016-2026 (USD Million)
      9. 6.7.9. Rest of Middle-East Africa
        1. 6.7.9.1. Rest of Middle-East Africa Market size and forecast, 2016-2026 (USD Million)
  7. CHAPTER 7. Smart Grid Analytics market – Competitive Landscape
    1. 7.1. Competitor Market Share – Revenue
    2. 7.2. Market Concentration Rate Analysis, Top 3 and Top 5 Players
    3. 7.3. Strategic Development
      1. 7.3.1. Acquisitions and Mergers
      2. 7.3.2. New Products
      3. 7.3.3. Research & Development Activities
  8. CHAPTER 8. Company Profiles
    1. 8.1. SAP AG
      1. 8.1.1. Company Overview
      2. 8.1.2. SAP AG Revenue and Gross Margin
      3. 8.1.3. Product portfolio
      4. 8.1.4. Recent initiatives
    2. 8.2. Opower Inc.
      1. 8.2.1. Company Overview
      2. 8.2.2. Opower Inc. Revenue and Gross Margin
      3. 8.2.3. Product portfolio
      4. 8.2.4. Recent initiatives
    3. 8.3. Siemens AG
      1. 8.3.1. Company Overview
      2. 8.3.2. Siemens AG Revenue and Gross Margin
      3. 8.3.3. Product portfolio
      4. 8.3.4. Recent initiatives
    4. 8.4. Accenture Plc
      1. 8.4.1. Company Overview
      2. 8.4.2. Accenture Plc Revenue and Gross Margin
      3. 8.4.3. Product portfolio
      4. 8.4.4. Recent initiatives
    5. 8.5. Capgemini S.A.
      1. 8.5.1. Company Overview
      2. 8.5.2. Capgemini S.A. Revenue and Gross Margin
      3. 8.5.3. Product portfolio
      4. 8.5.4. Recent initiatives
    6. 8.6. EMC Corporation
      1. 8.6.1. Company Overview
      2. 8.6.2. EMC Corporation Revenue and Gross Margin
      3. 8.6.3. Product portfolio
      4. 8.6.4. Recent initiatives
    7. 8.7. IBM Corporation
      1. 8.7.1. Company Overview
      2. 8.7.2. IBM Corporation Revenue and Gross Margin
      3. 8.7.3. Product portfolio
      4. 8.7.4. Recent initiatives
    8. 8.8. SAS Institute Inc.
      1. 8.8.1. Company Overview
      2. 8.8.2. SAS Institute Inc. Revenue and Gross Margin
      3. 8.8.3. Product portfolio
      4. 8.8.4. Recent initiatives
    9. 8.9. Oracle Corporation
      1. 8.9.1. Company Overview
      2. 8.9.2. Oracle Corporation Revenue and Gross Margin
      3. 8.9.3. Product portfolio
      4. 8.9.4. Recent initiatives
    10. 8.10. Hewlett-Packard Company
      1. 8.10.1. Company Overview
      2. 8.10.2. Hewlett-Packard Company Revenue and Gross Margin
      3. 8.10.3. Product portfolio
      4. 8.10.4. Recent initiatives
  9. CHAPTER 9. Smart Grid Analytics — Industry Analysis
    1. 9.1. Smart Grid Analytics Market – Key Trends
      1. 9.1.1. Market Drivers
      2. 9.1.2. Market Restraints
      3. 9.1.3. Market Opportunities
    2. 9.2. Value Chain Analysis
    3. 9.3. Technology Roadmap and Timeline
    4. 9.4. Smart Grid Analytics Market – Attractiveness Analysis
      1. 9.4.1. By Solution
      2. 9.4.2. By Deployment
      3. 9.4.3. By Services
      4. 9.4.4. By End-User
      5. 9.4.5. By Region
  10. CHAPTER 10. Marketing Strategy Analysis, Distributors
    1. 10.1. Marketing Channel
    2. 10.2. Direct Marketing
    3. 10.3. Indirect Marketing
    4. 10.4. Marketing Channel Development Trend
    5. 10.5. Economic/Political Environmental Change
  11. CHAPTER 11. Report Conclusion
  12. CHAPTER 12. Research Approach & Methodology
    1. 12.1. Report Description
    2. 12.2. Research Scope
    3. 12.3. Research Methodology
      1. 12.3.1. Secondary Research
      2. 12.3.2. Primary Research
      3. 12.3.3. Models
        1. 12.3.3.1. Company Share Analysis Model
        2. 12.3.3.2. Revenue Based Modeling
        3. 12.3.3.3. Research Limitations

        List of Figures

        FIG. 1 Global Smart Grid Analytics Market, 2016-2026 (USD Million)
        FIG. 2 Global Smart Grid Analytics Market Share, by Solution, 2019 & 2026 (USD Million)
        FIG. 3 Global Grid Optimization Smart Grid Analytics Market, 2016-2026 (USD Million)
        FIG. 4 Global AMI Analytics Smart Grid Analytics Market, 2016-2026 (USD Million)
        FIG. 5 Global Asset Management Smart Grid Analytics Market, 2016-2026 (USD Million)
        FIG. 6 Global Demand Response Analytics Smart Grid Analytics Market, 2016-2026 (USD Million)
        FIG. 7 Global Others Smart Grid Analytics Market, 2016-2026 (USD Million)
        FIG. 8 Global Smart Grid Analytics Market Share, by Deployment, 2019 & 2026 (USD Million)
        FIG. 9 Global Cloud Based Smart Grid Analytics Market, 2016-2026 (USD Million)
        FIG. 10 Global On-Premises Smart Grid Analytics Market, 2016-2026 (USD Million)
        FIG. 11 Global Hybrid Smart Grid Analytics Market, 2016-2026 (USD Million)
        FIG. 12 Global Smart Grid Analytics Market Share, by Services, 2019 & 2026 (USD Million)
        FIG. 13 Global Professional Services Smart Grid Analytics Market, 2016-2026 (USD Million)
        FIG. 14 Global Support and Maintenance Services Smart Grid Analytics Market, 2016-2026 (USD Million)
        FIG. 15 Global Smart Grid Analytics Market Share, by End-User , 2019 & 2026 (USD Million)
        FIG. 16 Global Small & Medium Enterprises Smart Grid Analytics Market, 2016-2026 (USD Million)
        FIG. 17 Global Large Enterprises Smart Grid Analytics Market, 2016-2026 (USD Million)
        FIG. 18 Global Public Sector Smart Grid Analytics Market, 2016-2026 (USD Million)
        FIG. 19 Global Smart Grid Analytics Market Share, by Region, 2019 & 2026
        FIG. 20 North America Smart Grid Analytics Market, 2016-2026
        FIG. 21 U.S. Smart Grid Analytics Market, 2016-2026
        FIG. 22 Canada Smart Grid Analytics Market, 2016-2026
        FIG. 23 Europe Smart Grid Analytics Market, 2016-2026
        FIG. 24 Germany Smart Grid Analytics Market, 2016-2026
        FIG. 25 France Smart Grid Analytics Market, 2016-2026
        FIG. 26 U.K. Smart Grid Analytics Market, 2016-2026
        FIG. 27 Italy Smart Grid Analytics Market, 2016-2026
        FIG. 28 Spain Smart Grid Analytics Market, 2016-2026
        FIG. 29 Rest of Europe Smart Grid Analytics Market, 2016-2026
        FIG. 30 Asia Pacific Smart Grid Analytics Market, 2016-2026
        FIG. 31 China Smart Grid Analytics Market, 2016-2026
        FIG. 32 Japan Smart Grid Analytics Market, 2016-2026
        FIG. 33 India Smart Grid Analytics Market, 2016-2026
        FIG. 34 South  Korea Smart Grid Analytics Market, 2016-2026
        FIG. 35 South-East Asia Smart Grid Analytics Market, 2016-2026
        FIG. 36 Rest of Asia Pacific Smart Grid Analytics Market, 2016-2026
        FIG. 37 Latin America Smart Grid Analytics Market, 2016-2026
        FIG. 38 Brazil Smart Grid Analytics Market, 2016-2026
        FIG. 39 Mexico Smart Grid Analytics Market, 2016-2026
        FIG. 40 Rest of Latin America Smart Grid Analytics Market, 2016-2026
        FIG. 41 The Middle-East and Africa Smart Grid Analytics Market, 2016-2026
        FIG. 42 GCC Countries Smart Grid Analytics Market, 2016-2026
        FIG. 43 South Africa Smart Grid Analytics Market, 2016-2026
        FIG. 44 Rest of Middle-East Africa Smart Grid Analytics Market, 2016-2026
        FIG. 45 Competitor Market Share – Revenue
        FIG. 46 SAP AG Revenue and Growth Rate
        FIG. 47 SAP AG Market Share
        FIG. 48 Opower Inc. Revenue and Growth Rate
        FIG. 49 Opower Inc. Market Share
        FIG. 50 Siemens AG Revenue and Growth Rate
        FIG. 51 Siemens AG Market Share
        FIG. 52 Accenture Plc Revenue and Growth Rate
        FIG. 53 Accenture Plc Market Share
        FIG. 54 Capgemini S.A. Revenue and Growth Rate
        FIG. 55 Capgemini S.A. Market Share
        FIG. 56 EMC Corporation Revenue and Growth Rate
        FIG. 57 EMC Corporation Market Share
        FIG. 58 IBM Corporation Revenue and Growth Rate
        FIG. 59 IBM Corporation Market Share
        FIG. 60 SAS Institute Inc. Revenue and Growth Rate
        FIG. 61 SAS Institute Inc. Market Share
        FIG. 62 Oracle Corporation Revenue and Growth Rate
        FIG. 63 Oracle Corporation Market Share
        FIG. 64 Hewlett-Packard Company Revenue and Growth Rate
        FIG. 65 Hewlett-Packard Company Market Share
        FIG. 66 Market Dynamics
        FIG. 67 Global Smart Grid Analytics – Value Chain Analysis
        FIG. 68 Technology Roadmap and Timeline
        FIG. 69 Market Attractiveness Analysis – By Solution
        FIG. 70 Market Attractiveness Analysis – By Deployment
        FIG. 71 Market Attractiveness Analysis – By Services
        FIG. 72 Market Attractiveness Analysis – By End-User
        FIG. 73 Market Attractiveness Analysis – By Region
        FIG. 74 Market Channel
        FIG. 75 Marketing Channel Development Trend
        FIG. 76 Growth in World Gross Product, 2009-2019

        List of Tables

        TABLE 1 Global Smart Grid Analytics Market, 2019 & 2026 (USD Million)
        TABLE 2 Global Smart Grid Analytics market, by Solution, 2016-2026 (USD Million)
        TABLE 3 Global Smart Grid Analytics market, by Deployment, 2016-2026 (USD Million)
        TABLE 4 Global Smart Grid Analytics market, by Services, 2016-2026 (USD Million)
        TABLE 5 Global Smart Grid Analytics market, by End-User , 2016-2026 (USD Million)
        TABLE 6 Global Smart Grid Analytics market, by Region, 2016-2026 (USD Million)
        TABLE 7 North America Smart Grid Analytics Market, by Solution, 2016-2026 (USD Million)
        TABLE 8 North America Smart Grid Analytics Market, by Deployment, 2016-2026 (USD Million)
        TABLE 9 North America Smart Grid Analytics Market, by Services, 2016-2026 (USD Million)
        TABLE 10 North America Smart Grid Analytics Market, by End-User , 2016-2026 (USD Million)
        TABLE 11 Europe Smart Grid Analytics Market, by Solution, 2016-2026 (USD Million)
        TABLE 12 Europe Smart Grid Analytics Market, by Deployment, 2016-2026 (USD Million)
        TABLE 13 Europe Smart Grid Analytics Market, by Services, 2016-2026 (USD Million)
        TABLE 14 Europe Smart Grid Analytics Market, by End-User , 2016-2026 (USD Million)
        TABLE 15 Asia Pacific Smart Grid Analytics Market, by Solution, 2016-2026 (USD Million)
        TABLE 16 Asia Pacific Smart Grid Analytics Market, by Deployment, 2016-2026 (USD Million)
        TABLE 17 Asia Pacific Smart Grid Analytics Market, by Services, 2016-2026 (USD Million)
        TABLE 18 Asia Pacific Smart Grid Analytics Market, by End-User , 2016-2026 (USD Million)
        TABLE 19 Latin America Smart Grid Analytics Market, by Solution, 2016-2026 (USD Million)
        TABLE 20 Latin America Smart Grid Analytics Market, by Deployment, 2016-2026 (USD Million)
        TABLE 21 Latin America Smart Grid Analytics Market, by Services, 2016-2026 (USD Million)
        TABLE 22 Latin America Smart Grid Analytics Market, by End-User , 2016-2026 (USD Million)
        TABLE 23 The Middle-East and Africa Smart Grid Analytics Market, by Solution, 2016-2026 (USD Million)
        TABLE 24 The Middle-East and Africa Smart Grid Analytics Market, by Deployment, 2016-2026 (USD Million)
        TABLE 25 The Middle-East and Africa Smart Grid Analytics Market, by Services, 2016-2026 (USD Million)
        TABLE 26 The Middle-East and Africa Smart Grid Analytics Market, by End-User , 2016-2026 (USD Million)
        TABLE 27 Global Smart Grid Analytics Market - Company Revenue Analysis 2016-2019 (USD Million)
        TABLE 28 Global Smart Grid Analytics Market - Company Revenue Share Analysis 2016-2019(%)
        TABLE 29 Acquisitions and Mergers
        TABLE 30 New Product/Service Launch
        TABLE 31 Research & Development Activities
        TABLE 32 Market Drivers
        TABLE 33 Market Restraints
        TABLE 34 Market Opportunities
        

Industry Major Market Players

  •  Hewlett-Packard Company
  •  Opower Inc.
  •  SAP AG
  •  SAP AG
  •  Accenture Plc
  •  Capgemini S.A.
  •  SAP AG
  •  SAP AG
  •  IBM Corporation
  •  SAP AG
  •  Oracle Corporation
  •  SAS Institute Inc.