Search Market Research Report

Discover Our Latest Reports
Discover Our Featured Reports
Discover Top Selling Reports

Smart Glass Market Size, Share Global Analysis Report, 2020–2026

report img

Smart Glass Market By Technology (Electrochromic, Thermochromic, SPD, and PDLC) and By Application (Transportation, Electronics, Architecture, Solar Power Generation and Others): Global Industry Outlook, Market Size, Business Intelligence, Consumer Preferences, Statistical Surveys, Comprehensive Analysis, Historical Developments, Current Trends, and Forecast 2020–2026

Industry Insights

The Smart Glass market report analyzes and notifies the industry statistics at the global as well as regional and country levels in order to acquire a thorough perspective of the entire Smart Glass market. The historical and past insights are provided for FY 2016 to FY 2019 whereas projected trends are delivered for FY 2020 to FY 2026. The quantitative and numerical data is represented in terms of both volume (K Units) and value (USD Million) from FY 2016 – 2026.

This specialized and expertise-oriented industry research report scrutinizes the technical and commercial business outlook of the Smart Glass industry. The report analyzes and declares the historical and current trends analysis of the Smart Glass industry and subsequently recommends the projected trends anticipated to be observed in the Smart Glass market during the upcoming years.

Smart Glass Market Size

To know more about this report | Request Free Sample Copy


logoKey Insights from Primary Research

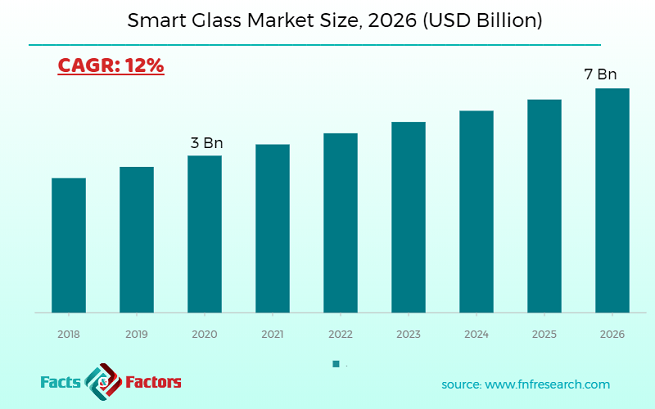
  • As per our primary respondents, the Smart Glass market is expected to grow at a CAGR of around 12%.
  • Through the primary research by our respondents, it was established that the Smart Glass market was valued at around USD 3 Billion in 2019.
  • On the basis of technology segmentation, the “SPD(Suspended Particle Devices)” category is expected to share the maximum share.
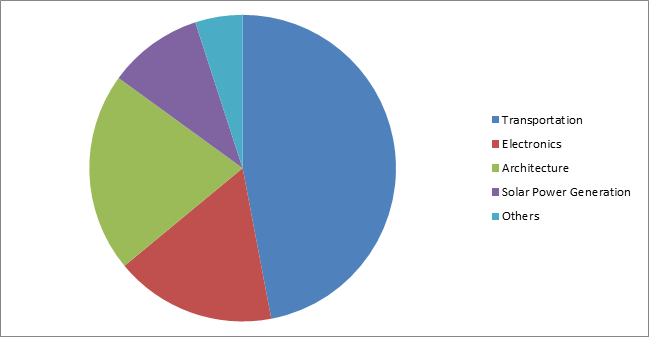
  • On the basis of application segmentation, the “transportation” category is expected to share the maximum share.

logoKey Recommendations from Analysts

  • As per the details shared by our analysts, an increase in the demand for eco-friendly and energy-efficient products is boosting the market for smart glasses.
  • Owing to their durability and toughness, the smart glasses can last longer and don’t get degraded through their long exposure to light.
  • The smart glasses market offers a number of opportunities for all stakeholders across the entire value chain as it grows with a CAGR of 12%.
  • The increasing regulatory reforms for green buildings are encouraging investments from the construction industry.

logoMarket Attractiveness – By Application

Smart Glass Market

To know more about this report | Request Free Sample Copy


The quantitative data is further underlined and reinforced by comprehensive qualitative data which comprises various across-the-board market dynamics. The rationales which directly or indirectly impact the Smart Glass industry are exemplified through parameters such as growth drivers, restraints, challenges, and opportunities among other impacting factors.

Throughout our research report, we have encompassed all the proven models and tools of industry analysis and extensively illustrated all the key business strategies and business models adopted in the Smart Glass industry. The report provides an all-inclusive and detailed competitive landscape prevalent in the Smart Glass market.

The report utilizes established industry analysis tools and models such as Porter’s Five Forces framework to analyze and recognize critical business strategies adopted by various stakeholders involved in the entire value chain of the Smart Glass industry. The Smart Glass market report additionally employs SWOT analysis and PESTLE analysis models for further in-depth analysis.

The report study further includes an in-depth analysis of industry players' market shares and provides an overview of leading players' market positions in the Smart Glass sector. Key strategic developments in the Smart Glass market competitive landscape such as acquisitions & mergers, inaugurations of different products and services, partnerships & joint ventures, MoU agreements, VC & funding activities, R&D activities, and geographic expansion among other noteworthy activities by key players of the Smart Glass market are appropriately highlighted in the report.

Smart glass is the glass that is equipped with electrochromic, photochromic, and thermochromic materials which help to regulate the amount of light passing through it as they change their physical property of transparency to translucency and vice versa. These glasses are considered to be manufactured using clean technology which it is considered to be safe for the environment. These smart glasses are in great demand they have a longer shelf life but due to their high pricing, the production of these smart glasses gets hindered. Due to its technological advancements, it is largely used in the automobile sector in manufacturing auto parts like sunroofs, windshields, and windows. These smart glasses are expected to grow largely in the region of North America owing to the government policies for green buildings and energy harvesting.

The Smart Glass market research report delivers an acute valuation and taxonomy of the Smart Glass industry by practically splitting the market on the basis of different types, applications, and regions. Through the analysis of the historical and projected trends, all the segments and sub-segments were evaluated through the bottom-up approach, and different market sizes have been projected for FY 2020 to FY 2026. The regional segmentation of the Smart Glass industry includes the complete classification of all the major continents including North America, Latin America, Europe, Asia Pacific, and Middle East & Africa. Further, country-wise data for the Smart Glass industry is provided for the leading economies of the world.

The Smart Glass market is segmented based on Type and Application. On the basis of type segmentation, the market is classified into Electrochromic, Thermochromic, SPD, and PDLC. In terms of Application segmentation, the market is bifurcated into Transportation, Electronics, Architecture, Solar Power Generation, and Others.

logoReport Scope

Report Attribute

Details

Market Size in 2019

USD 3 Billion

Projected Market Size in 2026

USD 7 Billion

CAGR Growth Rate

12% CAGR

Base Year

2019

Forecast Years

2020-2026

Key Market Players

Smart Glass International Ltd, View Inc, AGC Ltd, Glass Apps, Gentex Corp, PPG Industries, Pleotint LLC, Research Frontiers Inc, SPD Control System Corporation, SAGE Electrochromics, Raven Brick LLC, Hitachi Chemicals Co Ltd, Scienstry Inc, SAGE Electrochromics, and Others.

Key Segment

By Type, By Application, By Region

Major Regions Covered

North America, Europe, Asia Pacific, Latin America, and the Middle East & Africa

Purchase Options

Request customized purchase options to meet your research needs. Explore purchase options

The taxonomy of the Smart Glass industry by its scope and segmentation is as follows:

logoSome of the essential players operating in the Smart Glass market, but not restricted to include

  •  Smart Glass International Ltd
  •  View Inc
  •  AGC Ltd
  •  Glass Apps
  •  Gentex Corp
  •  PPG Industries
  •  Pleotint LLC
  •  Research Frontiers Inc
  •  SPD Control System Corporation
  •  SAGE Electrochromics
  •  Raven Brick LLC
  •  Hitachi Chemicals Co Ltd
  •  Scienstry Inc
  •  SAGE Electrochromics

logo By Type Segmentation Analysis (Customizable)

  • Electrochromic
  • Thermochromic
  • SPD
  • PDLC

logo By Application Segmentation Analysis (Customizable)

  • Transportation
  • Electronics
  • Architecture
  • Solar Power Generation
  • Others

logo Regional Segmentation Analysis (Customizable)

  • North America
    • The U.S.
    • Canada
  • Europe
    • Germany
    • The UK
    • France
    • Spain
    • Italy
    • Rest of Europe
  • Asia Pacific
    • China
    • Japan
    • India
    • South Korea
    • Southeast Asia
    • Rest of Asia Pacific
  • Latin America
    • Brazil
    • Mexico
    • Rest of Latin America
  • Middle East & Africa
    • GCC
    • South Africa
    • Rest of the Middle East & Africa

Table of Content

  1. CHAPTER 1. Executive Summary
  2. CHAPTER 2. Smart Glass market – Technology Analysis
    1. 2.1. Global Smart Glass Market – Technology Overview
    2. 2.2. Global Smart Glass Market Share, by Technology , 2018 & 2025 (USD Million)
    3. 2.3. Global Smart Glass Market share, by Technology , 2018 & 2025 (K Units)
    4. 2.4. Electrochromic
      1. 2.4.1. Global Electrochromic Smart Glass Market, 2016-2026 (USD Million)
      2. 2.4.2. Global Electrochromic Smart Glass Market, 2016-2026 (K Units)
    5. 2.5. Thermochromic
      1. 2.5.1. Global Thermochromic Smart Glass Market, 2016-2026 (USD Million)
      2. 2.5.2. Global Thermochromic Smart Glass Market, 2016-2026 (K Units)
    6. 2.6. SPD
      1. 2.6.1. Global SPD Smart Glass Market, 2016-2026 (USD Million)
      2. 2.6.2. Global SPD Smart Glass Market, 2016-2026 (K Units)
    7. 2.7. PDLC
      1. 2.7.1. Global PDLC Smart Glass Market, 2016-2026 (USD Million)
      2. 2.7.2. Global PDLC Smart Glass Market, 2016-2026 (K Units)
  3. CHAPTER 3. Smart Glass market – Application Analysis
    1. 3.1. Global Smart Glass Market – Application Overview
    2. 3.2. Global Smart Glass Market Share, by Application, 2018 & 2025 (USD Million)
    3. 3.3. Global Smart Glass Market share, by Application, 2018 & 2025 (K Units)
    4. 3.4. Transportation
      1. 3.4.1. Global Transportation Smart Glass Market, 2016-2026 (USD Million)
      2. 3.4.2. Global Transportation Smart Glass Market, 2016-2026 (K Units)
    5. 3.5. Electronics
      1. 3.5.1. Global Electronics Smart Glass Market, 2016-2026 (USD Million)
      2. 3.5.2. Global Electronics Smart Glass Market, 2016-2026 (K Units)
    6. 3.6. Architecture
      1. 3.6.1. Global Architecture Smart Glass Market, 2016-2026 (USD Million)
      2. 3.6.2. Global Architecture Smart Glass Market, 2016-2026 (K Units)
    7. 3.7. Solar Power Generation
      1. 3.7.1. Global Solar Power Generation Smart Glass Market, 2016-2026 (USD Million)
      2. 3.7.2. Global Solar Power Generation Smart Glass Market, 2016-2026 (K Units)
    8. 3.8. Others
      1. 3.8.1. Global Others Smart Glass Market, 2016-2026 (USD Million)
      2. 3.8.2. Global Others Smart Glass Market, 2016-2026 (K Units)
  4. CHAPTER 4. Smart Glass market – Regional Analysis
    1. 4.1. Global Smart Glass Market Regional Overview
    2. 4.2. Global Smart Glass Market Share, by Region, 2018 & 2025 (Value)
    3. 4.3. Global Smart Glass Market Share, by Region, 2018 & 2025 (Volume)
    4. 4.4. North America
      1. 4.4.1. North America Smart Glass Market size and forecast, 2016-2026
      2. 4.4.2. North America Smart Glass Market, by Country, 2018 - 2025 (USD Million)
      3. 4.4.3. North America Market size and forecast, 2016-2026 (K Units)
      4. 4.4.4. North America Smart Glass Market, by Country, 2018 - 2025 (K Units)
      5. 4.4.5. North America Smart Glass Market, by Technology , 2016-2026
      6. 4.4.6. North America Smart Glass Market, by Application, 2016-2026
      7. 4.4.7. U.S.
      8. 4.4.8. Canada
    5. 4.5. Europe
      1. 4.5.1. Europe Smart Glass Market size and forecast, 2016-2026
      2. 4.5.2. Europe Smart Glass Market, by Country, 2018 - 2025 (USD Million)
      3. 4.5.3. Europe Market size and forecast, 2016-2026 (K Units)
      4. 4.5.4. Europe Smart Glass Market, by Country, 2018 - 2025 (K Units)
      5. 4.5.5. Europe Smart Glass Market, by Technology , 2016-2026
      6. 4.5.6. Europe Smart Glass Market, by Application, 2016-2026
      7. 4.5.7. Germany
      8. 4.5.8. France
      9. 4.5.9. U.K.
      10. 4.5.10. Italy
      11. 4.5.11. Spain
      12. 4.5.12. Rest of Europe
    6. 4.6. Asia Pacific
      1. 4.6.1. Asia Pacific Smart Glass Market size and forecast, 2016-2026
      2. 4.6.2. Asia Pacific Smart Glass Market, by Country, 2018 - 2025 (USD Million)
      3. 4.6.3. Asia Pacific Market size and forecast, 2016-2026 (K Units)
      4. 4.6.4. Asia Pacific Smart Glass Market, by Country, 2018 - 2025 (K Units)
      5. 4.6.5. Asia Pacific Smart Glass Market, by Technology , 2016-2026
      6. 4.6.6. Asia Pacific Smart Glass Market, by Application, 2016-2026
      7. 4.6.7. China
      8. 4.6.8. Japan
      9. 4.6.9. India
      10. 4.6.10. South Korea
      11. 4.6.11. South-East Asia
      12. 4.6.12. Rest of Asia Pacific
    7. 4.7. Latin America
      1. 4.7.1. Latin America Smart Glass Market size and forecast, 2016-2026
      2. 4.7.2. Latin America Smart Glass Market, by Country, 2018 - 2025 (USD Million)
      3. 4.7.3. Latin America Market size and forecast, 2016-2026 (K Units)
      4. 4.7.4. Latin America Smart Glass Market, by Country, 2018 - 2025 (K Units)
      5. 4.7.5. Latin America Smart Glass Market, by Technology , 2016-2026
      6. 4.7.6. Latin America Smart Glass Market, by Application, 2016-2026
      7. 4.7.7. Brazil
      8. 4.7.8. Mexico
      9. 4.7.9. Rest of Latin America
    8. 4.8. The Middle-East and Africa
      1. 4.8.1. The Middle-East and Africa Smart Glass Market size and forecast, 2016-2026
      2. 4.8.2. The Middle-East and Africa Smart Glass Market, by Country, 2018 - 2025 (USD Million)
      3. 4.8.3. The Middle-East and Africa Market size and forecast, 2016-2026 (K Units)
      4. 4.8.4. The Middle-East and Africa Smart Glass Market, by Country, 2018 - 2025 (K Units)
      5. 4.8.5. The Middle-East and Africa Smart Glass Market, by Technology , 2016-2026
      6. 4.8.6. The Middle-East and Africa Smart Glass Market, by Application, 2016-2026
      7. 4.8.7. GCC Countries
      8. 4.8.8. South Africa
      9. 4.8.9. Rest of Middle-East Africa
  5. CHAPTER 5. Smart Glass Production, Consumption, Export, Import by Regions
    1. 5.1. Global Smart Glass production and revenue, 2015-2025 (USD Million) (K Units)
    2. 5.2. Global Import and Export Analysis, by Region
  6. CHAPTER 6. Smart Glass market – Competitive Landscape
    1. 6.1. Competitor Market Share – Revenue
    2. 6.2. Market Concentration Rate Analysis, Top 3 and Top 5 Players
    3. 6.3. Competitor Market Share – Volume
    4. 6.4. Strategic Development
      1. 6.4.1. Acquisitions and Mergers
      2. 6.4.2. New Products
      3. 6.4.3. Research & Development Activities
  7. CHAPTER 7. Company Profiles
    1. 7.1. Smart Glass International Ltd
      1. 7.1.1. Company Overview
      2. 7.1.2. Smart Glass International Ltd Sales, Revenue, Price, and Gross Margin
      3. 7.1.3. Product portfolio
      4. 7.1.4. Recent initiatives
    2. 7.2. View Inc
      1. 7.2.1. Company Overview
      2. 7.2.2. View Inc Sales, Revenue, Price, and Gross Margin
      3. 7.2.3. Product portfolio
      4. 7.2.4. Recent initiatives
    3. 7.3. AGC Ltd
      1. 7.3.1. Company Overview
      2. 7.3.2. AGC Ltd Sales, Revenue, Price, and Gross Margin
      3. 7.3.3. Product portfolio
      4. 7.3.4. Recent initiatives
    4. 7.4. Glass Apps
      1. 7.4.1. Company Overview
      2. 7.4.2. Glass Apps Sales, Revenue, Price, and Gross Margin
      3. 7.4.3. Product portfolio
      4. 7.4.4. Recent initiatives
    5. 7.5. Gentex Corp
      1. 7.5.1. Company Overview
      2. 7.5.2. Gentex Corp Sales, Revenue, Price, and Gross Margin
      3. 7.5.3. Product portfolio
      4. 7.5.4. Recent initiatives
    6. 7.6. PPG Industries
      1. 7.6.1. Company Overview
      2. 7.6.2. PPG Industries Sales, Revenue, Price, and Gross Margin
      3. 7.6.3. Product portfolio
      4. 7.6.4. Recent initiatives
    7. 7.7. Pleotint LLC
      1. 7.7.1. Company Overview
      2. 7.7.2. Pleotint LLC Sales, Revenue, Price, and Gross Margin
      3. 7.7.3. Product portfolio
      4. 7.7.4. Recent initiatives
    8. 7.8. Research Frontiers Inc
      1. 7.8.1. Company Overview
      2. 7.8.2. Research Frontiers Inc Sales, Revenue, Price, and Gross Margin
      3. 7.8.3. Product portfolio
      4. 7.8.4. Recent initiatives
    9. 7.9. SPD Control System Corporation
      1. 7.9.1. Company Overview
      2. 7.9.2. SPD Control System Corporation Sales, Revenue, Price, and Gross Margin
      3. 7.9.3. Product portfolio
      4. 7.9.4. Recent initiatives
    10. 7.10. SAGE Electrochromics
      1. 7.10.1. Company Overview
      2. 7.10.2. SAGE Electrochromics Sales, Revenue, Price, and Gross Margin
      3. 7.10.3. Product portfolio
      4. 7.10.4. Recent initiatives
    11. 7.11. Raven Brick LLC
      1. 7.11.1. Company Overview
      2. 7.11.2. Raven Brick LLC Sales, Revenue, Price, and Gross Margin
      3. 7.11.3. Product portfolio
      4. 7.11.4. Recent initiatives
    12. 7.12. Hitachi Chemicals Co Ltd
      1. 7.12.1. Company Overview
      2. 7.12.2. Hitachi Chemicals Co Ltd Sales, Revenue, Price, and Gross Margin
      3. 7.12.3. Product portfolio
      4. 7.12.4. Recent initiatives
    13. 7.13. Scienstry Inc
      1. 7.13.1. Company Overview
      2. 7.13.2. Scienstry Inc Sales, Revenue, Price, and Gross Margin
      3. 7.13.3. Product portfolio
      4. 7.13.4. Recent initiatives
    14. 7.14. SAGE Electrochromics
      1. 7.14.1. Company Overview
      2. 7.14.2. SAGE Electrochromics Sales, Revenue, Price, and Gross Margin
      3. 7.14.3. Product portfolio
      4. 7.14.4. Recent initiatives
    15. 7.15. Others
      1. 7.15.1. Company Overview
      2. 7.15.2. Others Sales, Revenue, Price, and Gross Margin
      3. 7.15.3. Product portfolio
      4. 7.15.4. Recent initiatives
  8. CHAPTER 8. Smart Glass — Industry Analysis
    1. 8.1. Introduction and Taxonomy
    2. 8.2. Smart Glass Market – Key Trends
      1. 8.2.1. Market Drivers
      2. 8.2.2. Market Restraints
      3. 8.2.3. Market Opportunities
    3. 8.3. Value Chain Analysis
    4. 8.4. Key Mandates and Regulations
    5. 8.5. Technology Roadmap and Timeline
    6. 8.6. Smart Glass market – Attractiveness Analysis
      1. 8.6.1. By Technology
      2. 8.6.2. By Application
      3. 8.6.3. By Region
  9. CHAPTER 9. Raw Material analysis
    1. 9.1. Smart Glass Key Raw Material Analysis
      1. 9.1.1. Key Raw Materials
      2. 9.1.2. Price Trend of Key Raw Materials
    2. 9.2. Key Suppliers of Raw Materials
    3. 9.3. Proportion of Manufacturing Cost Structure
      1. 9.3.1. Raw Materials
      2. 9.3.2. Labor Cost
    4. 9.4. Manufacturing Expenses Analysis of Smart Glass
  10. CHAPTER 10. Industrial Chain, Sourcing Strategy and Downstream Buyers
    1. 10.1. Smart Glass Industrial Chain Analysis
    2. 10.2. Upstream Raw Materials Sourcing
      1. 10.2.1. Risk Mitigation:
      2. 10.2.2. Supplier Relationships:
      3. 10.2.3. Business Processes:
      4. 10.2.4. Securing the Product:
    3. 10.3. Raw Materials Sources of Smart Glass Major Manufacturers in 2016
    4. 10.4. Downstream Buyers
    5. 10.5. Distributors/Traders List
  11. CHAPTER 11. Marketing Strategy Analysis, Distributors
    1. 11.1. Marketing Channel
    2. 11.2. Direct Marketing
    3. 11.3. Indirect Marketing
    4. 11.4. Marketing Channel Development Trend
    5. 11.5. Economic/Political Environmental Change
  12. CHAPTER 12. Report Conclusion
  13. CHAPTER 13. Research Approach & Methodology
    1. 13.1. Report Description
    2. 13.2. Research Scope
    3. 13.3. Research Methodology
      1. 13.3.1. Secondary Research
      2. 13.3.2. Primary Research
      3. 13.3.3. Models

      List of Figures

      FIG. 1 Global Smart Glass Market, 2016-2026 (USD Million)
      FIG. 2 Global Smart Glass Market Share, by Technology , 2018 & 2025 (USD Million)
      FIG. 3 Global Smart Glass Market share, by Technology , 2018 & 2025 (K Units)
      FIG. 4 Global Electrochromic Smart Glass Market, 2016-2026 (USD Million)
      FIG. 5 Global Electrochromic Smart Glass  Market, 2016-2026 (K Units)
      FIG. 6 Global Thermochromic Smart Glass Market, 2016-2026 (USD Million)
      FIG. 7 Global Thermochromic Smart Glass  Market, 2016-2026 (K Units)
      FIG. 8 Global SPD Smart Glass Market, 2016-2026 (USD Million)
      FIG. 9 Global SPD Smart Glass  Market, 2016-2026 (K Units)
      FIG. 10 Global PDLC Smart Glass Market, 2016-2026 (USD Million)
      FIG. 11 Global PDLC Smart Glass  Market, 2016-2026 (K Units)
      FIG. 12 Global Smart Glass Market Share, by Application, 2018 & 2025 (USD Million)
      FIG. 13 Global Smart Glass Market share, by Application, 2018 & 2025 (K Units)
      FIG. 14 Global Transportation Smart Glass Market, 2016-2026 (USD Million)
      FIG. 15 Global Transportation Smart Glass  Market, 2016-2026 (K Units)
      FIG. 16 Global Electronics Smart Glass Market, 2016-2026 (USD Million)
      FIG. 17 Global Electronics Smart Glass  Market, 2016-2026 (K Units)
      FIG. 18 Global Architecture Smart Glass Market, 2016-2026 (USD Million)
      FIG. 19 Global Architecture Smart Glass  Market, 2016-2026 (K Units)
      FIG. 20 Global Solar Power Generation Smart Glass Market, 2016-2026 (USD Million)
      FIG. 21 Global Solar Power Generation Smart Glass  Market, 2016-2026 (K Units)
      FIG. 22 Global Others Smart Glass Market, 2016-2026 (USD Million)
      FIG. 23 Global Others Smart Glass  Market, 2016-2026 (K Units)
      FIG. 24 Global Smart Glass Market Share, by Region, 2018 & 2025
      FIG. 25 Global Smart Glass Market Share, by Region, 2018 & 2025
      FIG. 26 North America Smart Glass Market, 2016-2026
      FIG. 27 North America Smart Glass  Market, 2016-2026 (K Units)
      FIG. 28 U.S. Smart Glass Market, 2016-2026
      FIG. 29 U.S. Smart Glass  Market, 2016-2026 (K Units)
      FIG. 30 Canada Smart Glass Market, 2016-2026
      FIG. 31 Canada Smart Glass  Market, 2016-2026 (K Units)
      FIG. 32 Europe Smart Glass Market, 2016-2026
      FIG. 33 Europe Smart Glass  Market, 2016-2026 (K Units)
      FIG. 34 Germany Smart Glass Market, 2016-2026
      FIG. 35 Germany Smart Glass  Market, 2016-2026 (K Units)
      FIG. 36 France Smart Glass Market, 2016-2026
      FIG. 37 France Smart Glass  Market, 2016-2026 (K Units)
      FIG. 38 U.K. Smart Glass Market, 2016-2026
      FIG. 39 U.K. Smart Glass  Market, 2016-2026 (K Units)
      FIG. 40 Italy Smart Glass Market, 2016-2026
      FIG. 41 Italy Smart Glass  Market, 2016-2026 (K Units)
      FIG. 42 Spain Smart Glass Market, 2016-2026
      FIG. 43 Spain Smart Glass  Market, 2016-2026 (K Units)
      FIG. 44 Rest of Europe Smart Glass Market, 2016-2026
      FIG. 45 Rest of Europe Smart Glass  Market, 2016-2026 (K Units)
      FIG. 46 Asia Pacific Smart Glass Market, 2016-2026
      FIG. 47 Asia Pacific Smart Glass  Market, 2016-2026 (K Units)
      FIG. 48 China Smart Glass Market, 2016-2026
      FIG. 49 China Smart Glass  Market, 2016-2026 (K Units)
      FIG. 50 Japan Smart Glass Market, 2016-2026
      FIG. 51 Japan Smart Glass  Market, 2016-2026 (K Units)
      FIG. 52 India Smart Glass Market, 2016-2026
      FIG. 53 India Smart Glass  Market, 2016-2026 (K Units)
      FIG. 54 South  Korea Smart Glass Market, 2016-2026
      FIG. 55 South  Korea Smart Glass  Market, 2016-2026 (K Units)
      FIG. 56 South-East Asia Smart Glass Market, 2016-2026
      FIG. 57 South-East Asia Smart Glass  Market, 2016-2026 (K Units)
      FIG. 58 Rest of Asia Pacific Smart Glass Market, 2016-2026
      FIG. 59 Rest of Asia Pacific Smart Glass  Market, 2016-2026 (K Units)
      FIG. 60 Latin America Smart Glass Market, 2016-2026
      FIG. 61 Latin America Smart Glass  Market, 2016-2026 (K Units)
      FIG. 62 Brazil Smart Glass Market, 2016-2026
      FIG. 63 Brazil Smart Glass  Market, 2016-2026 (K Units)
      FIG. 64 Mexico Smart Glass Market, 2016-2026
      FIG. 65 Mexico Smart Glass  Market, 2016-2026 (K Units)
      FIG. 66 Rest of Latin America Smart Glass Market, 2016-2026
      FIG. 67 Rest of Latin America Smart Glass  Market, 2016-2026 (K Units)
      FIG. 68 The Middle-East and Africa Smart Glass Market, 2016-2026
      FIG. 69 The Middle-East and Africa Smart Glass  Market, 2016-2026 (K Units)
      FIG. 70 GCC Countries Smart Glass Market, 2016-2026
      FIG. 71 GCC Countries Smart Glass  Market, 2016-2026 (K Units)
      FIG. 72 South Africa Smart Glass Market, 2016-2026
      FIG. 73 South Africa Smart Glass  Market, 2016-2026 (K Units)
      FIG. 74 Rest of Middle-East Africa Smart Glass Market, 2016-2026
      FIG. 75 Rest of Middle-East Africa Smart Glass  Market, 2016-2026 (K Units)
      FIG. 76 Global Smart Glass production and revenue, 2015-2025 (USD Million) (K Units)
      FIG. 77 North America Smart Glass production and revenue, 2015-2025 (USD Million) (K Units)
      FIG. 78 Europe Smart Glass production and revenue, 2015-2025 (USD Million) (K Units)
      FIG. 79 Asia Pacific Smart Glass production and revenue, 2015-2025 (USD Million) (K Units)
      FIG. 80 Latin America Smart Glass production and revenue, 2015-2025 (USD Million) (K Units)
      FIG. 81 Middle East and Africa Smart Glass production and revenue, 2015-2025 (USD Million) (K Units)
      FIG. 82 Competitor Market Share – Revenue
      FIG. 83 Competitor Market Share – Volume
      FIG. 84 Smart Glass International Ltd Revenue and Growth Rate
      FIG. 85 Smart Glass International Ltd Market Share
      FIG. 86 View Inc Revenue and Growth Rate
      FIG. 87 View Inc Market Share
      FIG. 88 AGC Ltd Revenue and Growth Rate
      FIG. 89 AGC Ltd Market Share
      FIG. 90 Glass Apps Revenue and Growth Rate
      FIG. 91 Glass Apps Market Share
      FIG. 92 Gentex Corp Revenue and Growth Rate
      FIG. 93 Gentex Corp Market Share
      FIG. 94 PPG Industries Revenue and Growth Rate
      FIG. 95 PPG Industries Market Share
      FIG. 96 Pleotint LLC Revenue and Growth Rate
      FIG. 97 Pleotint LLC Market Share
      FIG. 98 Research Frontiers Inc Revenue and Growth Rate
      FIG. 99 Research Frontiers Inc Market Share
      FIG. 100 SPD Control System Corporation Revenue and Growth Rate
      FIG. 101 SPD Control System Corporation Market Share
      FIG. 102 SAGE Electrochromics Revenue and Growth Rate
      FIG. 103 SAGE Electrochromics Market Share
      FIG. 104 Raven Brick LLC Revenue and Growth Rate
      FIG. 105 Raven Brick LLC Market Share
      FIG. 106 Hitachi Chemicals Co Ltd Revenue and Growth Rate
      FIG. 107 Hitachi Chemicals Co Ltd Market Share
      FIG. 108 Scienstry Inc Revenue and Growth Rate
      FIG. 109 Scienstry Inc Market Share
      FIG. 110 SAGE Electrochromics Revenue and Growth Rate
      FIG. 111 SAGE Electrochromics Market Share
      FIG. 112 Others Revenue and Growth Rate
      FIG. 113 Others Market Share
      FIG. 114 Market Dynamics
      FIG. 115 Global Smart Glass – Value Chain Analysis
      FIG. 116 Key Mandates and Regulations
      FIG. 117 Technology Roadmap and Timeline
      FIG. 118 Market Attractiveness Analysis – By Technology
      FIG. 119 Market Attractiveness Analysis – By Application
      FIG. 120 Market Attractiveness Analysis – By Region
      FIG. 121 Manufacturing Cost Structure of Smart Glass
      FIG. 122 Smart Glass Industrial Chain Analysis
      FIG. 123 Market Channel
      FIG. 124 Marketing Channel Development Trend
      FIG. 125 Growth in World Gross Product, 2008-2018

      List of Tables

      TABLE 1 Global Smart Glass market, 2018 & 2025 (USD Million)
      TABLE 2 Global Smart Glass market, by Technology , 2016-2026 (USD Million)
      TABLE 3 Global Smart Glass market, by Technology , 2016-2026 (K Units)
      TABLE 4 Global Smart Glass market, by Application, 2016-2026 (USD Million)
      TABLE 5 Global Smart Glass market, by Application, 2016-2026 (K Units)
      TABLE 6 Global Smart Glass market, by region, 2016-2026 (USD Million)
      TABLE 7 Global Smart Glass market, by region, 2016-2026 (K Units)
      TABLE 8 North America Smart Glass Market, by Technology , 2016-2026 (USD Million)
      TABLE 9 North America Smart Glass Market, by Technology , 2016-2026 (K Units)
      TABLE 10 North America Smart Glass Market, by Application, 2016-2026 (USD Million)
      TABLE 11 North America Smart Glass Market, by Application, 2016-2026 (K Units)
      TABLE 12 Europe Smart Glass Market, by Technology , 2016-2026 (USD Million)
      TABLE 13 Europe Smart Glass Market, by Technology , 2016-2026 (K Units)
      TABLE 14 Europe Smart Glass Market, by Application, 2016-2026 (USD Million)
      TABLE 15 Europe Smart Glass Market, by Application, 2016-2026 (K Units)
      TABLE 16 Asia Pacific Smart Glass Market, by Technology , 2016-2026 (USD Million)
      TABLE 17 Asia Pacific Smart Glass Market, by Technology , 2016-2026 (K Units)
      TABLE 18 Asia Pacific Smart Glass Market, by Application, 2016-2026 (USD Million)
      TABLE 19 Asia Pacific Smart Glass Market, by Application, 2016-2026 (K Units)
      TABLE 20 Latin America Smart Glass Market, by Technology , 2016-2026 (USD Million)
      TABLE 21 Latin America Smart Glass Market, by Technology , 2016-2026 (K Units)
      TABLE 22 Latin America Smart Glass Market, by Application, 2016-2026 (USD Million)
      TABLE 23 Latin America Smart Glass Market, by Application, 2016-2026 (K Units)
      TABLE 24 The Middle-East and Africa Smart Glass Market, by Technology , 2016-2026 (USD Million)
      TABLE 25 The Middle-East and Africa Smart Glass Market, by Technology , 2016-2026 (K Units)
      TABLE 26 The Middle-East and Africa Smart Glass Market, by Application, 2016-2026 (USD Million)
      TABLE 27 The Middle-East and Africa Smart Glass Market, by Application, 2016-2026 (K Units)
      TABLE 28 North America Smart Glass Production, Consumption, Export, Import, 2016-2019
      TABLE 29 Europe Smart Glass Production, Consumption, Export, Import, 2016-2019
      TABLE 30 Asia Pacific Smart Glass Production, Consumption, Export, Import, 2016-2019
      TABLE 31 Latin America Smart Glass Production, Consumption, Export, Import, 2016-2019
      TABLE 32 Middle East & Africa Smart Glass Production, Consumption, Export, Import, 2016-2019
      TABLE 33 Global Smart Glass Market - Company Revenue Analysis 2016-2019 (USD Million)
      TABLE 34 Global Smart Glass Market - Company Revenue Share Analysis 2016-2019(%)
      TABLE 35 Global Smart Glass Market - Company Volume Analysis 2016-2019 (K Units)
      TABLE 36 Global Smart Glass Market - Company Volume Share Analysis 2016-2019(%)
      TABLE 37 Acquisitions and Mergers
      TABLE 38 New Product/Service Launch
      TABLE 39 Research & Development Activities
      TABLE 40 Market Drivers
      TABLE 41 Market Restraints
      TABLE 42 Market Opportunities
      TABLE 43 Production Base and Market Concentration Rate of Raw Material
      TABLE 44 Key Suppliers of Raw Materials
      TABLE 45 Raw Materials Sources of Smart Glass Major Manufacturers in 2016
      TABLE 46 Major Buyers of Smart Glass
      TABLE 47 Distributors/Traders of Smart Glass by Region
      

Industry Major Market Players

  •  Smart Glass International Ltd
  •  View Inc
  •  AGC Ltd
  •  Glass Apps
  •  Gentex Corp
  •  PPG Industries
  •  Pleotint LLC
  •  Research Frontiers Inc
  •  SPD Control System Corporation
  •  SAGE Electrochromics
  •  Raven Brick LLC
  •  Hitachi Chemicals Co Ltd
  •  Scienstry Inc
  •  SAGE Electrochromics