Search Market Research Report

Discover Our Latest Reports
Discover Our Featured Reports
Discover Top Selling Reports

Smart Buildings Market Size, Share Global Analysis Report, 2021 – 2026

report img

Smart Buildings Market By Product (Lighting, Safety & Security, Monitoring, Heating, Ventilation & Air Conditioning (HVAC), Energy Management, Emergency Systems, Car Parking Management Systems, & Others), By Building Type (Residential, Commercial, & Industrial), And By Regions - Global & Regional Industry Perspective, Comprehensive Analysis, and Forecast 2021 – 2026

Industry Insights

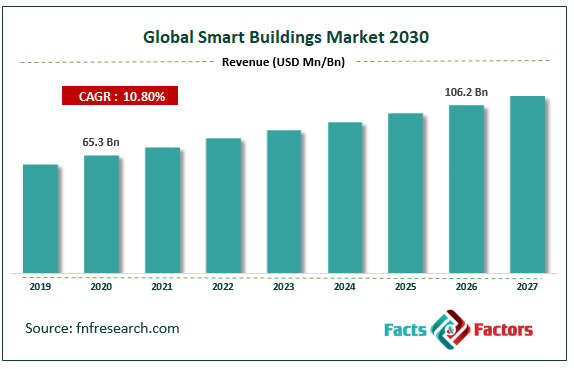
[223+ Pages Report] The latest findings and offering on the smart buildings market released by Facts & Factors provides complete historical and future market study. We at facts and factors estimate that the global smart buildings market will be valued at USD 65.3 Billion in the year 2020 and will grow at an estimated CAGR rate of 10.8% to an overall value of USD 106.2 Billion by 2026.

Global Smart Buildings Market Size

To know more about this report | Request Free Sample Copy

logoMarket Overview

Smart buildings are infrastructure that have the capability to incorporate an automated process that can control the building’s operations in terms of heating, ventilation, air conditioning, lighting, security, and other ranges of systems from time to time. These building structures use sensors, actuators, and microchips in order to collect an array of data in order to regulate the intended settings and controls. Smart buildings improve asset reliability and performing by reducing energy usage and often incorporating how space is utilized in the most efficient manner.

logoIndustry Growth Factors

The primary driving factors for the global smart building market contributes to the rising adoption of IoT based building management systems coupled with increasing awareness about space utilization to name a few. Additionally, rising industry standards and regulation coupled with increasing demand for managing energy effectively is expected to increase the global smart building market during the advent of the forecast. Moreover, the rising demand from the sector of facility occupants coupled with the increasing integration of smart buildings for new office environments is expected to boost the global smart building market during the advent of the forecast.

The global smart building market is expected to be driven by factors pertaining to the rising need for safety and security coupled with reducing operational and maintenance costs to name a few. Additionally, factors attaining to reducing carbon dioxide (CO2) levels with proper implementation of smart building systems coupled with a rising number of initiatives and regulations by various government bodies are expected to boost the global smart building market during the advent of the forecast period.However, a lack of global coordination in regards to a common set of rules and regulations is expected to hamper the growth of the global smart building market during the forecast period.

logoSegmentation Analysis

The global smart building market is segmented intoproducts,building type, and region.

The global smart building market is divided intolighting, safety & security, monitoring, heating, ventilation & air conditioning (HVAC), energy management, emergency systems, and car parking management systems, and otherson the basis of products. The segment pertaining to energy management systems is expected to witness the largest market share during the advent of the forecast owing to rising demands for a reduction in energy-associated costs associated with buildings, schools, and buildings coupled with increased functionalities by continuous real-time monitoring of systems to name a few. On the basis of building type, theglobal smart building market is categorized into residential, commercial, and industrial. The commercial segment is expected to occupy the largest market share during the advent of the forecast owing to the increasing demand for appropriate and tailor-made solutions for optimized energy solutions from the commercial sector coupled with increasing comfort & security measures to name a few.

logo Report Scope

Report Attribute

Details

Market Size in 2020

USD 65.3 Billion

Projected Market Size in 2026

USD 106.2 Billion

CAGR Growth Rate

10.8% CAGR

Base Year

2020

Forecast Years

2021-2026

Key Market Players

75F, ABB, Aquicore, Bosch, BuildingIQ, Cisco, CopperTree Analytics, ENTOUCH, Hitachi, Honeywell, Huawei, IBM, Igor, Intel, Johnson Controls, KMC Controls, Legrand, Mode:Green, PTC, Schneider Electric, Siemens, Softdel, Spaceti, Telit, Verdigris Technologies, and Emerson Electric Co. Ltd., among others.

Key Segments

Products, Building Types, and Region

Major Regions Covered

North America, Europe, Asia Pacific, Latin America, and Middle East & Africa

Purchase Options

Request customized purchase options to meet your research needs. Explore purchase options

logo Regional Analysis

North America is expected to witness the largest market share during the advent of the forecast owing to integration of advanced technologies such as IoT, big data, cloud computing, data analytics, and deep learning & AI solutions within smart building systems coupled with rising regulatory hurdles towards increasing consumer sustainability standards to name a few. Additionally, an increasing amount of population contributing to technological advancements in the region coupled with rising demand for leveraging smart building systems forregulating energy and storage needs is expected to increase the footprint of the smart building market during the forecast period. Moreover, rising government support formaking smart building solutions more accessible and cost-effective is expected to open new revenue opportunities for the smart building market during the forecast period. Europe is expected to witness the subsequent market share owing to increasing number of service providers in the region coupled with increasing adoption of smart building systems in the region.

logo Competitive Players

The key market participants for the global smart building market are:

  • 75F
  • ABB
  • Aquicore
  • Bosch
  • BuildingIQ
  • Cisco
  • CopperTree Analytics
  • ENTOUCH
  • Hitachi
  • Honeywell
  • Huawei
  • IBM
  • Igor
  • Intel
  • Johnson Controls
  • KMC Controls
  • Legrand
  • Mode:Green
  • PTC
  • Schneider Electric
  • Siemens
  • Softdel
  • Spaceti
  • Telit
  • Verdigris Technologies
  • Emerson Electric Co. Ltd.

logo By Product Segment Analysis

  • Lighting
  • Safety & Security
  • Monitoring
  • Heating, Ventilation & Air Conditioning (HVAC)
  • Energy Management
  • Emergency Systems
  • Car Parking Management Systems
  • Others

logo By Building Type Segment Analysis

  • Residential
  • Commercial
  • Industrial

Table of Content

  1. Chapter 1 Executive Summary
    1. 1.1. Introduction of Smart Buildings
    2. 1.2. Global Smart Buildings Market, 2019 & 2026 (USD Billion)
    3. 1.3. Global Smart Buildings Market, 2016 – 2026 (USD Billion)
    4. 1.4. Global Smart Buildings Market Absolute Revenue Opportunity, 2016 – 2026 (USD Billion)
    5. 1.5. Global Smart Buildings Market Incremental Revenue Opportunity, 2020 – 2026 (USD Billion)
  2. Chapter 2 Smart Buildings Market – Product Analysis
    1. 2.1. Global Smart Buildings Market – Product Overview
    2. 2.2. Global Smart Buildings Market Share, by Product , 2019 & 2026 (USD Billion)
    3. 2.3. Lighting
      1. 2.3.1. Global Lighting Smart Buildings Market, 2016 – 2026 (USD Billion)
    4. 2.4. Safety & Security
      1. 2.4.1. Global Safety & Security Smart Buildings Market, 2016 – 2026 (USD Billion)
    5. 2.5. Monitoring
      1. 2.5.1. Global Monitoring Smart Buildings Market, 2016 – 2026 (USD Billion)
    6. 2.6. Heating, Ventilation & Air Conditioning (HVAC)
      1. 2.6.1. Global Heating, Ventilation & Air Conditioning (HVAC) Smart Buildings Market, 2016 – 2026 (USD Billion)
    7. 2.7. Energy Management
      1. 2.7.1. Global Energy Management Smart Buildings Market, 2016 – 2026 (USD Billion)
    8. 2.8. Emergency Systems
      1. 2.8.1. Global Emergency Systems Smart Buildings Market, 2016 – 2026 (USD Billion)
    9. 2.9. Car Parking Management Systems
      1. 2.9.1. Global Car Parking Management Systems Smart Buildings Market, 2016 – 2026 (USD Billion)
    10. 2.10. Others
      1. 2.10.1. Global Others Smart Buildings Market, 2016 – 2026 (USD Billion)
  3. Chapter 3 Smart Buildings Market – Building Type Analysis
    1. 3.1. Global Smart Buildings Market – Building Type Overview
    2. 3.2. Global Smart Buildings Market Share, by Building Type, 2019 & 2026 (USD Billion)
    3. 3.3. Residential
      1. 3.3.1. Global Residential Smart Buildings Market, 2016 – 2026 (USD Billion)
    4. 3.4. Commercial
      1. 3.4.1. Global Commercial Smart Buildings Market, 2016 – 2026 (USD Billion)
    5. 3.5. Industrial
      1. 3.5.1. Global Industrial Smart Buildings Market, 2016 – 2026 (USD Billion)
  4. Chapter 4 Smart Buildings Market – Regional Analysis
    1. 4.1. Global Smart Buildings Market Regional Overview
    2. 4.2. Global Smart Buildings Market Share, by Region, 2019 & 2026 (USD Billion)
    3. 4.3. North America
      1. 4.3.1. North America Smart Buildings Market, 2016 – 2026 (USD Billion)
        1. 4.3.1.1. North America Smart Buildings Market, by Country, 2016 - 2026 (USD Billion)
      2. 4.3.2. North America Smart Buildings Market, by Product , 2016 – 2026
        1. 4.3.2.1. North America Smart Buildings Market, by Product , 2016 – 2026 (USD Billion)
      3. 4.3.3. North America Smart Buildings Market, by Building Type, 2016 – 2026
        1. 4.3.3.1. North America Smart Buildings Market, by Building Type, 2016 – 2026 (USD Billion)
      4. 4.3.4. U.S.
        1. 4.3.4.1. U.S. Smart Buildings Market, 2016 – 2026 (USD Billion)
      5. 4.3.5. Canada
        1. 4.3.5.1. Canada Smart Buildings Market, 2016 – 2026 (USD Billion)
    4. 4.4. Europe
      1. 4.4.1. Europe Smart Buildings Market, 2016 – 2026 (USD Billion)
        1. 4.4.1.1. Europe Smart Buildings Market, by Country, 2016 - 2026 (USD Billion)
      2. 4.4.2. Europe Smart Buildings Market, by Product , 2016 – 2026
        1. 4.4.2.1. Europe Smart Buildings Market, by Product , 2016 – 2026 (USD Billion)
      3. 4.4.3. Europe Smart Buildings Market, by Building Type, 2016 – 2026
        1. 4.4.3.1. Europe Smart Buildings Market, by Building Type, 2016 – 2026 (USD Billion)
      4. 4.4.4. Germany
        1. 4.4.4.1. Germany Smart Buildings Market, 2016 – 2026 (USD Billion)
      5. 4.4.5. France
        1. 4.4.5.1. France Smart Buildings Market, 2016 – 2026 (USD Billion)
      6. 4.4.6. U.K.
        1. 4.4.6.1. U.K. Smart Buildings Market, 2016 – 2026 (USD Billion)
      7. 4.4.7. Italy
        1. 4.4.7.1. Italy Smart Buildings Market, 2016 – 2026 (USD Billion)
      8. 4.4.8. Spain
        1. 4.4.8.1. Spain Smart Buildings Market, 2016 – 2026 (USD Billion)
      9. 4.4.9. Rest of Europe
        1. 4.4.9.1. Rest of Europe Smart Buildings Market, 2016 – 2026 (USD Billion)
    5. 4.5. Asia Pacific
      1. 4.5.1. Asia Pacific Smart Buildings Market, 2016 – 2026 (USD Billion)
        1. 4.5.1.1. Asia Pacific Smart Buildings Market, by Country, 2016 - 2026 (USD Billion)
      2. 4.5.2. Asia Pacific Smart Buildings Market, by Product , 2016 – 2026
        1. 4.5.2.1. Asia Pacific Smart Buildings Market, by Product , 2016 – 2026 (USD Billion)
      3. 4.5.3. Asia Pacific Smart Buildings Market, by Building Type, 2016 – 2026
        1. 4.5.3.1. Asia Pacific Smart Buildings Market, by Building Type, 2016 – 2026 (USD Billion)
      4. 4.5.4. China
        1. 4.5.4.1. China Smart Buildings Market, 2016 – 2026 (USD Billion)
      5. 4.5.5. Japan
        1. 4.5.5.1. Japan Smart Buildings Market, 2016 – 2026 (USD Billion)
      6. 4.5.6. India
        1. 4.5.6.1. India Smart Buildings Market, 2016 – 2026 (USD Billion)
      7. 4.5.7. South Korea
        1. 4.5.7.1. South Korea Smart Buildings Market, 2016 – 2026 (USD Billion)
      8. 4.5.8. South-East Asia
        1. 4.5.8.1. South-East Asia Smart Buildings Market, 2016 – 2026 (USD Billion)
      9. 4.5.9. Rest of Asia Pacific
        1. 4.5.9.1. Rest of Asia Pacific Smart Buildings Market, 2016 – 2026 (USD Billion)
    6. 4.6. Latin America
      1. 4.6.1. Latin America Smart Buildings Market, 2016 – 2026 (USD Billion)
        1. 4.6.1.1. Latin America Smart Buildings Market, by Country, 2016 - 2026 (USD Billion)
      2. 4.6.2. Latin America Smart Buildings Market, by Product , 2016 – 2026
        1. 4.6.2.1. Latin America Smart Buildings Market, by Product , 2016 – 2026 (USD Billion)
      3. 4.6.3. Latin America Smart Buildings Market, by Building Type, 2016 – 2026
        1. 4.6.3.1. Latin America Smart Buildings Market, by Building Type, 2016 – 2026 (USD Billion)
      4. 4.6.4. Brazil
        1. 4.6.4.1. Brazil Smart Buildings Market, 2016 – 2026 (USD Billion)
      5. 4.6.5. Mexico
        1. 4.6.5.1. Mexico Smart Buildings Market, 2016 – 2026 (USD Billion)
      6. 4.6.6. Rest of Latin America
        1. 4.6.6.1. Rest of Latin America Smart Buildings Market, 2016 – 2026 (USD Billion)
    7. 4.7. The Middle-East and Africa
      1. 4.7.1. The Middle-East and Africa Smart Buildings Market, 2016 – 2026 (USD Billion)
        1. 4.7.1.1. The Middle-East and Africa Smart Buildings Market, by Country, 2016 - 2026 (USD Billion)
      2. 4.7.2. The Middle-East and Africa Smart Buildings Market, by Product , 2016 – 2026
        1. 4.7.2.1. The Middle-East and Africa Smart Buildings Market, by Product , 2016 – 2026 (USD Billion)
      3. 4.7.3. The Middle-East and Africa Smart Buildings Market, by Building Type, 2016 – 2026
        1. 4.7.3.1. The Middle-East and Africa Smart Buildings Market, by Building Type, 2016 – 2026 (USD Billion)
      4. 4.7.4. GCC Countries
        1. 4.7.4.1. GCC Countries Smart Buildings Market, 2016 – 2026 (USD Billion)
      5. 4.7.5. South Africa
        1. 4.7.5.1. South Africa Smart Buildings Market, 2016 – 2026 (USD Billion)
      6. 4.7.6. Rest of Middle-East Africa
        1. 4.7.6.1. Rest of Middle-East Africa Smart Buildings Market, 2016 – 2026 (USD Billion)
  5. Chapter 5 Smart Buildings Market – Competitive Landscape
    1. 5.1. Competitor Market Share – Revenue
    2. 5.2. Market Concentration Rate Analysis, Top 3 and Top 5 Players
    3. 5.3. Strategic Developments
      1. 5.3.1. Acquisitions and Mergers
      2. 5.3.2. New Products
      3. 5.3.3. Research & Development Activities
  6. Chapter 6 Company Profiles
    1. 6.1. 75F
      1. 6.1.1. Company Overview
      2. 6.1.2. Product/Service Portfolio
      3. 6.1.3. 75F Sales, Revenue, and Gross Margin
      4. 6.1.4. 75F Revenue and Growth Rate
      5. 6.1.5. 75F Market Share
      6. 6.1.6. Recent Initiatives, Funding/VC Activities, and Technological Innovations
    2. 6.2. ABB
      1. 6.2.1. Company Overview
      2. 6.2.2. Product/Service Portfolio
      3. 6.2.3. ABB Sales, Revenue, and Gross Margin
      4. 6.2.4. ABB Revenue and Growth Rate
      5. 6.2.5. ABB Market Share
      6. 6.2.6. Recent Initiatives, Funding/VC Activities, and Technological Innovations
    3. 6.3. Aquicore
      1. 6.3.1. Company Overview
      2. 6.3.2. Product/Service Portfolio
      3. 6.3.3. Aquicore Sales, Revenue, and Gross Margin
      4. 6.3.4. Aquicore Revenue and Growth Rate
      5. 6.3.5. Aquicore Market Share
      6. 6.3.6. Recent Initiatives, Funding/VC Activities, and Technological Innovations
    4. 6.4. Bosch
      1. 6.4.1. Company Overview
      2. 6.4.2. Product/Service Portfolio
      3. 6.4.3. Bosch Sales, Revenue, and Gross Margin
      4. 6.4.4. Bosch Revenue and Growth Rate
      5. 6.4.5. Bosch Market Share
      6. 6.4.6. Recent Initiatives, Funding/VC Activities, and Technological Innovations
    5. 6.5. BuildingIQ
      1. 6.5.1. Company Overview
      2. 6.5.2. Product/Service Portfolio
      3. 6.5.3. BuildingIQ Sales, Revenue, and Gross Margin
      4. 6.5.4. BuildingIQ Revenue and Growth Rate
      5. 6.5.5. BuildingIQ Market Share
      6. 6.5.6. Recent Initiatives, Funding/VC Activities, and Technological Innovations
    6. 6.6. Cisco
      1. 6.6.1. Company Overview
      2. 6.6.2. Product/Service Portfolio
      3. 6.6.3. Cisco Sales, Revenue, and Gross Margin
      4. 6.6.4. Cisco Revenue and Growth Rate
      5. 6.6.5. Cisco Market Share
      6. 6.6.6. Recent Initiatives, Funding/VC Activities, and Technological Innovations
    7. 6.7. CopperTree Analytics
      1. 6.7.1. Company Overview
      2. 6.7.2. Product/Service Portfolio
      3. 6.7.3. CopperTree Analytics Sales, Revenue, and Gross Margin
      4. 6.7.4. CopperTree Analytics Revenue and Growth Rate
      5. 6.7.5. CopperTree Analytics Market Share
      6. 6.7.6. Recent Initiatives, Funding/VC Activities, and Technological Innovations
    8. 6.8. ENTOUCH
      1. 6.8.1. Company Overview
      2. 6.8.2. Product/Service Portfolio
      3. 6.8.3. ENTOUCH Sales, Revenue, and Gross Margin
      4. 6.8.4. ENTOUCH Revenue and Growth Rate
      5. 6.8.5. ENTOUCH Market Share
      6. 6.8.6. Recent Initiatives, Funding/VC Activities, and Technological Innovations
    9. 6.9. Hitachi
      1. 6.9.1. Company Overview
      2. 6.9.2. Product/Service Portfolio
      3. 6.9.3. Hitachi Sales, Revenue, and Gross Margin
      4. 6.9.4. Hitachi Revenue and Growth Rate
      5. 6.9.5. Hitachi Market Share
      6. 6.9.6. Recent Initiatives, Funding/VC Activities, and Technological Innovations
    10. 6.10. Honeywell
      1. 6.10.1. Company Overview
      2. 6.10.2. Product/Service Portfolio
      3. 6.10.3. Honeywell Sales, Revenue, and Gross Margin
      4. 6.10.4. Honeywell Revenue and Growth Rate
      5. 6.10.5. Honeywell Market Share
      6. 6.10.6. Recent Initiatives, Funding/VC Activities, and Technological Innovations
    11. 6.11. Huawei
      1. 6.11.1. Company Overview
      2. 6.11.2. Product/Service Portfolio
      3. 6.11.3. Huawei Sales, Revenue, and Gross Margin
      4. 6.11.4. Huawei Revenue and Growth Rate
      5. 6.11.5. Huawei Market Share
      6. 6.11.6. Recent Initiatives, Funding/VC Activities, and Technological Innovations
    12. 6.12. IBM
      1. 6.12.1. Company Overview
      2. 6.12.2. Product/Service Portfolio
      3. 6.12.3. IBM Sales, Revenue, and Gross Margin
      4. 6.12.4. IBM Revenue and Growth Rate
      5. 6.12.5. IBM Market Share
      6. 6.12.6. Recent Initiatives, Funding/VC Activities, and Technological Innovations
    13. 6.13. Igor
      1. 6.13.1. Company Overview
      2. 6.13.2. Product/Service Portfolio
      3. 6.13.3. Igor Sales, Revenue, and Gross Margin
      4. 6.13.4. Igor Revenue and Growth Rate
      5. 6.13.5. Igor Market Share
      6. 6.13.6. Recent Initiatives, Funding/VC Activities, and Technological Innovations
    14. 6.14. Intel
      1. 6.14.1. Company Overview
      2. 6.14.2. Product/Service Portfolio
      3. 6.14.3. Intel Sales, Revenue, and Gross Margin
      4. 6.14.4. Intel Revenue and Growth Rate
      5. 6.14.5. Intel Market Share
      6. 6.14.6. Recent Initiatives, Funding/VC Activities, and Technological Innovations
    15. 6.15. Johnson Controls
      1. 6.15.1. Company Overview
      2. 6.15.2. Product/Service Portfolio
      3. 6.15.3. Johnson Controls Sales, Revenue, and Gross Margin
      4. 6.15.4. Johnson Controls Revenue and Growth Rate
      5. 6.15.5. Johnson Controls Market Share
      6. 6.15.6. Recent Initiatives, Funding/VC Activities, and Technological Innovations
    16. 6.16. KMC Controls
      1. 6.16.1. Company Overview
      2. 6.16.2. Product/Service Portfolio
      3. 6.16.3. KMC Controls Sales, Revenue, and Gross Margin
      4. 6.16.4. KMC Controls Revenue and Growth Rate
      5. 6.16.5. KMC Controls Market Share
      6. 6.16.6. Recent Initiatives, Funding/VC Activities, and Technological Innovations
    17. 6.17. Legrand
      1. 6.17.1. Company Overview
      2. 6.17.2. Product/Service Portfolio
      3. 6.17.3. Legrand Sales, Revenue, and Gross Margin
      4. 6.17.4. Legrand Revenue and Growth Rate
      5. 6.17.5. Legrand Market Share
      6. 6.17.6. Recent Initiatives, Funding/VC Activities, and Technological Innovations
    18. 6.18. Mode:GreenPTC
      1. 6.18.1. Company Overview
      2. 6.18.2. Product/Service Portfolio
      3. 6.18.3. Mode:GreenPTC Sales, Revenue, and Gross Margin
      4. 6.18.4. Mode:GreenPTC Revenue and Growth Rate
      5. 6.18.5. Mode:GreenPTC Market Share
      6. 6.18.6. Recent Initiatives, Funding/VC Activities, and Technological Innovations
    19. 6.19. Schneider Electric
      1. 6.19.1. Company Overview
      2. 6.19.2. Product/Service Portfolio
      3. 6.19.3. Schneider Electric Sales, Revenue, and Gross Margin
      4. 6.19.4. Schneider Electric Revenue and Growth Rate
      5. 6.19.5. Schneider Electric Market Share
      6. 6.19.6. Recent Initiatives, Funding/VC Activities, and Technological Innovations
    20. 6.20. Siemens
      1. 6.20.1. Company Overview
      2. 6.20.2. Product/Service Portfolio
      3. 6.20.3. Siemens Sales, Revenue, and Gross Margin
      4. 6.20.4. Siemens Revenue and Growth Rate
      5. 6.20.5. Siemens Market Share
      6. 6.20.6. Recent Initiatives, Funding/VC Activities, and Technological Innovations
    21. 6.21. Softdel
      1. 6.21.1. Company Overview
      2. 6.21.2. Product/Service Portfolio
      3. 6.21.3. Softdel Sales, Revenue, and Gross Margin
      4. 6.21.4. Softdel Revenue and Growth Rate
      5. 6.21.5. Softdel Market Share
      6. 6.21.6. Recent Initiatives, Funding/VC Activities, and Technological Innovations
    22. 6.22. Spaceti
      1. 6.22.1. Company Overview
      2. 6.22.2. Product/Service Portfolio
      3. 6.22.3. Spaceti Sales, Revenue, and Gross Margin
      4. 6.22.4. Spaceti Revenue and Growth Rate
      5. 6.22.5. Spaceti Market Share
      6. 6.22.6. Recent Initiatives, Funding/VC Activities, and Technological Innovations
    23. 6.23. Telit
      1. 6.23.1. Company Overview
      2. 6.23.2. Product/Service Portfolio
      3. 6.23.3. Telit Sales, Revenue, and Gross Margin
      4. 6.23.4. Telit Revenue and Growth Rate
      5. 6.23.5. Telit Market Share
      6. 6.23.6. Recent Initiatives, Funding/VC Activities, and Technological Innovations
    24. 6.24. Verdigris Technologies
      1. 6.24.1. Company Overview
      2. 6.24.2. Product/Service Portfolio
      3. 6.24.3. Verdigris Technologies Sales, Revenue, and Gross Margin
      4. 6.24.4. Verdigris Technologies Revenue and Growth Rate
      5. 6.24.5. Verdigris Technologies Market Share
      6. 6.24.6. Recent Initiatives, Funding/VC Activities, and Technological Innovations
    25. 6.25. Emerson Electric Co. Ltd
      1. 6.25.1. Company Overview
      2. 6.25.2. Product/Service Portfolio
      3. 6.25.3. Emerson Electric Co. Ltd Sales, Revenue, and Gross Margin
      4. 6.25.4. Emerson Electric Co. Ltd Revenue and Growth Rate
      5. 6.25.5. Emerson Electric Co. Ltd Market Share
      6. 6.25.6. Recent Initiatives, Funding/VC Activities, and Technological Innovations
  7. Chapter 7 Smart Buildings — Industry Analysis
    1. 7.1. Introduction and Taxonomy
    2. 7.2. Smart Buildings Market – Key Trends
      1. 7.2.1. Market Drivers
      2. 7.2.2. Market Restraints
      3. 7.2.3. Market Opportunities
    3. 7.3. Value Chain Analysis
    4. 7.4. Key Mandates and Regulations
    5. 7.5. Technology Roadmap and Timeline
    6. 7.6. Smart Buildings Market – Attractiveness Analysis
      1. 7.6.1. By Product
      2. 7.6.2. By Building Type
      3. 7.6.3. By Region
  8. Chapter 8 Industrial Chain, Sourcing Strategy, and Downstream Buyers
    1. 8.1. Smart Buildings Industrial Chain Analysis
    2. 8.2. Downstream Buyers
    3. 8.3. Distributors/Traders List
  9. Chapter 9 Marketing Strategy Analysis
    1. 9.1. Marketing Channel
    2. 9.2. Direct Marketing
    3. 9.3. Indirect Marketing
    4. 9.4. Marketing Channel Development Trends
    5. 9.5. Economic/Political Environmental Change
  10. Chapter 10 Report Conclusion & Key Insights
    1. 10.1. Key Insights from Primary Interviews & Surveys Respondents
    2. 10.2. Key Takeaways from Analysts, Consultants, and Industry Leaders
  11. Chapter 11 Research Approach & Methodology
    1. 11.1. Report Description
    2. 11.2. Research Scope
    3. 11.3. Research Methodology
      1. 11.3.1. Secondary Research
      2. 11.3.2. Primary Research
      3. 11.3.3. Statistical Models
        1. 11.3.3.1. Company Share Analysis Model
        2. 11.3.3.2. Revenue Based Modeling
      4. 11.3.4. Research Limitations

      List of Figures

      Fig.1	Product Picture of Smart Buildings
      Fig.2	Global Smart Buildings Market, 2016 – 2026 (USD Billion)
      Fig.3	Global Smart Buildings Market Absolute Revenue Opportunity, 2016 – 2026 (USD Billion)
      Fig.4	Global Smart Buildings Market Incremental Revenue Opportunity, 2020 – 2026 (USD Billion)
      Fig.5	Global Smart Buildings Market Share, by Product , 2019 & 2026 (USD Billion)
      Fig.6	Global Lighting  Smart Buildings Market, 2016 – 2026 (USD Billion)
      Fig.7	Global Safety & Security Smart Buildings Market, 2016 – 2026 (USD Billion)
      Fig.8	Global Monitoring  Smart Buildings Market, 2016 – 2026 (USD Billion)
      Fig.9	Global Heating, Ventilation & Air Conditioning (HVAC) Smart Buildings Market, 2016 – 2026 (USD Billion)
      Fig.10	Global Energy Management  Smart Buildings Market, 2016 – 2026 (USD Billion)
      Fig.11	Global Emergency Systems Smart Buildings Market, 2016 – 2026 (USD Billion)
      Fig.12	Global Car Parking Management Systems Smart Buildings Market, 2016 – 2026 (USD Billion)
      Fig.13	Global Others Smart Buildings Market, 2016 – 2026 (USD Billion)
      Fig.14	Global Smart Buildings Market Share, by Building Type, 2019 & 2026 (USD Billion)
      Fig.15	Global Residential  Smart Buildings Market, 2016 – 2026 (USD Billion)
      Fig.16	Global Commercial  Smart Buildings Market, 2016 – 2026 (USD Billion)
      Fig.17	Global Industrial Smart Buildings Market, 2016 – 2026 (USD Billion)
      Fig.18	Global Smart Buildings Market Share, by Region, 2019 & 2026 (USD Billion)
      Fig.19	North America Smart Buildings Market, 2016 – 2026 (USD Billion)
      Fig.20	U.S. Smart Buildings Market, 2016 – 2026 (USD Billion)
      Fig.21	Canada Smart Buildings Market, 2016 – 2026 (USD Billion)
      Fig.22	Europe Smart Buildings Market, 2016 – 2026 (USD Billion)
      Fig.23	Germany Smart Buildings Market, 2016 – 2026 (USD Billion)
      Fig.24	France Smart Buildings Market, 2016 – 2026 (USD Billion)
      Fig.25	U.K. Smart Buildings Market, 2016 – 2026 (USD Billion)
      Fig.26	Italy Smart Buildings Market, 2016 – 2026 (USD Billion)
      Fig.27	Spain Smart Buildings Market, 2016 – 2026 (USD Billion)
      Fig.28	Rest of Europe Smart Buildings Market, 2016 – 2026 (USD Billion)
      Fig.29	Asia Pacific Smart Buildings Market, 2016 – 2026 (USD Billion)
      Fig.30	China Smart Buildings Market, 2016 – 2026 (USD Billion)
      Fig.31	Japan Smart Buildings Market, 2016 – 2026 (USD Billion)
      Fig.32	India Smart Buildings Market, 2016 – 2026 (USD Billion)
      Fig.33	South  Korea Smart Buildings Market, 2016 – 2026 (USD Billion)
      Fig.34	South-East Asia Smart Buildings Market, 2016 – 2026 (USD Billion)
      Fig.35	Rest of Asia Pacific Smart Buildings Market, 2016 – 2026 (USD Billion)
      Fig.36	Latin America Smart Buildings Market, 2016 – 2026 (USD Billion)
      Fig.37	Brazil Smart Buildings Market, 2016 – 2026 (USD Billion)
      Fig.38	Mexico Smart Buildings Market, 2016 – 2026 (USD Billion)
      Fig.39	Rest of Latin America Smart Buildings Market, 2016 – 2026 (USD Billion)
      Fig.40	The Middle-East and Africa Smart Buildings Market, 2016 – 2026 (USD Billion)
      Fig.41	GCC Countries Smart Buildings Market, 2016 – 2026 (USD Billion)
      Fig.42	South Africa Smart Buildings Market, 2016 – 2026 (USD Billion)
      Fig.43	Rest of Middle-East Africa Smart Buildings Market, 2016 – 2026 (USD Billion)
      Fig.44	Competitor Market Share – Revenue
      Fig.45	75F Revenue and Growth Rate
      Fig.46	75F Market Share
      Fig.47	ABB Revenue and Growth Rate
      Fig.48	ABB Market Share
      Fig.49	Aquicore Revenue and Growth Rate
      Fig.50	Aquicore Market Share
      Fig.51	Bosch Revenue and Growth Rate
      Fig.52	Bosch Market Share
      Fig.53	BuildingIQ Revenue and Growth Rate
      Fig.54	BuildingIQ Market Share
      Fig.55	Cisco Revenue and Growth Rate
      Fig.56	Cisco Market Share
      Fig.57	CopperTree Analytics Revenue and Growth Rate
      Fig.58	CopperTree Analytics Market Share
      Fig.59	ENTOUCH Revenue and Growth Rate
      Fig.60	ENTOUCH Market Share
      Fig.61	Hitachi Revenue and Growth Rate
      Fig.62	Hitachi Market Share
      Fig.63	Honeywell Revenue and Growth Rate
      Fig.64	Honeywell Market Share
      Fig.65	Huawei Revenue and Growth Rate
      Fig.66	Huawei Market Share
      Fig.67	IBM Revenue and Growth Rate
      Fig.68	IBM Market Share
      Fig.69	Igor Revenue and Growth Rate
      Fig.70	Igor Market Share
      Fig.71	Intel Revenue and Growth Rate
      Fig.72	Intel Market Share
      Fig.73	Johnson Controls Revenue and Growth Rate
      Fig.74	Johnson Controls Market Share
      Fig.75	KMC Controls Revenue and Growth Rate
      Fig.76	KMC Controls Market Share
      Fig.77	Legrand Revenue and Growth Rate
      Fig.78	Legrand Market Share
      Fig.79	Mode:GreenPTC Revenue and Growth Rate
      Fig.80	Mode:GreenPTC Market Share
      Fig.81	Schneider Electric Revenue and Growth Rate
      Fig.82	Schneider Electric Market Share
      Fig.83	Siemens Revenue and Growth Rate
      Fig.84	Siemens Market Share
      Fig.85	Softdel Revenue and Growth Rate
      Fig.86	Softdel Market Share
      Fig.87	Spaceti Revenue and Growth Rate
      Fig.88	Spaceti Market Share
      Fig.89	Telit Revenue and Growth Rate
      Fig.90	Telit Market Share
      Fig.91	Verdigris Technologies Revenue and Growth Rate
      Fig.92	Verdigris Technologies Market Share
      Fig.93	Emerson Electric Co. Ltd Revenue and Growth Rate
      Fig.94	Emerson Electric Co. Ltd Market Share
      Fig.95	Market Dynamics
      Fig.96	Global Smart Buildings – Value Chain Analysis
      Fig.97	Key Mandates and Regulations
      Fig.98	Technology Roadmap and Timeline
      Fig.99	Market Attractiveness Analysis – By Product
      Fig.100	Market Attractiveness Analysis – By Building Type
      Fig.101	Market Attractiveness Analysis – By Region
      Fig.102	Smart Buildings Industrial Chain Analysis
      Fig.103	Market Channels
      Fig.104	Marketing Channel Development Trend
      Fig.105	Growth in World Gross Product, 2008-2018
      

      List of Tables

      Table 1	Global Smart Buildings Market, 2019 & 2026 (USD Billion)
      Table 2	Global Smart Buildings Market, by Product , 2016 – 2026 (USD Billion)
      Table 3	Global Smart Buildings Market, by Building Type, 2016 – 2026 (USD Billion)
      Table 4	Global Smart Buildings Market, by Region, 2016 – 2026 (USD Billion)
      Table 5	North America Smart Buildings Market, by Country, 2016 – 2026 (USD Billion)
      Table 6	North America Smart Buildings Market, by Product , 2016 – 2026 (USD Billion)
      Table 7	North America Smart Buildings Market, by Building Type, 2016 – 2026 (USD Billion)
      Table 8	Europe Smart Buildings Market, by Country, 2016 – 2026 (USD Billion)
      Table 9	Europe Smart Buildings Market, by Product , 2016 – 2026 (USD Billion)
      Table 10 Europe Smart Buildings Market, by Building Type, 2016 – 2026 (USD Billion)
      Table 11 Asia Pacific Smart Buildings Market, by Country, 2016 – 2026 (USD Billion)
      Table 12 Asia Pacific Smart Buildings Market, by Product , 2016 – 2026 (USD Billion)
      Table 13 Asia Pacific Smart Buildings Market, by Building Type, 2016 – 2026 (USD Billion)
      Table 14 Latin America Smart Buildings Market, by Country, 2016 – 2026 (USD Billion)
      Table 15 Latin America Smart Buildings Market, by Product , 2016 – 2026 (USD Billion)
      Table 16 Latin America Smart Buildings Market, by Building Type, 2016 – 2026 (USD Billion)
      Table 17 The Middle-East and Africa Smart Buildings Market, by Country, 2016 – 2026 (USD Billion)
      Table 18 The Middle-East and Africa Smart Buildings Market, by Product , 2016 – 2026 (USD Billion)
      Table 19 The Middle-East and Africa Smart Buildings Market, by Building Type, 2016 – 2026 (USD Billion)
      Table 20 Global Smart Buildings Market - Company Revenue Analysis, 2016 – 2019 (USD Billion)
      Table 21 Global Smart Buildings Market - Company Revenue Share Analysis, 2016 – 2019 (%)
      Table 22 Acquisitions and Mergers
      Table 23 Market Drivers – Impact Analysis
      Table 24 Market Restraints
      Table 25 Market Opportunities
      Table 26 Major Buyers of Smart Buildings
      Table 27 Distributors/Traders of Smart Buildings by Region
      

Industry Major Market Players

  • 75F
  • ABB
  • Aquicore
  • Bosch
  • BuildingIQ
  • Cisco
  • CopperTree Analytics
  • ENTOUCH
  • Hitachi
  • Honeywell
  • Huawei
  • IBM
  • Igor
  • Intel
  • Johnson Controls
  • KMC Controls
  • Legrand
  • Mode:Green
  • PTC
  • Schneider Electric
  • Siemens
  • Softdel
  • Spaceti
  • Telit
  • Verdigris Technologies
  • Emerson Electric Co. Ltd.