Search Market Research Report

Discover Our Latest Reports
Discover Our Featured Reports
Discover Top Selling Reports

Smart Building Market Size, Share Global Analysis Report, 2026-2034

report img

Smart Building Market Size, Share, Growth Analysis Report By Component (Hardware, Software, Services, and Others), By Application (Energy Management, Security & Access Control, Infrastructure Management, and Others), By End-User (Commercial, Residential, Industrial, and Others), and By Region - Global Industry Insights, Overview, Comprehensive Analysis, Trends, Statistical Research, Market Intelligence, Historical Data and Forecast 2026-2034

Industry Insights

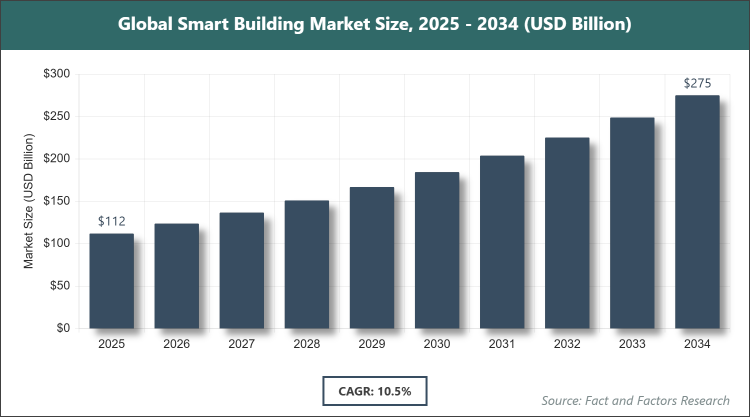
[241 + Pages Report] According to Facts & Factors, the global Smart Building market size was estimated at USD 112 billion in 2025 and is expected to reach USD 275 billion by the end of 2034. The Smart Building industry is anticipated to grow by a CAGR of 10.5% between 2026 and 2034. The Smart Building Market is driven by rapid integration of IoT, AI, and 5G technologies, enabling real-time energy optimization, enhanced security, and superior occupant comfort across commercial and residential structures.

Global Smart Building Market Size

To know more about this report | Request Free Sample Copy

logoMarket Overview

The Smart Building market comprises integrated digital systems and connected technologies that transform traditional structures into intelligent, responsive environments capable of automatically monitoring, controlling, and optimizing building operations, including energy consumption, HVAC performance, lighting, security, and occupant experience. These solutions combine hardware sensors and actuators, advanced software platforms with AI-driven analytics, and professional services to create self-managing facilities that reduce operational costs, minimize environmental impact, and enhance safety and comfort. The market spans new construction and retrofit projects across commercial offices, residential complexes, industrial facilities, and public infrastructure, leveraging cloud computing, edge processing, and interoperable protocols to deliver data-driven insights and automated decision-making for facility managers and building owners.

logoKey Insights

  • As per the analysis shared by our research analyst, the Smart Building market is estimated to grow annually at a CAGR of around 10.5% over the forecast period (2026-2034).
  • In terms of revenue, the Smart Building market size was valued at around USD 112 billion in 2025 and is projected to reach USD 275 billion by 2034.
  • The Smart Building Market is driven by surging adoption of IoT, AI, and energy-efficiency mandates.
  • Based on the Component, the Hardware segment dominated the market in 2025 with a share of 48% due to widespread deployment of sensors, controllers, actuators, and connectivity devices required for foundational system integration.
  • Based on the Application, the Energy Management segment dominated the market in 2025 with a share of 44%, owing to escalating focus on reducing carbon footprints and operational costs through intelligent HVAC, lighting, and power optimization.
  • Based on the End-User, the Commercial segment dominated the market in 2025 with a share of 59% because corporate offices, retail spaces, and hospitality properties prioritize smart solutions for tenant retention, cost savings, and ESG compliance.
  • North America dominated the global Smart Building market in 2025 with a share of 37% attributed to early technology adoption, stringent energy codes, presence of leading solution providers, and strong investment in smart city initiatives.

logoGrowth Drivers

  • Rising Focus on Energy Efficiency and Sustainability

Global mandates for net-zero buildings and corporate ESG reporting have accelerated the deployment of smart systems that deliver real-time energy analytics and automated demand response, significantly lowering utility expenses.

Rapid urbanization and the need for healthier indoor environments have driven demand for integrated platforms that monitor air quality, occupancy, and comfort levels while optimizing resource usage.

logoRestraints

  • High Initial Investment and Integration Complexity

Substantial upfront capital required for sensors, networking infrastructure, and software platforms deters smaller property owners and delays retrofit projects in cost-sensitive markets.

Legacy building systems often lack interoperability with modern IoT protocols, leading to complex and expensive integration challenges that extend project timelines and increase risk.

logoOpportunities

  • Emergence of AI-Driven Predictive Maintenance and 5G Connectivity

Advancements in artificial intelligence and edge computing enable predictive analytics that reduce downtime and maintenance costs, while 5G networks support ultra-low latency control of thousands of connected devices.

Government incentives for smart city development and green building certifications are creating new revenue streams for integrated solutions in both new construction and large-scale retrofits.

logoChallenges

  • Cybersecurity Vulnerabilities and Data Privacy Concerns

Increased connectivity exposes buildings to cyber threats that can disrupt critical operations and compromise occupant data, requiring continuous investment in robust security frameworks.

Lack of standardized protocols across vendors leads to fragmented ecosystems and raises long-term maintenance costs while slowing widespread adoption among risk-averse facility managers.

logoReport Scope

Report Attribute

Details

Market Size 2025

USD 112 Billion

Projected Market Size in 2034

USD 275 Billion

CAGR Growth Rate

10.5% CAGR

Base Year

2025

Forecast Years

2026-2034

Key Market Players

Honeywell International Inc., Siemens AG, Johnson Controls International plc, Schneider Electric SE, ABB Ltd., Cisco Systems, Inc., IBM Corporation, Huawei Technologies Co., Ltd., Legrand SA, Crestron Electronics, Inc., and Others.

Key Segment

By Component, By Application, By End-User, and By Region

Major Regions Covered

North America, Europe, Asia Pacific, Latin America, and the Middle East & Africa

Purchase Options

Request customized purchase options to meet your research needs. Explore purchase options

logoMarket Segmentation

The Smart Building market is segmented by component, application, end-user, and region.

Based on Component Segment, the Smart Building market is divided into hardware, software, services, and others. The most dominant segment is Hardware, followed by Software. Hardware dominates because sensors, controllers, actuators, gateways, and networking equipment form the essential physical foundation for any smart building deployment, enabling data collection and real-time control that drive immediate operational improvements and create the infrastructure backbone necessary for higher-value software analytics and ongoing services to scale efficiently across projects.

Based on Application Segment, the Smart Building market is divided into energy management, security & access control, infrastructure management, and others. The most dominant segment is Energy Management, followed by Security & Access Control. Energy Management leads the segment because rising electricity costs, carbon reduction targets, and regulatory incentives have made intelligent HVAC, lighting, and power optimization the highest-priority application for both new builds and retrofits, generating the largest ROI and encouraging continuous innovation in AI-based demand response and predictive energy modeling that accelerates overall market penetration.

Based on the End-User Segment, the Smart Building market is divided into commercial, residential, industrial, and others. The most dominant segment is Commercial, followed by Industrial. Commercial dominates because office towers, retail complexes, hotels, and educational campuses require sophisticated, multi-tenant systems that deliver measurable savings, enhanced user experience, and ESG compliance at scale, driving the highest procurement volumes and stimulating development of modular, cloud-based platforms that lower barriers for widespread commercial adoption worldwide.

logoRecent Developments

  • In February 2025, Honeywell launched its new AI-powered Forge platform for predictive building optimization, securing major contracts with Fortune 500 corporate campuses across North America and Europe.
  • In May 2025, Siemens introduced an integrated 5G-ready building management system with edge computing capabilities at its global headquarters, demonstrating 28% energy savings in pilot deployments.
  • In August 2025, Johnson Controls partnered with Microsoft to embed Azure AI services into its OpenBlue platform, enabling real-time occupant experience personalization for large commercial portfolios.
  • In October 2025, Schneider Electric expanded its EcoStruxure Building Advisor with enhanced carbon tracking and net-zero compliance tools, targeting government and institutional projects in Asia Pacific.
  • In December 2025, Cisco announced the commercial availability of its IoT-enabled smart building fabric solution with zero-trust cybersecurity architecture for high-security industrial and healthcare facilities.

logoRegional Analysis

  • North America to dominate the global market

North America leads the Smart Building market through early and widespread adoption of advanced IoT and AI technologies, stringent energy efficiency standards such as LEED and ENERGY STAR, and substantial investments by both private developers and public authorities in smart city infrastructure. The region benefits from the presence of global technology leaders, a mature venture capital ecosystem for proptech startups, and high awareness among building owners regarding long-term ROI from intelligent systems. Strong collaboration between solution providers, system integrators, and end users accelerates pilot-to-scale deployments across commercial and institutional projects. The United States dominates within North America owing to its massive commercial real estate portfolio, federal incentives for green buildings, advanced 5G rollout, and concentration of innovative proptech companies that continuously push the boundaries of occupant-centric and energy-positive building design.

Europe maintains robust growth in the Smart Building market, supported by ambitious EU Green Deal targets, mandatory energy performance directives, and increasing corporate focus on ESG reporting that rewards smart technology deployment. The region excels in retrofitting historic buildings with non-invasive sensors and benefits from collaborative research programs between universities and industry. Germany dominates within Europe through its leadership in industrial automation and building technologies, stringent energy codes, and a central role in exporting high-performance smart solutions to neighboring countries while maintaining a strong domestic market for sustainable office and residential developments.

Asia Pacific is experiencing the fastest expansion in the Smart Building market, fueled by explosive urbanization, massive smart city initiatives in China, India, and Southeast Asia, and rising middle-class demand for premium, tech-enabled living and working spaces. Government mandates for green buildings and heavy infrastructure investments create enormous opportunities for both new construction and large-scale retrofits. China dominates within Asia Pacific with its unparalleled scale of urban development, national smart city programs, and domestic manufacturing ecosystem that supplies cost-effective hardware and software solutions to both local mega-projects and international markets.

Latin America shows accelerating adoption in the Smart Building market, driven by improving economic conditions, growing awareness of energy costs, and increasing foreign investment in modern commercial and residential real estate. Smart city pilots in major metropolitan areas are demonstrating measurable benefits and encouraging broader rollout. Brazil dominates the region through its large commercial real estate market, expanding middle class, and progressive sustainability policies that favor intelligent building technologies in new developments and public infrastructure projects.

The Middle East & Africa region demonstrates strong potential in the Smart Building market, supported by ambitious Vision 2030-style diversification programs, massive tourism and commercial real estate investments, and the need for efficient resource management in extreme climates. Modern megaprojects in Gulf countries are incorporating smart technologies from the design stage. The United Arab Emirates leads within the region through its world-class smart city developments in Dubai and Abu Dhabi, government-backed innovation hubs, and strategic focus on sustainable and intelligent infrastructure that serves as a showcase for advanced building technologies across the broader Middle East and Africa.

logoCompetitive Analysis

The global Smart Building market is dominated by players:

  • Honeywell International Inc.
  • Siemens AG
  • Johnson Controls International plc
  • Schneider Electric SE
  • ABB Ltd.
  • Cisco Systems, Inc.
  • IBM Corporation
  • Huawei Technologies Co., Ltd.
  • Legrand SA
  • Crestron Electronics, Inc.

The global Smart Building market is segmented as follows:

logoBy Component

  • Hardware
  • Software
  • Services

logoBy Application

  • Energy Management
  • Security & Access Control
  • Infrastructure Management
  • Others

logoBy End-User

  • Commercial
  • Residential
  • Industrial

logoBy Region

  • North America
    • The U.S.
    • Canada
    • Mexico
  • Europe
    • France
    • The UK
    • Spain
    • Germany
    • Italy
    • Rest of Europe
  • Asia Pacific
    • China
    • Japan
    • India
    • Australia
    • Southeast Asia
    • Rest of Asia Pacific
  • The Middle East & Africa
    • Saudi Arabia
    • UAE
    • Egypt
    • Kuwait
    • South Africa
    • Rest of the Middle East & Africa
  • Latin America
    • Brazil
    • Argentina
    • Rest of Latin America

Table of Content

  • Chapter 1. Preface
    • 1.1 Report Description and Scope
    • 1.2 Research Scope
    • 1.3 Research Methodology
      • 1.3.1 Market Research Type
      • 1.3.2 Market Research Methodology
  • Chapter 2. Executive Summary
    • 2.1 Global Smart Building Market, (2026 - 2034) (USD Billion)
    • 2.2 Global Smart Building Market : Snapshot
  • Chapter 3. Global Smart Building Market - Industry Analysis
    • 3.1 Smart Building Market: Market Dynamics
    • 3.2 Market Drivers
      • 3.2.1 Rising Focus on Energy Efficiency and Sustainability
    • 3.3 Market Restraints
      • 3.3.1. High Initial Investment and Integration Complexity
    • 3.4 Market Opportunities
      • 3.4.1. Emergence of AI-Driven Predictive Maintenance and 5G Connectivity
    • 3.5 Market Challenges
      • 3.5.1. Emergence of AI-Driven Predictive Maintenance and 5G Connectivity
    • 3.6 Porter’s Five Forces Analysis
    • 3.7 Market Attractiveness Analysis
      • 3.7.1 Market Attractiveness Analysis By Component
      • 3.7.2 Market Attractiveness Analysis By Application
      • 3.7.3 Market Attractiveness Analysis By End-User
  • Chapter 4. Global Smart Building Market- Competitive Landscape
    • 4.1 Company Market Share Analysis
      • 4.1.1 Global Smart Building Market: Company Market Share, 2025
    • 4.2 Strategic Development
      • 4.2.1 Acquisitions & Mergers
      • 4.2.2 New Product Launches
      • 4.2.3 Agreements, Partnerships, Collaborations, and Joint Ventures
      • 4.2.4 Research and Development and Regional Expansion
    • 4.3 Price Trend Analysis
  • Chapter 5. Global Smart Building Market - By Component Segment Analysis
    • 5.1 Global Smart Building Market Overview: By Component
      • 5.1.1 Global Smart Building Market Share, By Component, 2025 and 2034
    • 5.2 Hardware
      • 5.2.1 Global Smart Building Market by Hardware, 2026 - 2034 (USD Billion)
    • 5.3 Software
      • 5.3.1 Global Smart Building Market by Software, 2026 - 2034 (USD Billion)
    • 5.4 Services
      • 5.4.1 Global Smart Building Market by Services, 2026 - 2034 (USD Billion)
  • Chapter 6. Global Smart Building Market - By Application Segment Analysis
    • 6.1 Global Smart Building Market Overview: By Application
      • 6.1.1 Global Smart Building Market Share, By Application, 2025 and 2034
    • 6.2 Energy Management
      • 6.2.1 Global Smart Building Market by Energy Management, 2026 - 2034 (USD Billion)
    • 6.3 Security & Access Control
      • 6.3.1 Global Smart Building Market by Security & Access Control, 2026 - 2034 (USD Billion)
    • 6.4 Infrastructure Management
      • 6.4.1 Global Smart Building Market by Infrastructure Management, 2026 - 2034 (USD Billion)
    • 6.5 Others
      • 6.5.1 Global Smart Building Market by Others, 2026 - 2034 (USD Billion)
  • Chapter 7. Global Smart Building Market - By End-User Segment Analysis
    • 7.1 Global Smart Building Market Overview: By End-User
      • 7.1.1 Global Smart Building Market Share, By End-User, 2025 and 2034
    • 7.2 Commercial
      • 7.2.1 Global Smart Building Market by Commercial, 2026 - 2034 (USD Billion)
    • 7.3 Residential
      • 7.3.1 Global Smart Building Market by Residential, 2026 - 2034 (USD Billion)
    • 7.4 Industrial
      • 7.4.1 Global Smart Building Market by Industrial, 2026 - 2034 (USD Billion)
  • Chapter 8. Smart Building Market - Regional Analysis
    • 8.1 Global Smart Building Market Regional Overview
    • 8.2 Global Smart Building Market Share, by Region, 2025 & 2034 (USD Billion)
    • 8.3. North America
      • 8.3.1 North America Smart Building Market, 2026 - 2034 (USD Billion)
        • 8.3.1.1 North America Smart Building Market, by Country, 2026 - 2034 (USD Billion)
    • 8.4 North America Smart Building Market, by Component, 2026 - 2034
      • 8.4.1 North America Smart Building Market, by Component, 2026 - 2034 (USD Billion)
    • 8.5 North America Smart Building Market, by Application, 2026 - 2034
      • 8.5.1 North America Smart Building Market, by Application, 2026 - 2034 (USD Billion)
    • 8.6 North America Smart Building Market, by End-User, 2026 - 2034
      • 8.6.1 North America Smart Building Market, by End-User, 2026 - 2034 (USD Billion)
    • 8.7. Europe
      • 8.7.1 Europe Smart Building Market, 2026 - 2034 (USD Billion)
        • 8.7.1.1 Europe Smart Building Market, by Country, 2026 - 2034 (USD Billion)
    • 8.8 Europe Smart Building Market, by Component, 2026 - 2034
      • 8.8.1 Europe Smart Building Market, by Component, 2026 - 2034 (USD Billion)
    • 8.9 Europe Smart Building Market, by Application, 2026 - 2034
      • 8.9.1 Europe Smart Building Market, by Application, 2026 - 2034 (USD Billion)
    • 8.10 Europe Smart Building Market, by End-User, 2026 - 2034
      • 8.10.1 Europe Smart Building Market, by End-User, 2026 - 2034 (USD Billion)
    • 8.11. Asia Pacific
      • 8.11.1 Asia Pacific Smart Building Market, 2026 - 2034 (USD Billion)
        • 8.11.1.1 Asia Pacific Smart Building Market, by Country, 2026 - 2034 (USD Billion)
    • 8.12 Asia Pacific Smart Building Market, by Component, 2026 - 2034
      • 8.12.1 Asia Pacific Smart Building Market, by Component, 2026 - 2034 (USD Billion)
    • 8.13 Asia Pacific Smart Building Market, by Application, 2026 - 2034
      • 8.13.1 Asia Pacific Smart Building Market, by Application, 2026 - 2034 (USD Billion)
    • 8.14 Asia Pacific Smart Building Market, by End-User, 2026 - 2034
      • 8.14.1 Asia Pacific Smart Building Market, by End-User, 2026 - 2034 (USD Billion)
    • 8.15. Latin America
      • 8.15.1 Latin America Smart Building Market, 2026 - 2034 (USD Billion)
        • 8.15.1.1 Latin America Smart Building Market, by Country, 2026 - 2034 (USD Billion)
    • 8.16 Latin America Smart Building Market, by Component, 2026 - 2034
      • 8.16.1 Latin America Smart Building Market, by Component, 2026 - 2034 (USD Billion)
    • 8.17 Latin America Smart Building Market, by Application, 2026 - 2034
      • 8.17.1 Latin America Smart Building Market, by Application, 2026 - 2034 (USD Billion)
    • 8.18 Latin America Smart Building Market, by End-User, 2026 - 2034
      • 8.18.1 Latin America Smart Building Market, by End-User, 2026 - 2034 (USD Billion)
    • 8.19. The Middle-East and Africa
      • 8.19.1 The Middle-East and Africa Smart Building Market, 2026 - 2034 (USD Billion)
        • 8.19.1.1 The Middle-East and Africa Smart Building Market, by Country, 2026 - 2034 (USD Billion)
    • 8.20 The Middle-East and Africa Smart Building Market, by Component, 2026 - 2034
      • 8.20.1 The Middle-East and Africa Smart Building Market, by Component, 2026 - 2034 (USD Billion)
    • 8.21 The Middle-East and Africa Smart Building Market, by Application, 2026 - 2034
      • 8.21.1 The Middle-East and Africa Smart Building Market, by Application, 2026 - 2034 (USD Billion)
    • 8.22 The Middle-East and Africa Smart Building Market, by End-User, 2026 - 2034
      • 8.22.1 The Middle-East and Africa Smart Building Market, by End-User, 2026 - 2034 (USD Billion)
  • Chapter 9. Company Profiles
    • 9.1 Honeywell International Inc.
      • 9.1.1 Overview
      • 9.1.2 Financials
      • 9.1.3 Product Portfolio
      • 9.1.4 Business Strategy
      • 9.1.5 Recent Developments
    • 9.2 Siemens AG
      • 9.2.1 Overview
      • 9.2.2 Financials
      • 9.2.3 Product Portfolio
      • 9.2.4 Business Strategy
      • 9.2.5 Recent Developments
    • 9.3 Johnson Controls International plc
      • 9.3.1 Overview
      • 9.3.2 Financials
      • 9.3.3 Product Portfolio
      • 9.3.4 Business Strategy
      • 9.3.5 Recent Developments
    • 9.4 Schneider Electric SE
      • 9.4.1 Overview
      • 9.4.2 Financials
      • 9.4.3 Product Portfolio
      • 9.4.4 Business Strategy
      • 9.4.5 Recent Developments
    • 9.5 ABB Ltd.
      • 9.5.1 Overview
      • 9.5.2 Financials
      • 9.5.3 Product Portfolio
      • 9.5.4 Business Strategy
      • 9.5.5 Recent Developments
    • 9.6 Cisco Systems
      • 9.6.1 Overview
      • 9.6.2 Financials
      • 9.6.3 Product Portfolio
      • 9.6.4 Business Strategy
      • 9.6.5 Recent Developments
    • 9.7 Inc.
      • 9.7.1 Overview
      • 9.7.2 Financials
      • 9.7.3 Product Portfolio
      • 9.7.4 Business Strategy
      • 9.7.5 Recent Developments
    • 9.8 IBM Corporation
      • 9.8.1 Overview
      • 9.8.2 Financials
      • 9.8.3 Product Portfolio
      • 9.8.4 Business Strategy
      • 9.8.5 Recent Developments
    • 9.9 Huawei Technologies Co.
      • 9.9.1 Overview
      • 9.9.2 Financials
      • 9.9.3 Product Portfolio
      • 9.9.4 Business Strategy
      • 9.9.5 Recent Developments
    • 9.10 Ltd.
      • 9.10.1 Overview
      • 9.10.2 Financials
      • 9.10.3 Product Portfolio
      • 9.10.4 Business Strategy
      • 9.10.5 Recent Developments
    • 9.11 Legrand SA
      • 9.11.1 Overview
      • 9.11.2 Financials
      • 9.11.3 Product Portfolio
      • 9.11.4 Business Strategy
      • 9.11.5 Recent Developments
    • 9.12 Crestron Electronics
      • 9.12.1 Overview
      • 9.12.2 Financials
      • 9.12.3 Product Portfolio
      • 9.12.4 Business Strategy
      • 9.12.5 Recent Developments
    • 9.13 Inc.
      • 9.13.1 Overview
      • 9.13.2 Financials
      • 9.13.3 Product Portfolio
      • 9.13.4 Business Strategy
      • 9.13.5 Recent Developments

List of Figures

  • 1. Market Research Type
  • 2. Market Research Methodology
  • 3. Global Smart Building Market, 2026 - 2034 (USD Billion)
  • 4. Porter’s Five Forces Analysis
  • 5. Global Smart Building Market Attractiveness, By Component
  • 6. Global Smart Building Market Attractiveness, By Application
  • 7. Global Smart Building Market Attractiveness, By End-User
  • 8. Global Smart Building Market Share by Component, 2026 and 2034 (USD Billion)
  • 9. Global Smart Building Market by Hardware, 2026 - 2034 (USD Billion)
  • 10. Global Smart Building Market by Software, 2026 - 2034 (USD Billion)
  • 11. Global Smart Building Market by Services, 2026 - 2034 (USD Billion)
  • 12. Global Smart Building Market Share by Application, 2026 and 2034 (USD Billion)
  • 13. Global Smart Building Market by Energy Management, 2026 - 2034 (USD Billion)
  • 14. Global Smart Building Market by Security & Access Control, 2026 - 2034 (USD Billion)
  • 15. Global Smart Building Market by Infrastructure Management, 2026 - 2034 (USD Billion)
  • 16. Global Smart Building Market by Others, 2026 - 2034 (USD Billion)
  • 17. Global Smart Building Market Share by End-User, 2026 and 2034 (USD Billion)
  • 18. Global Smart Building Market by Commercial, 2026 - 2034 (USD Billion)
  • 19. Global Smart Building Market by Residential, 2026 - 2034 (USD Billion)
  • 20. Global Smart Building Market by Industrial, 2026 - 2034 (USD Billion)
  • 21. Global Smart Building Market Share, by Region, 2026 and 2034
  • 22. North America Smart Building Market, 2026 - 2034 (USD Billion)
  • 23. Europe Smart Building Market, 2026 - 2034 (USD Billion)
  • 24. Asia Pacific Smart Building Market, 2026 - 2034 (USD Billion)
  • 25. Latin America Smart Building Market, 2026 - 2034 (USD Billion)
  • 26. The Middle-East and Africa Smart Building Market, 2026 - 2034 (USD Billion)

List of Tables

  • 1. Global Smart Building Market: Snapshot
  • 2. Drivers of the Smart Building Market: Impact Analysis
  • 3. North America Smart Building Market Revenue, By Component, 2026 - 2034 (USD Billion)
  • 4. North America Smart Building Market Revenue, By Application, 2026 - 2034 (USD Billion)
  • 5. North America Smart Building Market Revenue, By End-User, 2026 - 2034 (USD Billion)
  • 6. U.S. Smart Building Market Revenue, By Component, 2026 - 2034 (USD Billion)
  • 7. U.S. Smart Building Market Revenue, By Application, 2026 - 2034 (USD Billion)
  • 8. U.S. Smart Building Market Revenue, By End-User, 2026 - 2034 (USD Billion)
  • 9. Canada Smart Building Market Revenue, By Component, 2026 - 2034 (USD Billion)
  • 10. Canada Smart Building Market Revenue, By Application, 2026 - 2034 (USD Billion)
  • 11. Canada Smart Building Market Revenue, By End-User, 2026 - 2034 (USD Billion)
  • 12. Europe Smart Building Market Revenue, By Component, 2026 - 2034 (USD Billion)
  • 13. Europe Smart Building Market Revenue, By Application, 2026 - 2034 (USD Billion)
  • 14. Europe Smart Building Market Revenue, By End-User, 2026 - 2034 (USD Billion)
  • 15. Germany Smart Building Market Revenue, By Component, 2026 - 2034 (USD Billion)
  • 16. Germany Smart Building Market Revenue, By Application, 2026 - 2034 (USD Billion)
  • 17. Germany Smart Building Market Revenue, By End-User, 2026 - 2034 (USD Billion)
  • 18. France Smart Building Market Revenue, By Component, 2026 - 2034 (USD Billion)
  • 19. France Smart Building Market Revenue, By Application, 2026 - 2034 (USD Billion)
  • 20. France Smart Building Market Revenue, By End-User, 2026 - 2034 (USD Billion)
  • 21. U.K. Smart Building Market Revenue, By Component, 2026 - 2034 (USD Billion)
  • 22. U.K. Smart Building Market Revenue, By Application, 2026 - 2034 (USD Billion)
  • 23. U.K. Smart Building Market Revenue, By End-User, 2026 - 2034 (USD Billion)
  • 24. Italy Smart Building Market Revenue, By Component, 2026 - 2034 (USD Billion)
  • 25. Italy Smart Building Market Revenue, By Application, 2026 - 2034 (USD Billion)
  • 26. Italy Smart Building Market Revenue, By End-User, 2026 - 2034 (USD Billion)
  • 27. Spain Smart Building Market Revenue, By Component, 2026 - 2034 (USD Billion)
  • 28. Spain Smart Building Market Revenue, By Application, 2026 - 2034 (USD Billion)
  • 29. Spain Smart Building Market Revenue, By End-User, 2026 - 2034 (USD Billion)
  • 30. Rest of Europe Smart Building Market Revenue, By Component, 2026 - 2034 (USD Billion)
  • 31. Rest of Europe Smart Building Market Revenue, By Application, 2026 - 2034 (USD Billion)
  • 32. Rest of Europe Smart Building Market Revenue, By End-User, 2026 - 2034 (USD Billion)
  • 33. Asia Pacific Smart Building Market Revenue, By Component, 2026 - 2034 (USD Billion)
  • 34. Asia Pacific Smart Building Market Revenue, By Application, 2026 - 2034 (USD Billion)
  • 35. Asia Pacific Smart Building Market Revenue, By End-User, 2026 - 2034 (USD Billion)
  • 36. China Smart Building Market Revenue, By Component, 2026 - 2034 (USD Billion)
  • 37. China Smart Building Market Revenue, By Application, 2026 - 2034 (USD Billion)
  • 38. China Smart Building Market Revenue, By End-User, 2026 - 2034 (USD Billion)
  • 39. Japan Smart Building Market Revenue, By Component, 2026 - 2034 (USD Billion)
  • 40. Japan Smart Building Market Revenue, By Application, 2026 - 2034 (USD Billion)
  • 41. Japan Smart Building Market Revenue, By End-User, 2026 - 2034 (USD Billion)
  • 42. India Smart Building Market Revenue, By Component, 2026 - 2034 (USD Billion)
  • 43. India Smart Building Market Revenue, By Application, 2026 - 2034 (USD Billion)
  • 44. India Smart Building Market Revenue, By End-User, 2026 - 2034 (USD Billion)
  • 45. South Korea Smart Building Market Revenue, By Component, 2026 - 2034 (USD Billion)
  • 46. South Korea Smart Building Market Revenue, By Application, 2026 - 2034 (USD Billion)
  • 47. South Korea Smart Building Market Revenue, By End-User, 2026 - 2034 (USD Billion)
  • 48. South-East Asia Smart Building Market Revenue, By Component, 2026 - 2034 (USD Billion)
  • 49. South-East Asia Smart Building Market Revenue, By Application, 2026 - 2034 (USD Billion)
  • 50. South-East Asia Smart Building Market Revenue, By End-User, 2026 - 2034 (USD Billion)
  • 51. Rest of Asia Pacific Smart Building Market Revenue, By Component, 2026 - 2034 (USD Billion)
  • 52. Rest of Asia Pacific Smart Building Market Revenue, By Application, 2026 - 2034 (USD Billion)
  • 53. Rest of Asia Pacific Smart Building Market Revenue, By End-User, 2026 - 2034 (USD Billion)
  • 54. Latin America Smart Building Market Revenue, By Component, 2026 - 2034 (USD Billion)
  • 55. Latin America Smart Building Market Revenue, By Application, 2026 - 2034 (USD Billion)
  • 56. Latin America Smart Building Market Revenue, By End-User, 2026 - 2034 (USD Billion)
  • 57. Brazil Smart Building Market Revenue, By Component, 2026 - 2034 (USD Billion)
  • 58. Brazil Smart Building Market Revenue, By Application, 2026 - 2034 (USD Billion)
  • 59. Brazil Smart Building Market Revenue, By End-User, 2026 - 2034 (USD Billion)
  • 60. Mexico Smart Building Market Revenue, By Component, 2026 - 2034 (USD Billion)
  • 61. Mexico Smart Building Market Revenue, By Application, 2026 - 2034 (USD Billion)
  • 62. Mexico Smart Building Market Revenue, By End-User, 2026 - 2034 (USD Billion)
  • 63. Rest of Latin America Smart Building Market Revenue, By Component, 2026 - 2034 (USD Billion)
  • 64. Rest of Latin America Smart Building Market Revenue, By Application, 2026 - 2034 (USD Billion)
  • 65. Rest of Latin America Smart Building Market Revenue, By End-User, 2026 - 2034 (USD Billion)
  • 66. The Middle-East and Africa Smart Building Market Revenue, By Component, 2026 - 2034 (USD Billion)
  • 67. The Middle-East and Africa Smart Building Market Revenue, By Application, 2026 - 2034 (USD Billion)
  • 68. The Middle-East and Africa Smart Building Market Revenue, By End-User, 2026 - 2034 (USD Billion)
  • 69. GCC Countries Smart Building Market Revenue, By Component, 2026 - 2034 (USD Billion)
  • 70. GCC Countries Smart Building Market Revenue, By Application, 2026 - 2034 (USD Billion)
  • 71. GCC Countries Smart Building Market Revenue, By End-User, 2026 - 2034 (USD Billion)
  • 72. South Africa Smart Building Market Revenue, By Component, 2026 - 2034 (USD Billion)
  • 73. South Africa Smart Building Market Revenue, By Application, 2026 - 2034 (USD Billion)
  • 74. South Africa Smart Building Market Revenue, By End-User, 2026 - 2034 (USD Billion)
  • 75. Rest of Middle-East Africa Smart Building Market Revenue, By Component, 2026 - 2034 (USD Billion)
  • 76. Rest of Middle-East Africa Smart Building Market Revenue, By Application, 2026 - 2034 (USD Billion)
  • 77. Rest of Middle-East Africa Smart Building Market Revenue, By End-User, 2026 - 2034 (USD Billion)

Industry Major Market Players

  • Honeywell International Inc.
  • Siemens AG
  • Johnson Controls International plc
  • Schneider Electric SE
  • ABB Ltd.
  • Cisco Systems, Inc.
  • IBM Corporation
  • Huawei Technologies Co., Ltd.
  • Legrand SA
  • Crestron Electronics, Inc.