Search Market Research Report

Discover Our Latest Reports
Discover Our Featured Reports
Discover Top Selling Reports

Skin Antiseptic Products Market Size, Share Global Analysis Report, 2021 – 2026

report img

Skin Antiseptic Products Market By Formulation Type (Alcohol, Chlorhexidine, Iodine, Octenidine, & Others), By Product (Solutions, Swab Sticks, & Wipes), By Application (Surgeries & Injections), And By Regions - Global & Regional Industry Perspective, Comprehensive Analysis, and Forecast 2021 – 2026

Industry Insights

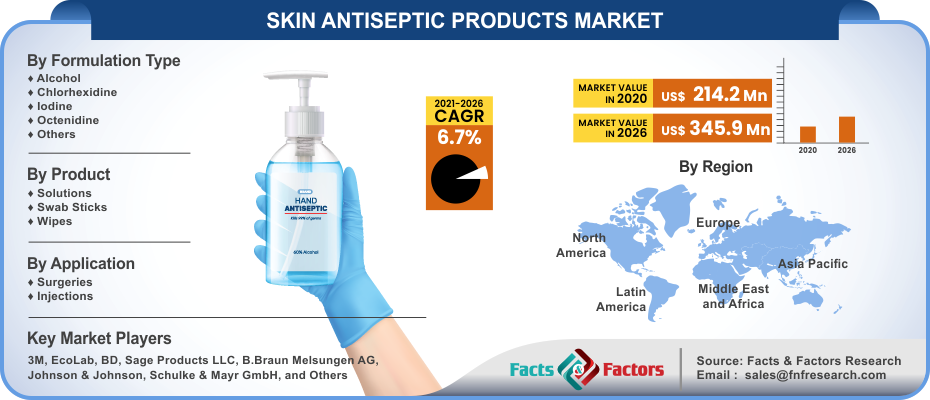
[185+ Pages Report] We at Facts & Factors have recently published a report titled “Global Skin Antiseptic Products Market” that encompasses the spectacle of the market in an analytical and comprehensive manner. In this study, the global skin antiseptic products market is expected to value around USD 345.9 Million in the year 2026 from an initial value of USD 214.2 Million in the year 2020 growing at a CAGR value of 6.7%.

logoMarket Overview

Skin antiseptic products or skin antiseptics are substances that can inhibit or regulate the growth of microorganisms that are present on the skin. These products can be used in hospitals and healthcare-based settings for reducing the risk of infections post-surgery and other medical procedures. While skin antiseptic products have a wide range of applications in both medical and non-medical procedures, they are applied to the skin or mucous-based membranes. Additional applications can include hand washing measures, cleaning skin before operational procedures, and treating minor cuts, burns, and wounds.

logoIndustry Growth Factors

The global skin antiseptic products market is expected to be occupied by contributing factors such as increased product demands due to increasing instances of hospital-acquired based infections (HAIs) coupled with rising usage of surgical units to name a few. Additionally, decreased sanitation-based precautions coupled with risen endoscopic reprocesses will increase the footprint of the global skin antiseptic products market towards a higher boundary. Moreover, the rising demand for skin-based antiseptic products coupled with the integration of the latter towards antiseptic and disinfectant-based usage will boost the growth of the global skin antiseptic products market during the forecast period.

The global skin antiseptic products market will be driven by rising initiatives undertaken by various global bodies coupled with rising healthcare expenditure to name a few. Factors pertaining to increased R&D initiatives coupled with the rising number of collaborations and mergers will fuel the growth of the global skin antiseptic products market toward an increased consumer base. However, volatile pricing of raw materials coupled and disruptions in the supply chain analysis due to the ongoing pandemic will hamper the growth of the global skin antiseptic products market to some extent.

 Skin Antiseptic Products Market

To know more about this report | Request Free Sample Copy

logoSegmentation Analysis

The global skin antiseptic products market can be segmented across formulation type, product, application, and region.

The global skin antiseptic products market is divided into alcohol, chlorhexidine, iodine, octenidine, and others on the basis of formulation type. The segment pertaining to alcohol is expected to witness the largest market share during the advent of the forecast period owing to rising demand for alcohol-based products used in combination with other formulation types coupled with the integration of antiseptic agents such as isopropyl or ethyl proving incredibly effective against microbes to name a few. Based on product, the global skin antiseptic products market is classified into solutions, swab sticks, and wipes. The solutions segment is expected to occupy the largest market share during the advent of the forecast period owing to the increased prevalence of HAIs and SSIs coupled with the increased availability of products to name a few. The global skin antiseptic products market is bifurcated into surgeries and injections on the basis of application. The segment pertaining to injections is expected to witness the largest market share during the advent of the forecast period owing to an increased usage of the latter for applications pertaining to extracting fluids from swollen joints coupled with rising sports and joint-based injuries to name a few.

logo Report Scope

Report Attribute

Details

Market Size in 2020

USD 214.2 Million

Projected Market Size in 2026

USD 345.9 Billion

CAGR Growth Rate

6.7% CAGR

Base Year

2020

Forecast Years

2021-2026

Key Market Players

3M, EcoLab, BD, Sage Products LLC, B.Braun Melsungen AG, Johnson & Johnson, Schulke & Mayr GmbH, and Others

Key Segment

Formulation Type, Product, Application, and Region

Major Regions Covered

North America, Europe, Asia Pacific, Latin America, and Middle East & Africa

Purchase Options

Request customized purchase options to meet your research needs. Explore purchase options

logo Regional Analysis

North America is expected to witness the largest market share during the advent of the forecast period owing to the rising number of surgeries in the region coupled with the integration of pre-operative skin preparations using skin antiseptic products to name a few. Additionally, a rising number of key market players in the region coupled with a higher prevalence of nosocomial-based infections will increase the footprint of the skin antiseptic products market during the advent of the forecast period. Factors such as a well-developed healthcare infrastructure coupled with the rising number of patients will boost the growth of the skin antiseptic products market during the advent of the forecast period. The region of Asia-Pacific is expected to witness the fastest growing CAGR during the advent of the forecast period owing to increased participation of the public and private sector in terms of increasing the healthcare expenditure coupled with penetration of international players towards the region to name a few.

logo Competitive Players

The key market participants for the global skin antiseptic products market are

  • 3M
  • EcoLab
  • BD
  • Sage Products LLC
  • B.Braun Melsungen AG
  • Johnson & Johnson
  • Schulke & Mayr GmbH
  • Acto Pharma
  • Microgen
  • Avrio Health L.P.


logo By Formulation Type Segment Analysis

  • Alcohol
  • Chlorhexidine
  • Iodine
  • Octenidine
  • Others

logo By Product Segment Analysis

  • Solutions
  • Swab Sticks
  • Wipes

logo By Application Segment Analysis

  • Surgeries
  • Injections

logo By Regional Segment Analysis

  • North America
    • U.S.
    • Canada
  • Europe
    • UK
    • France
    • Germany
    • Italy
    • Spain
    • Rest of Europe
  • Asia Pacific
    • China
    • Japan
    • India
    • South Korea
    • Southeast Asia
    • Rest of Asia Pacific
  • Latin America
    • Brazil
    • Mexico
    • Rest of Latin America
  • Middle East and Africa
    • GCC Countries
    • South Africa
    • Rest of MEA

Table of Content

  1. Chapter 1 Executive Summary
    1. 1.1. Introduction of Skin Antiseptic Products
    2. 1.2. Global Skin Antiseptic Products Market, 2019 & 2026 (USD Million)
    3. 1.3. Global Skin Antiseptic Products Market, 2016 – 2026 (USD Million)
    4. 1.4. Global Skin Antiseptic Products Market Absolute Revenue Opportunity, 2016 – 2026 (USD Million)
    5. 1.5. Global Skin Antiseptic Products Market Incremental Revenue Opportunity, 2020 – 2026 (USD Million)
  2. Chapter 2 Skin Antiseptic Products Market – Formulation Type Analysis
    1. 2.1. Global Skin Antiseptic Products Market – Formulation Type Overview
    2. 2.2. Global Skin Antiseptic Products Market Share, by Formulation Type, 2019 & 2026 (USD Million)
    3. 2.3. Alcohol
      1. 2.3.1. Global Alcohol Skin Antiseptic Products Market, 2016 – 2026 (USD Million)
    4. 2.4. Chlorhexidine
      1. 2.4.1. Global Chlorhexidine Skin Antiseptic Products Market, 2016 – 2026 (USD Million)
    5. 2.5. Iodine
      1. 2.5.1. Global Iodine Skin Antiseptic Products Market, 2016 – 2026 (USD Million)
    6. 2.6. Octenidine
      1. 2.6.1. Global Octenidine Skin Antiseptic Products Market, 2016 – 2026 (USD Million)
    7. 2.7. Others
      1. 2.7.1. Global Others Skin Antiseptic Products Market, 2016 – 2026 (USD Million)
  3. Chapter 3 Skin Antiseptic Products Market – Product Analysis
    1. 3.1. Global Skin Antiseptic Products Market – Product Overview
    2. 3.2. Global Skin Antiseptic Products Market Share, by Product, 2019 & 2026 (USD Million)
    3. 3.3. Solutions
      1. 3.3.1. Global Solutions Skin Antiseptic Products Market, 2016 – 2026 (USD Million)
    4. 3.4. Swab Sticks
      1. 3.4.1. Global Swab Sticks Skin Antiseptic Products Market, 2016 – 2026 (USD Million)
    5. 3.5. Wipes
      1. 3.5.1. Global Wipes Skin Antiseptic Products Market, 2016 – 2026 (USD Million)
  4. Chapter 4 Skin Antiseptic Products Market – Application Analysis
    1. 4.1. Global Skin Antiseptic Products Market – Application Overview
    2. 4.2. Global Skin Antiseptic Products Market Share, by Application, 2019 & 2026 (USD Million)
    3. 4.3. Surgeries
      1. 4.3.1. Global Surgeries Skin Antiseptic Products Market, 2016 – 2026 (USD Million)
    4. 4.4. Injections
      1. 4.4.1. Global Injections Skin Antiseptic Products Market, 2016 – 2026 (USD Million)
  5. Chapter 5 Skin Antiseptic Products Market – Regional Analysis
    1. 5.1. Global Skin Antiseptic Products Market Regional Overview
    2. 5.2. Global Skin Antiseptic Products Market Share, by Region, 2019 & 2026 (USD Million)
    3. 5.3. North America
      1. 5.3.1. North America Skin Antiseptic Products Market, 2016 – 2026 (USD Million)
        1. 5.3.1.1. North America Skin Antiseptic Products Market, by Country, 2016 - 2026 (USD Million)
      2. 5.3.2. North America Skin Antiseptic Products Market, by Formulation Type, 2016 – 2026
        1. 5.3.2.1. North America Skin Antiseptic Products Market, by Formulation Type, 2016 – 2026 (USD Million)
      3. 5.3.3. North America Skin Antiseptic Products Market, by Product, 2016 – 2026
        1. 5.3.3.1. North America Skin Antiseptic Products Market, by Product, 2016 – 2026 (USD Million)
      4. 5.3.4. North America Skin Antiseptic Products Market, by Application, 2016 – 2026
        1. 5.3.4.1. North America Skin Antiseptic Products Market, by Application, 2016 – 2026 (USD Million)
      5. 5.3.5. U.S.
        1. 5.3.5.1. U.S. Skin Antiseptic Products Market, 2016 – 2026 (USD Million)
      6. 5.3.6. Canada
        1. 5.3.6.1. Canada Skin Antiseptic Products Market, 2016 – 2026 (USD Million)
    4. 5.4. Europe
      1. 5.4.1. Europe Skin Antiseptic Products Market, 2016 – 2026 (USD Million)
        1. 5.4.1.1. Europe Skin Antiseptic Products Market, by Country, 2016 - 2026 (USD Million)
      2. 5.4.2. Europe Skin Antiseptic Products Market, by Formulation Type, 2016 – 2026
        1. 5.4.2.1. Europe Skin Antiseptic Products Market, by Formulation Type, 2016 – 2026 (USD Million)
      3. 5.4.3. Europe Skin Antiseptic Products Market, by Product, 2016 – 2026
        1. 5.4.3.1. Europe Skin Antiseptic Products Market, by Product, 2016 – 2026 (USD Million)
      4. 5.4.4. Europe Skin Antiseptic Products Market, by Application, 2016 – 2026
        1. 5.4.4.1. Europe Skin Antiseptic Products Market, by Application, 2016 – 2026 (USD Million)
      5. 5.4.5. Germany
        1. 5.4.5.1. Germany Skin Antiseptic Products Market, 2016 – 2026 (USD Million)
      6. 5.4.6. France
        1. 5.4.6.1. France Skin Antiseptic Products Market, 2016 – 2026 (USD Million)
      7. 5.4.7. U.K.
        1. 5.4.7.1. U.K. Skin Antiseptic Products Market, 2016 – 2026 (USD Million)
      8. 5.4.8. Italy
        1. 5.4.8.1. Italy Skin Antiseptic Products Market, 2016 – 2026 (USD Million)
      9. 5.4.9. Spain
        1. 5.4.9.1. Spain Skin Antiseptic Products Market, 2016 – 2026 (USD Million)
      10. 5.4.10. Rest of Europe
        1. 5.4.10.1. Rest of Europe Skin Antiseptic Products Market, 2016 – 2026 (USD Million)
    5. 5.5. Asia Pacific
      1. 5.5.1. Asia Pacific Skin Antiseptic Products Market, 2016 – 2026 (USD Million)
        1. 5.5.1.1. Asia Pacific Skin Antiseptic Products Market, by Country, 2016 - 2026 (USD Million)
      2. 5.5.2. Asia Pacific Skin Antiseptic Products Market, by Formulation Type, 2016 – 2026
        1. 5.5.2.1. Asia Pacific Skin Antiseptic Products Market, by Formulation Type, 2016 – 2026 (USD Million)
      3. 5.5.3. Asia Pacific Skin Antiseptic Products Market, by Product, 2016 – 2026
        1. 5.5.3.1. Asia Pacific Skin Antiseptic Products Market, by Product, 2016 – 2026 (USD Million)
      4. 5.5.4. Asia Pacific Skin Antiseptic Products Market, by Application, 2016 – 2026
        1. 5.5.4.1. Asia Pacific Skin Antiseptic Products Market, by Application, 2016 – 2026 (USD Million)
      5. 5.5.5. China
        1. 5.5.5.1. China Skin Antiseptic Products Market, 2016 – 2026 (USD Million)
      6. 5.5.6. Japan
        1. 5.5.6.1. Japan Skin Antiseptic Products Market, 2016 – 2026 (USD Million)
      7. 5.5.7. India
        1. 5.5.7.1. India Skin Antiseptic Products Market, 2016 – 2026 (USD Million)
      8. 5.5.8. South Korea
        1. 5.5.8.1. South Korea Skin Antiseptic Products Market, 2016 – 2026 (USD Million)
      9. 5.5.9. South-East Asia
        1. 5.5.9.1. South-East Asia Skin Antiseptic Products Market, 2016 – 2026 (USD Million)
      10. 5.5.10. Rest of Asia Pacific
        1. 5.5.10.1. Rest of Asia Pacific Skin Antiseptic Products Market, 2016 – 2026 (USD Million)
    6. 5.6. Latin America
      1. 5.6.1. Latin America Skin Antiseptic Products Market, 2016 – 2026 (USD Million)
        1. 5.6.1.1. Latin America Skin Antiseptic Products Market, by Country, 2016 - 2026 (USD Million)
      2. 5.6.2. Latin America Skin Antiseptic Products Market, by Formulation Type, 2016 – 2026
        1. 5.6.2.1. Latin America Skin Antiseptic Products Market, by Formulation Type, 2016 – 2026 (USD Million)
      3. 5.6.3. Latin America Skin Antiseptic Products Market, by Product, 2016 – 2026
        1. 5.6.3.1. Latin America Skin Antiseptic Products Market, by Product, 2016 – 2026 (USD Million)
      4. 5.6.4. Latin America Skin Antiseptic Products Market, by Application, 2016 – 2026
        1. 5.6.4.1. Latin America Skin Antiseptic Products Market, by Application, 2016 – 2026 (USD Million)
      5. 5.6.5. Brazil
        1. 5.6.5.1. Brazil Skin Antiseptic Products Market, 2016 – 2026 (USD Million)
      6. 5.6.6. Mexico
        1. 5.6.6.1. Mexico Skin Antiseptic Products Market, 2016 – 2026 (USD Million)
      7. 5.6.7. Rest of Latin America
        1. 5.6.7.1. Rest of Latin America Skin Antiseptic Products Market, 2016 – 2026 (USD Million)
    7. 5.7. The Middle-East and Africa
      1. 5.7.1. The Middle-East and Africa Skin Antiseptic Products Market, 2016 – 2026 (USD Million)
        1. 5.7.1.1. The Middle-East and Africa Skin Antiseptic Products Market, by Country, 2016 - 2026 (USD Million)
      2. 5.7.2. The Middle-East and Africa Skin Antiseptic Products Market, by Formulation Type, 2016 – 2026
        1. 5.7.2.1. The Middle-East and Africa Skin Antiseptic Products Market, by Formulation Type, 2016 – 2026 (USD Million)
      3. 5.7.3. The Middle-East and Africa Skin Antiseptic Products Market, by Product, 2016 – 2026
        1. 5.7.3.1. The Middle-East and Africa Skin Antiseptic Products Market, by Product, 2016 – 2026 (USD Million)
      4. 5.7.4. The Middle-East and Africa Skin Antiseptic Products Market, by Application, 2016 – 2026
        1. 5.7.4.1. The Middle-East and Africa Skin Antiseptic Products Market, by Application, 2016 – 2026 (USD Million)
      5. 5.7.5. GCC Countries
        1. 5.7.5.1. GCC Countries Skin Antiseptic Products Market, 2016 – 2026 (USD Million)
      6. 5.7.6. South Africa
        1. 5.7.6.1. South Africa Skin Antiseptic Products Market, 2016 – 2026 (USD Million)
      7. 5.7.7. Rest of Middle-East Africa
        1. 5.7.7.1. Rest of Middle-East Africa Skin Antiseptic Products Market, 2016 – 2026 (USD Million)
  6. Chapter 6 Skin Antiseptic Products Market – Competitive Landscape
    1. 6.1. Competitor Market Share – Revenue
    2. 6.2. Market Concentration Rate Analysis, Top 3 and Top 5 Players
    3. 6.3. Strategic Developments
      1. 6.3.1. Acquisitions and Mergers
      2. 6.3.2. New Products
      3. 6.3.3. Research & Development Activities
  7. Chapter 7 Company Profiles
    1. 7.1. 3M
      1. 7.1.1. Company Overview
      2. 7.1.2. Product/Service Portfolio
      3. 7.1.3. 3M Sales, Revenue, and Gross Margin
      4. 7.1.4. 3M Revenue and Growth Rate
      5. 7.1.5. 3M Market Share
      6. 7.1.6. Recent Initiatives, Funding/VC Activities, and Technological Innovations
    2. 7.2. EcoLab
      1. 7.2.1. Company Overview
      2. 7.2.2. Product/Service Portfolio
      3. 7.2.3. EcoLab Sales, Revenue, and Gross Margin
      4. 7.2.4. EcoLab Revenue and Growth Rate
      5. 7.2.5. EcoLab Market Share
      6. 7.2.6. Recent Initiatives, Funding/VC Activities, and Technological Innovations
    3. 7.3. BD
      1. 7.3.1. Company Overview
      2. 7.3.2. Product/Service Portfolio
      3. 7.3.3. BD Sales, Revenue, and Gross Margin
      4. 7.3.4. BD Revenue and Growth Rate
      5. 7.3.5. BD Market Share
      6. 7.3.6. Recent Initiatives, Funding/VC Activities, and Technological Innovations
    4. 7.4. Sage Products LLC
      1. 7.4.1. Company Overview
      2. 7.4.2. Product/Service Portfolio
      3. 7.4.3. Sage Products LLC Sales, Revenue, and Gross Margin
      4. 7.4.4. Sage Products LLC Revenue and Growth Rate
      5. 7.4.5. Sage Products LLC Market Share
      6. 7.4.6. Recent Initiatives, Funding/VC Activities, and Technological Innovations
      7. 7.5. B.Braun Melsungen AG
      8. 7.5.1. Company Overview
      9. 7.5.2. Product/Service Portfolio
        1. 7.5.3. B.Braun Melsungen AG Sales, Revenue, and Gross Margin
        2. 7.5.4. B.Braun Melsungen AG Revenue and Growth Rate
        3. 7.5.5. B.Braun Melsungen AG Market Share
      10. 7.5.6. Recent Initiatives, Funding/VC Activities, and Technological Innovations
    5. 7.6. Johnson & Johnson
      1. 7.6.1. Company Overview
      2. 7.6.2. Product/Service Portfolio
      3. 7.6.3. Johnson & Johnson Sales, Revenue, and Gross Margin
      4. 7.6.4. Johnson & Johnson Revenue and Growth Rate
      5. 7.6.5. Johnson & Johnson Market Share
      6. 7.6.6. Recent Initiatives, Funding/VC Activities, and Technological Innovations
    6. 7.7. Schulke & Mayr GmbH
      1. 7.7.1. Company Overview
      2. 7.7.2. Product/Service Portfolio
      3. 7.7.3. Schulke & Mayr GmbH Sales, Revenue, and Gross Margin
      4. 7.7.4. Schulke & Mayr GmbH Revenue and Growth Rate
      5. 7.7.5. Schulke & Mayr GmbH Market Share
      6. 7.7.6. Recent Initiatives, Funding/VC Activities, and Technological Innovations
    7. 7.8. Acto Pharma
      1. 7.8.1. Company Overview
      2. 7.8.2. Product/Service Portfolio
      3. 7.8.3. Acto Pharma Sales, Revenue, and Gross Margin
      4. 7.8.4. Acto Pharma Revenue and Growth Rate
      5. 7.8.5. Acto Pharma Market Share
      6. 7.8.6. Recent Initiatives, Funding/VC Activities, and Technological Innovations
    8. 7.9. Microgen
      1. 7.9.1. Company Overview
      2. 7.9.2. Product/Service Portfolio
      3. 7.9.3. Microgen Sales, Revenue, and Gross Margin
      4. 7.9.4. Microgen Revenue and Growth Rate
      5. 7.9.5. Microgen Market Share
      6. 7.9.6. Recent Initiatives, Funding/VC Activities, and Technological Innovations
    9. 7.10. Avrio Health L.P
      1. 7.10.1. Company Overview
      2. 7.10.2. Product/Service Portfolio
      3. 7.10.3. Avrio Health L.P Sales, Revenue, and Gross Margin
      4. 7.10.4. Avrio Health L.P Revenue and Growth Rate
      5. 7.10.5. Avrio Health L.P Market Share
      6. 7.10.6. Recent Initiatives, Funding/VC Activities, and Technological Innovations
  8. Chapter 8 Skin Antiseptic Products — Industry Analysis
    1. 8.1. Introduction and Taxonomy
    2. 8.2. Skin Antiseptic Products Market – Key Trends
      1. 8.2.1. Market Drivers
      2. 8.2.2. Market Restraints
      3. 8.2.3. Market Opportunities
    3. 8.3. Value Chain Analysis
    4. 8.4. Key Mandates and Regulations
    5. 8.5. Technology Roadmap and Timeline
    6. 8.6. Skin Antiseptic Products Market – Attractiveness Analysis
      1. 8.6.1. By Formulation Type
      2. 8.6.2. By Product
      3. 8.6.3. By Application
      4. 8.6.4. By Region
  9. Chapter 9 Industrial Chain, Sourcing Strategy, and Downstream Buyers
    1. 9.1. Skin Antiseptic Products Industrial Chain Analysis
    2. 9.2. Downstream Buyers
    3. 9.3. Distributors/Traders List
  10. Chapter 10 Marketing Strategy Analysis
    1. 10.1. Marketing Channel
    2. 10.2. Direct Marketing
    3. 10.3. Indirect Marketing
    4. 10.4. Marketing Channel Development Trends
    5. 10.5. Economic/Political Environmental Change
  11. Chapter 11 Report Conclusion & Key Insights
    1. 11.1. Key Insights from Primary Interviews & Surveys Respondents
    2. 11.2. Key Takeaways from Analysts, Consultants, and Industry Leaders
  12. Chapter 12 Research Approach & Methodology
    1. 12.1. Report Description
    2. 12.2. Research Scope
    3. 12.3. Research Methodology
      1. 12.3.1. Secondary Research
      2. 12.3.2. Primary Research
      3. 12.3.3. Statistical Models
        1. 12.3.3.1. Company Share Analysis Model
        2. 12.3.3.2. Revenue Based Modeling
      4. 12.3.4. Research Limitations

      List of Figures

      Fig.1	Product Picture of Skin Antiseptic Products
      Fig.2	Global Skin Antiseptic Products Market, 2016 – 2026 (USD Million)
      Fig.3	Global Skin Antiseptic Products Market Absolute Revenue Opportunity, 2016 – 2026 (USD Million)
      Fig.4	Global Skin Antiseptic Products Market Incremental Revenue Opportunity, 2020 – 2026 (USD Million)
      Fig.5	Global Skin Antiseptic Products Market Share, by Formulation Type, 2019 & 2026 (USD Million)
      Fig.6	Global Alcohol Skin Antiseptic Products Market, 2016 – 2026 (USD Million)
      Fig.7	Global Chlorhexidine Skin Antiseptic Products Market, 2016 – 2026 (USD Million)
      Fig.8	Global Iodine  Skin Antiseptic Products Market, 2016 – 2026 (USD Million)
      Fig.9	Global Octenidine Skin Antiseptic Products Market, 2016 – 2026 (USD Million)
      Fig.10	Global Others Skin Antiseptic Products Market, 2016 – 2026 (USD Million)
      Fig.11	Global Skin Antiseptic Products Market Share, by Product, 2019 & 2026 (USD Million)
      Fig.12	Global Solutions Skin Antiseptic Products Market, 2016 – 2026 (USD Million)
      Fig.13	Global Swab Sticks  Skin Antiseptic Products Market, 2016 – 2026 (USD Million)
      Fig.14	Global Wipes Skin Antiseptic Products Market, 2016 – 2026 (USD Million)
      Fig.15	Global Skin Antiseptic Products Market Share, by Application, 2019 & 2026 (USD Million)
      Fig.16	Global Surgeries Skin Antiseptic Products Market, 2016 – 2026 (USD Million)
      Fig.17	Global Injections Skin Antiseptic Products Market, 2016 – 2026 (USD Million)
      Fig.18	Global Skin Antiseptic Products Market Share, by Region, 2019 & 2026 (USD Million)
      Fig.19	North America Skin Antiseptic Products Market, 2016 – 2026 (USD Million)
      Fig.20	U.S. Skin Antiseptic Products Market, 2016 – 2026 (USD Million)
      Fig.21	Canada Skin Antiseptic Products Market, 2016 – 2026 (USD Million)
      Fig.22	Europe Skin Antiseptic Products Market, 2016 – 2026 (USD Million)
      Fig.23	Germany Skin Antiseptic Products Market, 2016 – 2026 (USD Million)
      Fig.24	France Skin Antiseptic Products Market, 2016 – 2026 (USD Million)
      Fig.25	U.K. Skin Antiseptic Products Market, 2016 – 2026 (USD Million)
      Fig.26	Italy Skin Antiseptic Products Market, 2016 – 2026 (USD Million)
      Fig.27	Spain Skin Antiseptic Products Market, 2016 – 2026 (USD Million)
      Fig.28	Rest of Europe Skin Antiseptic Products Market, 2016 – 2026 (USD Million)
      Fig.29	Asia Pacific Skin Antiseptic Products Market, 2016 – 2026 (USD Million)
      Fig.30	China Skin Antiseptic Products Market, 2016 – 2026 (USD Million)
      Fig.31	Japan Skin Antiseptic Products Market, 2016 – 2026 (USD Million)
      Fig.32	India Skin Antiseptic Products Market, 2016 – 2026 (USD Million)
      Fig.33	South  Korea Skin Antiseptic Products Market, 2016 – 2026 (USD Million)
      Fig.34	South-East Asia Skin Antiseptic Products Market, 2016 – 2026 (USD Million)
      Fig.35	Rest of Asia Pacific Skin Antiseptic Products Market, 2016 – 2026 (USD Million)
      Fig.36	Latin America Skin Antiseptic Products Market, 2016 – 2026 (USD Million)
      Fig.37	Brazil Skin Antiseptic Products Market, 2016 – 2026 (USD Million)
      Fig.38	Mexico Skin Antiseptic Products Market, 2016 – 2026 (USD Million)
      Fig.39	Rest of Latin America Skin Antiseptic Products Market, 2016 – 2026 (USD Million)
      Fig.40	The Middle-East and Africa Skin Antiseptic Products Market, 2016 – 2026 (USD Million)
      Fig.41	GCC Countries Skin Antiseptic Products Market, 2016 – 2026 (USD Million)
      Fig.42	South Africa Skin Antiseptic Products Market, 2016 – 2026 (USD Million)
      Fig.43	Rest of Middle-East Africa Skin Antiseptic Products Market, 2016 – 2026 (USD Million)
      Fig.44	Competitor Market Share – Revenue
      Fig.45	3M Revenue and Growth Rate
      Fig.46	3M Market Share
      Fig.47	EcoLab Revenue and Growth Rate
      Fig.48	EcoLab Market Share
      Fig.49	BD Revenue and Growth Rate
      Fig.50	BD Market Share
      Fig.51	Sage Products LLC Revenue and Growth Rate
      Fig.52	Sage Products LLC Market Share
      Fig.53	B.Braun Melsungen AG Revenue and Growth Rate
      Fig.54	B.Braun Melsungen AG Market Share
      Fig.55	Johnson & Johnson Revenue and Growth Rate
      Fig.56	Johnson & Johnson Market Share
      Fig.57	Schulke & Mayr GmbH Revenue and Growth Rate
      Fig.58	Schulke & Mayr GmbH Market Share
      Fig.59	Acto Pharma Revenue and Growth Rate
      Fig.60	Acto Pharma Market Share
      Fig.61	Microgen Revenue and Growth Rate
      Fig.62	Microgen Market Share
      Fig.63	Avrio Health L.P Revenue and Growth Rate
      Fig.64	Avrio Health L.P Market Share
      Fig.65	Market Dynamics
      Fig.66	Global Skin Antiseptic Products – Value Chain Analysis
      Fig.67	Key Mandates and Regulations
      Fig.68	Technology Roadmap and Timeline
      Fig.69	Market Attractiveness Analysis – By Formulation Type
      Fig.70	Market Attractiveness Analysis – By Product
      Fig.71	Market Attractiveness Analysis – By Application
      Fig.72	Market Attractiveness Analysis – By Region
      Fig.73	Skin Antiseptic Products Industrial Chain Analysis
      Fig.74	Market Channels
      Fig.75	Marketing Channel Development Trend
      Fig.76	Growth in World Gross Product, 2008-2018
      

      List of Tables

      Table 1	Global Skin Antiseptic Products Market, 2019 & 2026 (USD Million)
      Table 2	Global Skin Antiseptic Products Market, by Formulation Type, 2016 – 2026 (USD Million)
      Table 3	Global Skin Antiseptic Products Market, by Product, 2016 – 2026 (USD Million)
      Table 4	Global Skin Antiseptic Products Market, by Application, 2016 – 2026 (USD Million)
      Table 5	Global Skin Antiseptic Products Market, by Region, 2016 – 2026 (USD Million)
      Table 6	North America Skin Antiseptic Products Market, by Country, 2016 – 2026 (USD Million)
      Table 7	North America Skin Antiseptic Products Market, by Formulation Type, 2016 – 2026 (USD Million)
      Table 8	North America Skin Antiseptic Products Market, by Product, 2016 – 2026 (USD Million)
      Table 9	North America Skin Antiseptic Products Market, by Application, 2016 – 2026 (USD Million)
      Table 10 Europe Skin Antiseptic Products Market, by Country, 2016 – 2026 (USD Million)
      Table 11 Europe Skin Antiseptic Products Market, by Formulation Type, 2016 – 2026 (USD Million)
      Table 12 Europe Skin Antiseptic Products Market, by Product, 2016 – 2026 (USD Million)
      Table 13 Europe Skin Antiseptic Products Market, by Application, 2016 – 2026 (USD Million)
      Table 14 Asia Pacific Skin Antiseptic Products Market, by Country, 2016 – 2026 (USD Million)
      Table 15 Asia Pacific Skin Antiseptic Products Market, by Formulation Type, 2016 – 2026 (USD Million)
      Table 16 Asia Pacific Skin Antiseptic Products Market, by Product, 2016 – 2026 (USD Million)
      Table 17 Asia Pacific Skin Antiseptic Products Market, by Application, 2016 – 2026 (USD Million)
      Table 18 Latin America Skin Antiseptic Products Market, by Country, 2016 – 2026 (USD Million)
      Table 19 Latin America Skin Antiseptic Products Market, by Formulation Type, 2016 – 2026 (USD Million)
      Table 20 Latin America Skin Antiseptic Products Market, by Product, 2016 – 2026 (USD Million)
      Table 21 Latin America Skin Antiseptic Products Market, by Application, 2016 – 2026 (USD Million)
      Table 22 The Middle-East and Africa Skin Antiseptic Products Market, by Country, 2016 – 2026 (USD Million)
      Table 23 The Middle-East and Africa Skin Antiseptic Products Market, by Formulation Type, 2016 – 2026 (USD Million)
      Table 24 The Middle-East and Africa Skin Antiseptic Products Market, by Product, 2016 – 2026 (USD Million)
      Table 25 The Middle-East and Africa Skin Antiseptic Products Market, by Application, 2016 – 2026 (USD Million)
      Table 26 Global Skin Antiseptic Products Market - Company Revenue Analysis, 2016 – 2019 (USD Million)
      Table 27 Global Skin Antiseptic Products Market - Company Revenue Share Analysis, 2016 – 2019 (%)
      Table 28 Acquisitions and Mergers
      Table 29 Market Drivers – Impact Analysis
      Table 30 Market Restraints
      Table 31 Market Opportunities
      Table 32 Major Buyers of Skin Antiseptic Products
      Table 33 Distributors/Traders of Skin Antiseptic Products by Region
      

Industry Major Market Players

  • 3M
  • EcoLab
  • BD
  • Sage Products LLC
  • B.Braun Melsungen AG
  • Johnson & Johnson
  • Schulke & Mayr GmbH
  • Acto Pharma
  • Microgen
  • Avrio Health L.P.