Search Market Research Report

Discover Our Latest Reports
Discover Our Featured Reports
Discover Top Selling Reports

Silver Nanowires Market Size, Share Global Analysis Report, 2020–2026

report img

Silver Nanowires Market By Type (Under 30 nm, 30-50 nm, 50-70 nm, 70-80 nm, and Others) and Application (TSP, Solar Cells, OLED Lighting, and Others): Global Industry Outlook, Market Size, Business Intelligence, Consumer Preferences, Statistical Surveys, Comprehensive Analysis, Historical Developments, Current Trends, and Forecast 2020–2026

Industry Insights

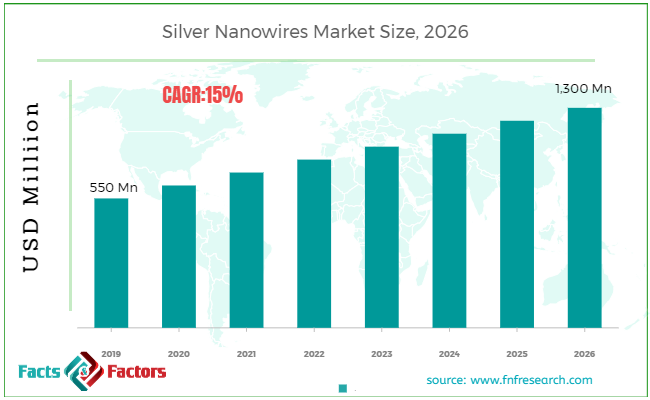
[162+ Pages Report] According to the report published by Facts Factors, the global silver nanowires market size was worth around USD 550 million in 2019 and is predicted to grow to around USD 1,300 million by 2026 with a compound annual growth rate (CAGR) of roughly 15% between 2020 and 2026. The report analyzes the global silver nanowires market drivers, restraints/challenges, and the effect they have on the demands during the projection period. In addition, the report explores emerging opportunities in the silver nanowires market.

Silver Nanowires Market Size

To know more about this report | Request Free Sample Copy

This specialized and expertise-oriented industry research report scrutinizes the technical and commercial business outlook of the silver nanowires industry. The report analyzes and declares the historical and current trends analysis of the silver nanowires industry and subsequently recommends the projected trends anticipated to be observed in the silver nanowires market during the upcoming years.

The silver nanowires market report analyzes and notifies the industry statistics at the global as well as regional and country levels in order to acquire a thorough perspective of the entire silver nanowires market. The historical and past insights are provided for FY 2016 to FY 2019 whereas projected trends are delivered for FY 2020 to FY 2026. The quantitative and numerical data is represented in terms of value (USD Million) from FY 2016 – 2026.


logoKey Insights from Primary Research

  • According to our primary respondents, the global silver nanowires market is projected to witness growth with a CAGR of 15% over the forecast period.
  • Growing optical industries across the globe is a major factor in creating new demand for the global silver nanowires market.
  • On the basis of the product, the 50-70 nm segment accounted for a market share of nearly 25% in the global silver nanowires market in 2019.
  • The silver nanowires market is also projected to witness lucrative growth over the forthcoming years due to the surging penetration of conductive applications in the electrical and electronics industry globally.
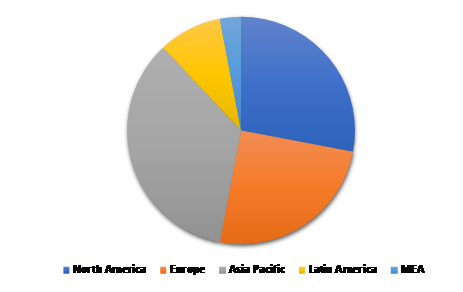
  • Based on region, the Asia Pacific region held a major share of the silver nanowires market in 2019, accounting for a market share of nearly 40%.

logoKey Recommendations from Analysts

  • According to our analysts, the global silver nanowires market was valued at USD 550 million in 2019, the growth in the consumer electronics sector has been a key growth fueling factor for the market.
  • According to industry expertise, silver nanowires are used in conductive applications such as LEDs, computer boards, and touchscreen displays.
  • According to our analysts, the emergence of touchscreen control panels and keypads in consumer electronics and manufacturing machines is expected to hinder the market.
  • Growing demand for medical imaging equipment in healthcare across the globe is also expected to boom the demand for silver nanowires over the upcoming years.
  • Region-wise, the Asia Pacific region is anticipated to experience the highest growth for the silver nanowires market owing to the growing consumer electronics and healthcare equipment especially in China, India, and Southeast Asia countries during the forecast period.

logoMarket Share Analysis by Region

Silver Nanowire Market

To know more about this report | Request Free Sample Copy


The quantitative data is further underlined and reinforced by comprehensive qualitative data which comprises various across-the-board market dynamics. The rationales which directly or indirectly impact the silver nanowires industry are exemplified through parameters such as growth drivers, restraints, challenges, and opportunities among other impacting factors.

Throughout our research report, we have encompassed all the proven models and tools of industry analysis and extensively illustrated all the key business strategies and business models adopted in the silver nanowires industry. The report provides an all-inclusive and detailed competitive landscape prevalent in the silver nanowires market.

The report utilizes established industry analysis tools and models such as Porter’s Five Forces framework to analyze and recognize critical business strategies adopted by various stakeholders involved in the entire value chain of the silver nanowires industry. The silver nanowires market report additionally employs SWOT analysis and PESTLE analysis models for further in-depth analysis.

The report study further includes an in-depth analysis of industry players' market shares and provides an overview of leading players' market position in the silver nanowires sector. Key strategic developments in the silver nanowires market competitive landscape such as acquisitions & mergers, inaugurations of different products and services, partnerships & joint ventures, MoU agreements, VC & funding activities, R&D activities, and geographic expansion among other noteworthy activities by key players of the silver nanowires market are appropriately highlighted in the report.

The silver nanowires market research report delivers an acute valuation and taxonomy of the silver nanowires industry by practically splitting the market on the basis of different types, categories, and regions. Through the analysis of the historical and projected trends, all the segments and sub-segments were evaluated through the bottom-up approach, and different market sizes have been projected for FY 2020 to FY 2026.

logoReport Scope

Report Attribute

Details

Market Size in 2019

USD 550 Million

Projected Market Size in 2026

USD 1,300 Million

CAGR Growth Rate

15% CAGR

Base Year

2019

Forecast Years

2020-2026

Key Market Players

Americal Elements’, RAS AG Material Technologies, TPK, NanoTech Labs Inc., Nanopyxis, C3Nano, Hefei Vigon Material Technology, Showa Denko K.K., and Others

Key Segment

By Type, Application, and Region

Major Regions Covered

North America, Europe, Asia Pacific, Latin America, and the Middle East & Africa

Purchase Options

Request customized purchase options to meet your research needs. Explore purchase options

The regional segmentation of the silver nanowires industry includes the complete classification of all the major continents including North America, Latin America, Europe, Asia Pacific, and the Middle East & Africa. Further, country-wise data for the silver nanowires industry is provided for the leading economies of the world.

Silver nanowires exhibit electrical, optical, and thermal properties. Silver nanowires are immensely used in the electronics and electrical industry for transparent conducting film and electrodes. The silver nanowires can be produced using various techniques including the polyol method, rapid synthesis, template method, and electroless deposition. The growing optical industry across the globe is likely to drive the demand for silver nanowires over the forthcoming years.

The silver nanowires market is segmented based on type, application, and region. On the basis of type, the market is classified into 30 nm, 30-50 nm, 50-70 nm, 70-80 nm, and others. On the basis of application, the market is classified into TSP, solar cells, OLED lighting, and others.

logoSome of the essential players operating in the silver nanowires market, but not restricted to include

  •  Hua-Jie (Taiwan) Corp.
  •  NanoTech Labs Inc.
  •  Hefei Vigon Material Technology
  •  Americal Elements’
  •  Material Technologies Inc.
  •  Showa Denko K.K
  •  C3Nano
  •  Nanopyxis
  •  RAS AG Corporation

The taxonomy of the silver nanowires industry by its scope and segmentation is as follows:

logo By Type Segmentation Analysis

  • Under 30 nm
  • 30-50 nm
  • 50-70 nm
  • 70-80 nm
  • Others

logo By Application Segmentation Analysis

  • TSP
  • Solar Cells
  • OLED Lighting
  • Others

logo Regional Segmentation Analysis

  • North America
    • The U.S.
    • Canada
  • Europe
    • Germany
    • The UK
    • France
    • Spain
    • Italy
    • Rest of Europe
  • Asia Pacific
    • China
    • Japan
    • India
    • South Korea
    • Southeast Asia
    • Rest of Asia Pacific
  • Latin America
    • Brazil
    • Mexico
    • Rest of Latin America
  • Middle East & Africa
    • GCC
    • South Africa
    • Rest of Middle East & Africa

Table of Content

  1. CHAPTER 1. Executive Summary
  2. CHAPTER 2. Silver Nanowires market – Type Analysis
    1. 2.1. Global Silver Nanowires Market – Type Overview
    2. 2.2. Global Silver Nanowires Market Share, by Type, 2019 & 2026 (USD Million)
    3. 2.3. Under 30 nm
      1. 2.3.1. Global Under 30 nm Silver Nanowires Market, 2016-2026 (USD Million)
    4. 2.4. 30-50 nm
      1. 2.4.1. Global 30-50 nm Silver Nanowires Market, 2016-2026 (USD Million)
    5. 2.5. 50-70 nm
      1. 2.5.1. Global 50-70 nm Silver Nanowires Market, 2016-2026 (USD Million)
    6. 2.6. 70-80 nm
      1. 2.6.1. Global 70-80 nm Silver Nanowires Market, 2016-2026 (USD Million)
    7. 2.7. Others
      1. 2.7.1. Global Others Silver Nanowires Market, 2016-2026 (USD Million)
  3. CHAPTER 3. Silver Nanowires market – Application Analysis
    1. 3.1. Global Silver Nanowires Market – Application Overview
    2. 3.2. Global Silver Nanowires Market Share, by Application, 2019 & 2026 (USD Million)
    3. 3.3. TSP
      1. 3.3.1. Global TSP Silver Nanowires Market, 2016-2026 (USD Million)
    4. 3.4. Solar Cells
      1. 3.4.1. Global Solar Cells Silver Nanowires Market, 2016-2026 (USD Million)
    5. 3.5. OLED Lighting
      1. 3.5.1. Global OLED Lighting Silver Nanowires Market, 2016-2026 (USD Million)
    6. 3.6. Others
      1. 3.6.1. Global Others Silver Nanowires Market, 2016-2026 (USD Million)
  4. CHAPTER 4. Silver Nanowires market – Regional Analysis
    1. 4.1. Global Silver Nanowires Market Regional Overview
    2. 4.2. Global Silver Nanowires Market Share, by Region, 2019 & 2026 (Value)
    3. 4.3. North America
      1. 4.3.1. North America Silver Nanowires Market size and forecast, 2016-2026
      2. 4.3.2. North America Silver Nanowires Market, by Country, 2019 & 2026 (USD Million)
      3. 4.3.3. North America Silver Nanowires Market, by Type, 2016-2026
        1. 4.3.3.1. North America Silver Nanowires Market, by Type, 2016-2026 (USD Million)
      4. 4.3.4. North America Silver Nanowires Market, by Application, 2016-2026
        1. 4.3.4.1. North America Silver Nanowires Market, by Application, 2016-2026 (USD Million)
      5. 4.3.5. U.S.
        1. 4.3.5.1. U.S. Market size and forecast, 2016-2026 (USD Million)
      6. 4.3.6. Canada
        1. 4.3.6.1. Canada Market size and forecast, 2016-2026 (USD Million)
    4. 4.4. Europe
      1. 4.4.1. Europe Silver Nanowires Market size and forecast, 2016-2026
      2. 4.4.2. Europe Silver Nanowires Market, by Country, 2019 & 2026 (USD Million)
      3. 4.4.3. Europe Silver Nanowires Market, by Type, 2016-2026
        1. 4.4.3.1. Europe Silver Nanowires Market, by Type, 2016-2026 (USD Million)
      4. 4.4.4. Europe Silver Nanowires Market, by Application, 2016-2026
        1. 4.4.4.1. Europe Silver Nanowires Market, by Application, 2016-2026 (USD Million)
      5. 4.4.5. Germany
        1. 4.4.5.1. Germany Market size and forecast, 2016-2026 (USD Million)
      6. 4.4.6. France
        1. 4.4.6.1. France Market size and forecast, 2016-2026 (USD Million)
      7. 4.4.7. U.K.
        1. 4.4.7.1. U.K. Market size and forecast, 2016-2026 (USD Million)
      8. 4.4.8. Italy
        1. 4.4.8.1. Italy Market size and forecast, 2016-2026 (USD Million)
      9. 4.4.9. Spain
        1. 4.4.9.1. Spain Market size and forecast, 2016-2026 (USD Million)
      10. 4.4.10. Rest of Europe
        1. 4.4.10.1. Rest of Europe Market size and forecast, 2016-2026 (USD Million)
    5. 4.5. Asia Pacific
      1. 4.5.1. Asia Pacific Silver Nanowires Market size and forecast, 2016-2026
      2. 4.5.2. Asia Pacific Silver Nanowires Market, by Country, 2019 & 2026 (USD Million)
      3. 4.5.3. Asia Pacific Silver Nanowires Market, by Type, 2016-2026
        1. 4.5.3.1. Asia Pacific Silver Nanowires Market, by Type, 2016-2026 (USD Million)
      4. 4.5.4. Asia Pacific Silver Nanowires Market, by Application, 2016-2026
        1. 4.5.4.1. Asia Pacific Silver Nanowires Market, by Application, 2016-2026 (USD Million)
      5. 4.5.5. China
        1. 4.5.5.1. China Market size and forecast, 2016-2026 (USD Million)
      6. 4.5.6. Japan
        1. 4.5.6.1. Japan Market size and forecast, 2016-2026 (USD Million)
      7. 4.5.7. India
        1. 4.5.7.1. India Market size and forecast, 2016-2026 (USD Million)
      8. 4.5.8. South Korea
        1. 4.5.8.1. South Korea Market size and forecast, 2016-2026 (USD Million)
      9. 4.5.9. South-East Asia
        1. 4.5.9.1. South-East Asia Market size and forecast, 2016-2026 (USD Million)
      10. 4.5.10. Rest of Asia Pacific
        1. 4.5.10.1. Rest of Asia Pacific Market size and forecast, 2016-2026 (USD Million)
    6. 4.6. Latin America
      1. 4.6.1. Latin America Silver Nanowires Market size and forecast, 2016-2026
      2. 4.6.2. Latin America Silver Nanowires Market, by Country, 2019 & 2026 (USD Million)
      3. 4.6.3. Latin America Silver Nanowires Market, by Type, 2016-2026
        1. 4.6.3.1. Latin America Silver Nanowires Market, by Type, 2016-2026 (USD Million)
      4. 4.6.4. Latin America Silver Nanowires Market, by Application, 2016-2026
        1. 4.6.4.1. Latin America Silver Nanowires Market, by Application, 2016-2026 (USD Million)
      5. 4.6.5. Brazil
        1. 4.6.5.1. Brazil Market size and forecast, 2016-2026 (USD Million)
      6. 4.6.6. Mexico
        1. 4.6.6.1. Mexico Market size and forecast, 2016-2026 (USD Million)
      7. 4.6.7. Rest of Latin America
        1. 4.6.7.1. Rest of Latin America Market size and forecast, 2016-2026 (USD Million)
    7. 4.7. The Middle-East and Africa
      1. 4.7.1. The Middle-East and Africa Silver Nanowires Market size and forecast, 2016-2026
      2. 4.7.2. The Middle-East and Africa Silver Nanowires Market, by Country, 2019 & 2026 (USD Million)
      3. 4.7.3. The Middle-East and Africa Silver Nanowires Market, by Type, 2016-2026
        1. 4.7.3.1. The Middle-East and Africa Silver Nanowires Market, by Type, 2016-2026 (USD Million)
      4. 4.7.4. The Middle-East and Africa Silver Nanowires Market, by Application, 2016-2026
        1. 4.7.4.1. The Middle-East and Africa Silver Nanowires Market, by Application, 2016-2026 (USD Million)
      5. 4.7.5. GCC Countries
        1. 4.7.5.1. GCC Countries Market size and forecast, 2016-2026 (USD Million)
      6. 4.7.6. South Africa
        1. 4.7.6.1. South Africa Market size and forecast, 2016-2026 (USD Million)
      7. 4.7.7. Rest of Middle-East Africa
        1. 4.7.7.1. Rest of Middle-East Africa Market size and forecast, 2016-2026 (USD Million)
  5. CHAPTER 5. Silver Nanowires market – Competitive Landscape
    1. 5.1. Competitor Market Share – Revenue
    2. 5.2. Market Concentration Rate Analysis, Top 3 and Top 5 Players
    3. 5.3. Strategic Development
      1. 5.3.1. Acquisitions and Mergers
      2. 5.3.2. New Products
      3. 5.3.3. Research & Development Activities
  6. CHAPTER 6. Company Profiles
    1. 6.1. Americal Elements’
      1. 6.1.1. Company Overview
      2. 6.1.2. Americal Elements’ Revenue and Gross Margin
      3. 6.1.3. Product portfolio
      4. 6.1.4. Recent initiatives
    2. 6.2. RAS AG
      1. 6.2.1. Company Overview
      2. 6.2.2. RAS AG Revenue and Gross Margin
      3. 6.2.3. Product portfolio
      4. 6.2.4. Recent initiatives
    3. 6.3. Material Technologies Inc.
      1. 6.3.1. Company Overview
      2. 6.3.2. Material Technologies Inc. Revenue and Gross Margin
      3. 6.3.3. Product portfolio
      4. 6.3.4. Recent initiatives
    4. 6.4. TPK
      1. 6.4.1. Company Overview
      2. 6.4.2. TPK Revenue and Gross Margin
      3. 6.4.3. Product portfolio
      4. 6.4.4. Recent initiatives
    5. 6.5. NanoTech Labs Inc.
      1. 6.5.1. Company Overview
      2. 6.5.2. NanoTech Labs Inc. Revenue and Gross Margin
      3. 6.5.3. Product portfolio
      4. 6.5.4. Recent initiatives
    6. 6.6. Nanopyxis
      1. 6.6.1. Company Overview
      2. 6.6.2. Nanopyxis Revenue and Gross Margin
      3. 6.6.3. Product portfolio
      4. 6.6.4. Recent initiatives
    7. 6.7. C3Nano
      1. 6.7.1. Company Overview
      2. 6.7.2. C3Nano Revenue and Gross Margin
      3. 6.7.3. Product portfolio
      4. 6.7.4. Recent initiatives
    8. 6.8. Hefei Vigon Material Technology
      1. 6.8.1. Company Overview
      2. 6.8.2. Hefei Vigon Material Technology Revenue and Gross Margin
      3. 6.8.3. Product portfolio
      4. 6.8.4. Recent initiatives
    9. 6.9. Showa Denko K.K
      1. 6.9.1. Company Overview
      2. 6.9.2. Showa Denko K.K Revenue and Gross Margin
      3. 6.9.3. Product portfolio
      4. 6.9.4. Recent initiatives
  7. CHAPTER 7. Silver Nanowires — Industry Analysis
    1. 7.1. Silver Nanowires Market – Key Trends
      1. 7.1.1. Market Drivers
      2. 7.1.2. Market Restraints
      3. 7.1.3. Market Opportunities
    2. 7.2. Value Chain Analysis
    3. 7.3. Technology Roadmap and Timeline
    4. 7.4. Silver Nanowires Market – Attractiveness Analysis
      1. 7.4.1. By Type
      2. 7.4.2. By Application
      3. 7.4.3. By Region
  8. CHAPTER 8. Marketing Strategy Analysis, Distributors
    1. 8.1. Marketing Channel
    2. 8.2. Direct Marketing
    3. 8.3. Indirect Marketing
    4. 8.4. Marketing Channel Development Trend
    5. 8.5. Economic/Political Environmental Change
  9. CHAPTER 9. Report Conclusion
  10. CHAPTER 10. Research Approach & Methodology
    1. 10.1. Report Description
    2. 10.2. Research Scope
    3. 10.3. Research Methodology
      1. 10.3.1. Secondary Research
      2. 10.3.2. Primary Research
      3. 10.3.3. Models
        1. 10.3.3.1. Company Share Analysis Model
        2. 10.3.3.2. Revenue Based Modeling
        3. 10.3.3.3. Research Limitations

  • List of Figures

    FIG. 1 Global Silver Nanowires Market, 2016-2026 (USD Million)
    FIG. 2 Global Silver Nanowires Market Share, by Type, 2019 & 2026 (USD Million)
    FIG. 3 Global Under 30 nm Silver Nanowires Market, 2016-2026 (USD Million)
    FIG. 4 Global 30-50 nm Silver Nanowires Market, 2016-2026 (USD Million)
    FIG. 5 Global 50-70 nm Silver Nanowires Market, 2016-2026 (USD Million)
    FIG. 6 Global 70-80 nm Silver Nanowires Market, 2016-2026 (USD Million)
    FIG. 7 Gobal  Others Silver Nanowires Market, 2016-2026 (USD Million)
    FIG. 8 Global Silver Nanowires Market Share, by Application, 2019 & 2026 (USD Million)
    FIG. 9 Global TSP Silver Nanowires Market, 2016-2026 (USD Million)
    FIG. 10 Global Solar Cells Silver Nanowires Market, 2016-2026 (USD Million)
    FIG. 11 Global OLED Lighting Silver Nanowires Market, 2016-2026 (USD Million)
    FIG. 12 Global Others Silver Nanowires Market, 2016-2026 (USD Million)
    FIG. 13 Global Others Silver Nanowires Market, 2016-2026 (USD Million)
    FIG. 14 Global Silver Nanowires Market Share, by Region, 2019 & 2026
    FIG. 15 North America Silver Nanowires Market, 2016-2026
    FIG. 16 U.S. Silver Nanowires Market, 2016-2026
    FIG. 17 Canada Silver Nanowires Market, 2016-2026
    FIG. 18 Europe Silver Nanowires Market, 2016-2026
    FIG. 19 Germany Silver Nanowires Market, 2016-2026
    FIG. 20 France Silver Nanowires Market, 2016-2026
    FIG. 21 U.K. Silver Nanowires Market, 2016-2026
    FIG. 22 Italy Silver Nanowires Market, 2016-2026
    FIG. 23 Spain Silver Nanowires Market, 2016-2026
    FIG. 24 Rest of Europe Silver Nanowires Market, 2016-2026
    FIG. 25 Asia Pacific Silver Nanowires Market, 2016-2026
    FIG. 26 China Silver Nanowires Market, 2016-2026
    FIG. 27 Japan Silver Nanowires Market, 2016-2026
    FIG. 28 India Silver Nanowires Market, 2016-2026
    FIG. 29 South  Korea Silver Nanowires Market, 2016-2026
    FIG. 30 South-East Asia Silver Nanowires Market, 2016-2026
    FIG. 31 Rest of Asia Pacific Silver Nanowires Market, 2016-2026
    FIG. 32 Latin America Silver Nanowires Market, 2016-2026
    FIG. 33 Brazil Silver Nanowires Market, 2016-2026
    FIG. 34 Mexico Silver Nanowires Market, 2016-2026
    FIG. 35 Rest of Latin America Silver Nanowires Market, 2016-2026
    FIG. 36 The Middle-East and Africa Silver Nanowires Market, 2016-2026
    FIG. 37 GCC Countries Silver Nanowires Market, 2016-2026
    FIG. 38 South Africa Silver Nanowires Market, 2016-2026
    FIG. 39 Rest of Middle-East Africa Silver Nanowires Market, 2016-2026
    FIG. 40 Competitor Market Share – Revenue
    FIG. 41 Americal Elements’ Revenue and Growth Rate
    FIG. 42 Americal Elements’ Market Share
    FIG. 43 RAS AG Revenue and Growth Rate
    FIG. 44 RAS AG Market Share
    FIG. 45 Material Technologies Inc. Revenue and Growth Rate
    FIG. 46 Material Technologies Inc. Market Share
    FIG. 47 TPK Revenue and Growth Rate
    FIG. 48 TPK Market Share
    FIG. 49 NanoTech Labs Inc. Revenue and Growth Rate
    FIG. 50 NanoTech Labs Inc. Market Share
    FIG. 51 Nanopyxis Revenue and Growth Rate
    FIG. 52 Nanopyxis Market Share
    FIG. 53 C3Nano Revenue and Growth Rate
    FIG. 54 C3Nano Market Share
    FIG. 55 Hefei Vigon Material Technology Revenue and Growth Rate
    FIG. 56 Hefei Vigon Material Technology Market Share
    FIG. 57 Showa Denko K.K Revenue and Growth Rate
    FIG. 58 Showa Denko K.K Market Share
    FIG. 59 Market Dynamics
    FIG. 60 Global Silver Nanowires – Value Chain Analysis
    FIG. 61 Technology Roadmap and Timeline
    FIG. 62 Market Attractiveness Analysis – By Type
    FIG. 63 Market Attractiveness Analysis – By Application
    FIG. 64 Market Attractiveness Analysis – By Region
    FIG. 65 Market Channel
    FIG. 66 Marketing Channel Development Trend
    FIG. 67 Growth in World Gross Product, 2008-2019

    List of Tables

    TABLE 1 Global Silver Nanowires Market, 2019 & 2026 (USD Million)
    TABLE 2 Global Silver Nanowires market, by Type, 2016-2026 (USD Million)
    TABLE 3 Global Silver Nanowires market, by Application, 2016-2026 (USD Million)
    TABLE 4 Global Silver Nanowires market, by Region, 2016-2026 (USD Million)
    TABLE 5 North America Silver Nanowires Market, by Type, 2016-2026 (USD Million)
    TABLE 6 North America Silver Nanowires Market, by Application, 2016-2026 (USD Million)
    TABLE 7 Europe Silver Nanowires Market, by Type, 2016-2026 (USD Million)
    TABLE 8 Europe Silver Nanowires Market, by Application, 2016-2026 (USD Million)
    TABLE 9 Asia Pacific Silver Nanowires Market, by Type, 2016-2026 (USD Million)
    TABLE 10 Asia Pacific Silver Nanowires Market, by Application, 2016-2026 (USD Million)
    TABLE 11 Latin America Silver Nanowires Market, by Type, 2016-2026 (USD Million)
    TABLE 12 Latin America Silver Nanowires Market, by Application, 2016-2026 (USD Million)
    TABLE 13 The Middle-East and Africa Silver Nanowires Market, by Type, 2016-2026 (USD Million)
    TABLE 14 The Middle-East and Africa Silver Nanowires Market, by Application, 2016-2026 (USD Million)
    TABLE 15 Global Silver Nanowires Market - Company Revenue Analysis 2016-2019 (USD Million)
    TABLE 16 Global Silver Nanowires Market - Company Revenue Share Analysis 2016-2019(%)
    TABLE 17 Acquisitions and Mergers
    TABLE 18 New Product/Service Launch
    TABLE 19 Research & Development Activities
    TABLE 20 Market Drivers
    TABLE 21 Market Restraints
    TABLE 22 Market Opportunities
  •  

    Industry Major Market Players

    •  Hua-Jie (Taiwan) Corp.
    •  NanoTech Labs Inc.
    •  Hefei Vigon Material Technology
    •  Americal Elements’
    •  Material Technologies Inc.
    •  Showa Denko K.K
    •  C3Nano
    •  Nanopyxis
    •  RAS AG Corporation