Search Market Research Report

Discover Our Latest Reports
Discover Our Featured Reports
Discover Top Selling Reports

Shipping Software Market Size, Share Global Analysis Report, 2020–2026

report img

Shipping Software Market By Type (Cloud-Based, and On-Premise) and By Application (Contract Logistics, Air & Ocean Forwarding, CEF, and Others): Global Industry Outlook, Market Size, Business Intelligence, Consumer Preferences, Statistical Surveys, Comprehensive Analysis, Historical Developments, Current Trends, and Forecast 2020–2026

Industry Insights

The global shipping software market report analyzes and notifies the industry statistics at the global as well as regional and country levels in order to acquire a thorough perspective of the entire shipping software market. The historical and past insights are provided for FY 2016 to FY 2019 whereas projected trends are delivered for FY 2020 to FY 2026. The quantitative and numerical data is represented in terms of value (USD Billion) from FY 2016 – 2026.

Shipping Software Market Size

To know more about this report | Request Free Sample Copy

This specialized and expertise-oriented industry research report scrutinizes the technical and commercial business outlook of the shipping software industry. The report analyzes and declares the historical and current trends analysis of the shipping software industry and subsequently recommends the projected trends anticipated to be observed in the shipping software market during the upcoming years.

logoKey Insights from Primary Research

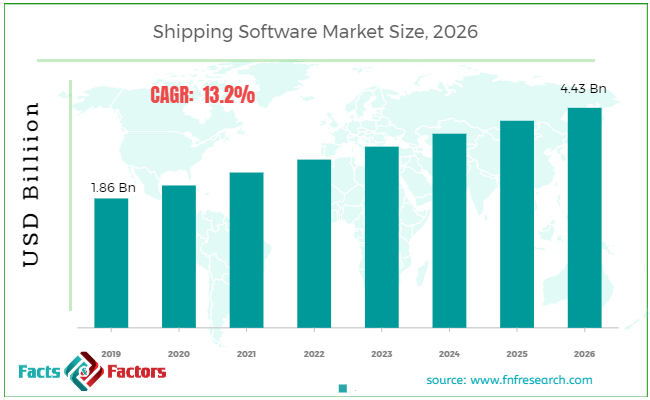
  • According to the primary CXOs of the global shipping software market, the market is estimated to witness a substantial growth of nearly 13.2% over the forecast period.
  • The market was valued at USD 1.86 billion, in 2019 and is expected to be valued at over USD 4.43 billion, by 2026.
  • On the basis of the product segment, on-premise dominated the global shipping software market in 2019. In terms of revenue, it accounted for more than a 60% share of the total market in 2019.
  • Application-wise, the contract logistics segment was the largest of the global shipping software market in 2019. It accounted for more than 36% of the total market share in 2019.
  • By geography, the North American region lead the market with a share of above 34%, in 2019.

logoKey Recommendations from Analysts

  • According to industry experts, escalating import, export, and trading industries across the globe are expected to propel the demand for shipping software in the near future.
  • Our analysts recommend that the rise of GDP of emerging economies such as China, India, Brazil, etc. is anticipated to grow consumer spending which in turn is expected to certainly influence the shipping software market over the estimated period.
  • The expansion of the e-commerce industry especially in emerging markets is anticipated to fuel the demand for shipping software in developing regions over the forthcoming years.
  • According to our analyst, increasing urbanization along with growth in disposable income, increase in the consumer's spending rate, etc. are some major driving forces of the global shipping software market.
  • Escalating deployment of shipping software among the small and medium scale logistic companies is project to accelerate the margin of the shipping software market.

The quantitative data is further underlined and reinforced by comprehensive qualitative data which comprises various across-the-board market dynamics. The rationales which directly or indirectly impact the shipping software industry are exemplified through parameters such as growth drivers, restraints, challenges, and opportunities among other impacting factors.

Throughout our research report, we have encompassed all the proven models and tools of industry analysis and extensively illustrated all the key business strategies and business models adopted in the shipping software industry. The report provides an all-inclusive and detailed competitive landscape prevalent in the Shipping Software market.

The report utilizes established industry analysis tools and models such as Porter’s Five Forces framework to analyze and recognize critical business strategies adopted by various stakeholders involved in the entire value chain of the shipping software industry. The shipping software market report additionally employs SWOT analysis and PESTLE analysis models for further in-depth analysis.

The report study further includes an in-depth analysis of industry players' market shares and provides an overview of leading players' market position in the shipping software sector. Key strategic developments in the shipping software market competitive landscape such as acquisitions & mergers, inaugurations of different products and services, partnerships & joint ventures, MoU agreements, VC & funding activities, R&D activities, and geographic expansion among other noteworthy activities by key players of the shipping software market are appropriately highlighted in the report.

The shipping software market research report delivers an acute valuation and taxonomy of the shipping software industry by practically splitting the market on the basis of different types, applications, and regions. Through the analysis of the historical and projected trends, all the segments and sub-segments were evaluated through the bottom-up approach, and different market sizes have been projected for FY 2020 to FY 2026.

logoReport Scope

Report Attribute

Details

Market Size in 2019

USD 1.86 Billion

Projected Market Size in 2026

USD 4.43 Billion

CAGR Growth Rate

13.2% CAGR

Base Year

2019

Forecast Years

2020-2026

Key Market Players

Metapack, Stamps.com, ProShip Inc., Ship Solutions, Logistyx Technologies, ShipHawk, Pitney Bowes, Epicor Software Corporation, Pierbridge, Malvern Systems, ReadyCloud, LLC, Shippo, Teapplix, Temando, V-Technologies, WiseTech Global, and Others

Key Segment

By Type, Application, and Region

Major Regions Covered

North America, Europe, Asia Pacific, Latin America, and the Middle East & Africa

Purchase Options

Request customized purchase options to meet your research needs. Explore purchase options

The regional segmentation of the shipping software industry includes the complete classification of all the major continents including North America, Latin America, Europe, Asia Pacific, and Middle East & Africa. Further, country-wise data for the shipping software industry is provided for the leading economies of the world.

The shipping software market is segmented based on type, application and region. On the basis of type segmentation, the market is classified into cloud-based, and on-premise. Based on application, the market is segregated into contract logistics, air & ocean forwarding, CEF, and others.

logoSome of the essential players operating in the shipping software market, but not restricted to include

  • Metapack
  • Stamps.com
  • ProShip Inc.
  • Ship Solutions
  • Logistyx Technologies
  • ShipHawk
  • Pitney Bowes
  • Epicor Software Corporation
  • Pierbridge
  • Malvern Systems
  • ReadyCloud LLC
  • Shippo
  • Teapplix
  • Temando
  • V-Technologies
  • WiseTech Global

The taxonomy of the shipping software industry by its scope and segmentation is as follows:

logo By Type Segmentation Analysis

  • Cloud-based
  • On-Premise

logo By Application Segmentation Analysis

  • Contract Logistics
  • Air & Ocean Forwarding
  • CEF
  • Others

logo Regional Segmentation Analysis

  • North America
    • The U.S.
    • Canada
  • Europe
    • Germany
    • The UK
    • France
    • Spain
    • Italy
    • Rest of Europe
  • Asia Pacific
    • China
    • Japan
    • India
    • South Korea
    • Southeast Asia
    • Rest of Asia Pacific
  • Latin America
    • Brazil
    • Mexico
    • Rest of Latin America
  • Middle East & Africa
    • GCC
    • South Africa
    • Rest of Middle East & Africa

Table of Content

  1. CHAPTER 1. Executive Summary
  2. CHAPTER 2. Shipping Software market – Type Analysis
    1. 2.1. Global Shipping Software Market–TypeOverview
    2. 2.2. Global Shipping SoftwareMarketShare, by Type, 2019 & 2026 (USD Million)
    3. 2.3. Cloud-Based
      1. 2.3.1. Global Cloud-BasedShipping SoftwareMarket,2016-2026 (USD Million)
    4. 2.4. On-Premise
      1. 2.4.1. Global On-PremiseShipping SoftwareMarket,2016-2026 (USD Million)
  3. CHAPTER 3. Shipping Software market – Application Analysis
    1. 3.1. Global Shipping Software Market–ApplicationOverview
    2. 3.2. Global Shipping SoftwareMarketShare, by Application, 2019 & 2026 (USD Million)
    3. 3.3. Contract Logistics
      1. 3.3.1. Global Contract LogisticsShipping SoftwareMarket,2016-2026 (USD Million)
    4. 3.4. Air & Ocean Forwarding
      1. 3.4.1. Global Air & Ocean ForwardingShipping SoftwareMarket,2016-2026 (USD Million)
    5. 3.5. CEF
      1. 3.5.1. Global CEFShipping SoftwareMarket,2016-2026 (USD Million)
    6. 3.6. Others
      1. 3.6.1. Global OthersShipping SoftwareMarket,2016-2026 (USD Million)
  4. CHAPTER 4. Shipping Software market – Regional Analysis
    1. 4.1. Global Shipping Software MarketRegionalOverview
    2. 4.2. Global Shipping SoftwareMarketShare, by Region, 2019 & 2026 (Value)
    3. 4.3. North America
      1. 4.3.1. North AmericaShipping Software Market size and forecast, 2016-2026
      2. 4.3.2. North AmericaShipping Software Market, by Country, 2019 & 2026 (USD Million)
      3. 4.3.3. North AmericaShipping Software Market, by Type, 2016-2026
        1. 4.3.3.1. North AmericaShipping Software Market, by Type, 2016-2026 (USD Million)
      4. 4.3.4. North AmericaShipping Software Market, by Application, 2016-2026
        1. 4.3.4.1. North AmericaShipping Software Market, by Application, 2016-2026 (USD Million)
      5. 4.3.5. U.S.
        1. 4.3.5.1. U.S. Market size and forecast, 2016-2026 (USD Million)
      6. 4.3.6. Canada
        1. 4.3.6.1. Canada Market size and forecast, 2016-2026 (USD Million)
    4. 4.4. Europe
      1. 4.4.1. EuropeShipping Software Market size and forecast, 2016-2026
      2. 4.4.2. EuropeShipping Software Market, by Country, 2019 & 2026 (USD Million)
      3. 4.4.3. EuropeShipping Software Market, by Type, 2016-2026
        1. 4.4.3.1. EuropeShipping Software Market, by Type, 2016-2026 (USD Million)
      4. 4.4.4. EuropeShipping Software Market, by Application, 2016-2026
        1. 4.4.4.1. EuropeShipping Software Market, by Application, 2016-2026 (USD Million)
      5. 4.4.5. Germany
        1. 4.4.5.1. Germany Market size and forecast, 2016-2026 (USD Million)
      6. 4.4.6. France
        1. 4.4.6.1. France Market size and forecast, 2016-2026 (USD Million)
      7. 4.4.7. U.K.
        1. 4.4.7.1. U.K. Market size and forecast, 2016-2026 (USD Million)
      8. 4.4.8. Italy
        1. 4.4.8.1. Italy Market size and forecast, 2016-2026 (USD Million)
      9. 4.4.9. Spain
        1. 4.4.9.1. Spain Market size and forecast, 2016-2026 (USD Million)
      10. 4.4.10. Rest of Europe
        1. 4.4.10.1. Rest of Europe Market size and forecast, 2016-2026 (USD Million)
    5. 4.5. Asia Pacific
      1. 4.5.1. Asia PacificShipping Software Market size and forecast, 2016-2026
      2. 4.5.2. Asia PacificShipping Software Market, by Country, 2019 & 2026 (USD Million)
      3. 4.5.3. Asia PacificShipping Software Market, by Type, 2016-2026
        1. 4.5.3.1. Asia PacificShipping Software Market, by Type, 2016-2026 (USD Million)
      4. 4.5.4. Asia PacificShipping Software Market, by Application, 2016-2026
        1. 4.5.4.1. Asia PacificShipping Software Market, by Application, 2016-2026 (USD Million)
      5. 4.5.5. China
        1. 4.5.5.1. China Market size and forecast, 2016-2026 (USD Million)
      6. 4.5.6. Japan
        1. 4.5.6.1. Japan Market size and forecast, 2016-2026 (USD Million)
      7. 4.5.7. India
        1. 4.5.7.1. India Market size and forecast, 2016-2026 (USD Million)
      8. 4.5.8. South Korea
        1. 4.5.8.1. South Korea Market size and forecast, 2016-2026 (USD Million)
      9. 4.5.9. South-East Asia
        1. 4.5.9.1. South-East Asia Market size and forecast, 2016-2026 (USD Million)
      10. 4.5.10. Rest of Asia Pacific
        1. 4.5.10.1. Rest of Asia Pacific Market size and forecast, 2016-2026 (USD Million)
    6. 4.6. Latin America
      1. 4.6.1. Latin AmericaShipping Software Market size and forecast, 2016-2026
      2. 4.6.2. Latin AmericaShipping Software Market, by Country, 2019 & 2026 (USD Million)
      3. 4.6.3. Latin AmericaShipping Software Market, by Type, 2016-2026
        1. 4.6.3.1. Latin AmericaShipping Software Market, by Type, 2016-2026 (USD Million)
      4. 4.6.4. Latin AmericaShipping Software Market, by Application, 2016-2026
        1. 4.6.4.1. Latin AmericaShipping Software Market, by Application, 2016-2026 (USD Million)
      5. 4.6.5. Brazil
        1. 4.6.5.1. Brazil Market size and forecast, 2016-2026 (USD Million)
      6. 4.6.6. Mexico
        1. 4.6.6.1. Mexico Market size and forecast, 2016-2026 (USD Million)
      7. 4.6.7. Rest of Latin America
        1. 4.6.7.1. Rest of Latin America Market size and forecast, 2016-2026 (USD Million)
    7. 4.7. The Middle-East and Africa
      1. 4.7.1. The Middle-East and AfricaShipping Software Market size and forecast, 2016-2026
      2. 4.7.2. The Middle-East and AfricaShipping Software Market, by Country, 2019 & 2026 (USD Million)
      3. 4.7.3. The Middle-East and AfricaShipping Software Market, by Type, 2016-2026
        1. 4.7.3.1. The Middle-East and AfricaShipping Software Market, by Type, 2016-2026 (USD Million)
      4. 4.7.4. The Middle-East and AfricaShipping Software Market, by Application, 2016-2026
        1. 4.7.4.1. The Middle-East and AfricaShipping Software Market, by Application, 2016-2026 (USD Million)
      5. 4.7.5. GCC Countries
        1. 4.7.5.1. GCC Countries Market size and forecast, 2016-2026 (USD Million)
      6. 4.7.6. South Africa
        1. 4.7.6.1. South Africa Market size and forecast, 2016-2026 (USD Million)
      7. 4.7.7. Rest of Middle-East Africa
        1. 4.7.7.1. Rest of Middle-East Africa Market size and forecast, 2016-2026 (USD Million)
  5. CHAPTER 5. Shipping Software market – Competitive Landscape
    1. 5.1. Competitor Market Share – Revenue
    2. 5.2. Market Concentration Rate Analysis, Top 3 and Top 5 Players
    3. 5.3. Strategic Development
      1. 5.3.1. Acquisitions and Mergers
      2. 5.3.2. New Products
      3. 5.3.3. Research & Development Activities
  6. CHAPTER 6. Company Profiles
    1. 6.1. Metapack
      1. 6.1.1. Company Overview
      2. 6.1.2. MetapackRevenue and Gross Margin
      3. 6.1.3. Product portfolio
      4. 6.1.4. Recent initiatives
    2. 6.2. Stamps.com
      1. 6.2.1. Company Overview
      2. 6.2.2. Stamps.comRevenue and Gross Margin
      3. 6.2.3. Product portfolio
      4. 6.2.4. Recent initiatives
    3. 6.3. ProShip Inc.
      1. 6.3.1. Company Overview
      2. 6.3.2. ProShip Inc.Revenue and Gross Margin
      3. 6.3.3. Product portfolio
      4. 6.3.4. Recent initiatives
    4. 6.4. Ship Solutions
      1. 6.4.1. Company Overview
      2. 6.4.2. Ship SolutionsRevenue and Gross Margin
      3. 6.4.3. Product portfolio
      4. 6.4.4. Recent initiatives
    5. 6.5. Logistyx Technologies
      1. 6.5.1. Company Overview
      2. 6.5.2. Logistyx TechnologiesRevenue and Gross Margin
      3. 6.5.3. Product portfolio
      4. 6.5.4. Recent initiatives
    6. 6.6. ShipHawk
      1. 6.6.1. Company Overview
      2. 6.6.2. ShipHawkRevenue and Gross Margin
      3. 6.6.3. Product portfolio
      4. 6.6.4. Recent initiatives
    7. 6.7. Pitney Bowes
      1. 6.7.1. Company Overview
      2. 6.7.2. Pitney BowesRevenue and Gross Margin
      3. 6.7.3. Product portfolio
      4. 6.7.4. Recent initiatives
    8. 6.8. Epicor Software Corporation
      1. 6.8.1. Company Overview
      2. 6.8.2. Epicor Software CorporationRevenue and Gross Margin
      3. 6.8.3. Product portfolio
      4. 6.8.4. Recent initiatives
    9. 6.9. Pierbridge
      1. 6.9.1. Company Overview
      2. 6.9.2. PierbridgeRevenue and Gross Margin
      3. 6.9.3. Product portfolio
      4. 6.9.4. Recent initiatives
    10. 6.10. Malvern Systems
      1. 6.10.1. Company Overview
      2. 6.10.2. Malvern SystemsRevenue and Gross Margin
      3. 6.10.3. Product portfolio
      4. 6.10.4. Recent initiatives
    11. 6.11. ReadyCloud
      1. 6.11.1. Company Overview
      2. 6.11.2. ReadyCloudRevenue and Gross Margin
      3. 6.11.3. Product portfolio
      4. 6.11.4. Recent initiatives
    12. 6.12. LLC
      1. 6.12.1. Company Overview
      2. 6.12.2. LLCRevenue and Gross Margin
      3. 6.12.3. Product portfolio
      4. 6.12.4. Recent initiatives
    13. 6.13. Shippo
      1. 6.13.1. Company Overview
      2. 6.13.2. ShippoRevenue and Gross Margin
      3. 6.13.3. Product portfolio
      4. 6.13.4. Recent initiatives
    14. 6.14. Teapplix
      1. 6.14.1. Company Overview
      2. 6.14.2. TeapplixRevenue and Gross Margin
      3. 6.14.3. Product portfolio
      4. 6.14.4. Recent initiatives
    15. 6.15. Temando
      1. 6.15.1. Company Overview
      2. 6.15.2. TemandoRevenue and Gross Margin
      3. 6.15.3. Product portfolio
      4. 6.15.4. Recent initiatives
    16. 6.16. V-Technologies
      1. 6.16.1. Company Overview
      2. 6.16.2. V-TechnologiesRevenue and Gross Margin
      3. 6.16.3. Product portfolio
      4. 6.16.4. Recent initiatives
    17. 6.17. WiseTech Global
      1. 6.17.1. Company Overview
      2. 6.17.2. WiseTech GlobalRevenue and Gross Margin
      3. 6.17.3. Product portfolio
      4. 6.17.4. Recent initiatives
  7. CHAPTER 7. Shipping Software — Industry Analysis
    1. 7.1. Shipping Software Market – Key Trends
      1. 7.1.1. Market Drivers
      2. 7.1.2. Market Restraints
      3. 7.1.3. Market Opportunities
    2. 7.2. Value Chain Analysis
    3. 7.3. Technology Roadmap and Timeline
    4. 7.4. Shipping Software Market – Attractiveness Analysis
      1. 7.4.1. By Type
      2. 7.4.2. By Application
      3. 7.4.3. By Region
  8. CHAPTER 8. Marketing Strategy Analysis, Distributors
    1. 8.1. Marketing Channel
    2. 8.2. Direct Marketing
    3. 8.3. Indirect Marketing
    4. 8.4. Marketing Channel Development Trend
    5. 8.5. Economic/Political Environmental Change
  9. CHAPTER 9. Report Conclusion
  10. CHAPTER 10. Research Approach & Methodology
    1. 10.1. Report Description
    2. 10.2. Research Scope
    3. 10.3. Research Methodology
      1. 10.3.1. Secondary Research
      2. 10.3.2. Primary Research
      3. 10.3.3. Models
        1. 10.3.3.1. Company Share Analysis Model
        2. 10.3.3.2. Revenue Based Modeling
        3. 10.3.3.3. Research Limitations

  • List of Figures

    FIG. 1 Global Shipping Software Market, 2016-2026(USD Million)
    FIG. 2 Global Shipping Software MarketShare, by Type, 2019 & 2026 (USD Million)
    FIG. 3 Global Cloud-BasedShipping Software Market,2016-2026 (USD Million)
    FIG. 4 Global On-PremiseShipping Software  Market,2016-2026 (USD Million)
    FIG. 5 Global Shipping Software MarketShare, by Application, 2019 & 2026 (USD Million)
    FIG. 6 Global Contract LogisticsShipping SoftwareMarket,2016-2026 (USD Million)
    FIG. 7 Global Air & Ocean ForwardingShipping SoftwareMarket,2016-2026 (USD Million)
    FIG. 8 Global CEFShipping SoftwareMarket,2016-2026 (USD Million)
    FIG. 9 Global OthersShipping SoftwareMarket,2016-2026 (USD Million)
    FIG. 10 Global Shipping Software MarketShare, by Region, 2019 & 2026
    FIG. 11 North AmericaShipping Software Market, 2016-2026
    FIG. 12 U.S.Shipping Software Market, 2016-2026
    FIG. 13 CanadaShipping Software Market, 2016-2026
    FIG. 14 EuropeShipping Software Market, 2016-2026
    FIG. 15 GermanyShipping Software Market, 2016-2026
    FIG. 16 FranceShipping Software Market, 2016-2026
    FIG. 17 U.K.Shipping Software Market, 2016-2026
    FIG. 18 ItalyShipping Software Market, 2016-2026
    FIG. 19 SpainShipping Software Market, 2016-2026
    FIG. 20 Rest of EuropeShipping Software Market, 2016-2026
    FIG. 21 Asia PacificShipping Software Market, 2016-2026
    FIG. 22 ChinaShipping Software Market, 2016-2026
    FIG. 23 JapanShipping Software Market, 2016-2026
    FIG. 24 IndiaShipping Software Market, 2016-2026
    FIG. 25 South  KoreaShipping Software Market, 2016-2026
    FIG. 26 South-East AsiaShipping Software Market, 2016-2026
    FIG. 27 Rest of Asia PacificShipping Software Market, 2016-2026
    FIG. 28 Latin AmericaShipping Software Market, 2016-2026
    FIG. 29 BrazilShipping Software Market, 2016-2026
    FIG. 30 MexicoShipping Software Market, 2016-2026
    FIG. 31 Rest of Latin AmericaShipping Software Market, 2016-2026
    FIG. 32 The Middle-East and AfricaShipping Software Market, 2016-2026
    FIG. 33 GCC CountriesShipping Software Market, 2016-2026
    FIG. 34 South AfricaShipping Software Market, 2016-2026
    FIG. 35 Rest of Middle-East AfricaShipping Software Market, 2016-2026
    FIG. 36 Competitor Market Share – Revenue
    FIG. 37 Metapack Revenue and Growth Rate
    FIG. 38 Metapack Market Share
    FIG. 39 Stamps.com Revenue and Growth Rate
    FIG. 40 Stamps.com Market Share
    FIG. 41 ProShip Inc. Revenue and Growth Rate
    FIG. 42 ProShip Inc. Market Share
    FIG. 43 Ship Solutions Revenue and Growth Rate
    FIG. 44 Ship Solutions Market Share
    FIG. 45 Logistyx Technologies Revenue and Growth Rate
    FIG. 46 Logistyx Technologies Market Share
    FIG. 47 ShipHawk Revenue and Growth Rate
    FIG. 48 ShipHawk Market Share
    FIG. 49 Pitney Bowes Revenue and Growth Rate
    FIG. 50 Pitney Bowes Market Share
    FIG. 51 Epicor Software Corporation Revenue and Growth Rate
    FIG. 52 Epicor Software Corporation Market Share
    FIG. 53 Pierbridge Revenue and Growth Rate
    FIG. 54 Pierbridge Market Share
    FIG. 55 Malvern Systems Revenue and Growth Rate
    FIG. 56 Malvern Systems Market Share
    FIG. 57 ReadyCloud Revenue and Growth Rate
    FIG. 58 ReadyCloud Market Share
    FIG. 59 LLC Revenue and Growth Rate
    FIG. 60 LLC Market Share
    FIG. 61 Shippo Revenue and Growth Rate
    FIG. 62 Shippo Market Share
    FIG. 63 Teapplix Revenue and Growth Rate
    FIG. 64 Teapplix Market Share
    FIG. 65 Temando Revenue and Growth Rate
    FIG. 66 Temando Market Share
    FIG. 67 V-Technologies Revenue and Growth Rate
    FIG. 68 V-Technologies Market Share
    FIG. 69 WiseTech Global Revenue and Growth Rate
    FIG. 70 WiseTech Global Market Share
    FIG. 71 Market Dynamics
    FIG. 72 Global Shipping Software – Value Chain Analysis
    FIG. 73 Technology Roadmap and Timeline
    FIG. 74 Market Attractiveness Analysis – By Type
    FIG. 75 Market Attractiveness Analysis – By Application
    FIG. 76 Market Attractiveness Analysis – By Region
    FIG. 77 Market Channel
    FIG. 78 Marketing Channel Development Trend
    FIG. 79 Growth in World Gross Product, 2008-2019

    List of Tables

    TABLE 1 Global Shipping Software Market, 2019& 2026 (USD Million)
    TABLE 2 Global Shipping Software market, by Type, 2016-2026 (USD Million)
    TABLE 3 Global Shipping Software market, by Application, 2016-2026 (USD Million)
    TABLE 4 Global Shipping Software market, by Region, 2016-2026 (USD Million)
    TABLE 5 North AmericaShipping Software Market, by Type, 2016-2026 (USD Million)
    TABLE 6 North AmericaShipping Software Market, by Application, 2016-2026 (USD Million)
    TABLE 7 EuropeShipping Software Market, by Type, 2016-2026 (USD Million)
    TABLE 8 EuropeShipping Software Market, by Application, 2016-2026 (USD Million)
    TABLE 9 Asia PacificShipping Software Market, by Type, 2016-2026 (USD Million)
    TABLE 10 Asia PacificShipping Software Market, by Application, 2016-2026 (USD Million)
    TABLE 11 Latin AmericaShipping Software Market, by Type, 2016-2026 (USD Million)
    TABLE 12 Latin AmericaShipping Software Market, by Application, 2016-2026 (USD Million)
    TABLE 13 The Middle-East and AfricaShipping Software Market, by Type, 2016-2026 (USD Million)
    TABLE 14 The Middle-East and AfricaShipping Software Market, by Application, 2016-2026 (USD Million)
    TABLE 15 Global Shipping Software Market - Company Revenue Analysis 2016-2019 (USD Million)
    TABLE 16 Global Shipping Software Market - Company Revenue Share Analysis 2016-2019(%)
    TABLE 17 Acquisitions and Mergers
    TABLE 18 New Product/Service Launch
    TABLE 19 Research & Development Activities
    TABLE 20 Market Drivers
    TABLE 21 Market Restraints
    TABLE 22 Market Opportunities
  •  

    Industry Major Market Players

    • Metapack
    • Stamps.com
    • ProShip Inc.
    • Ship Solutions
    • Logistyx Technologies
    • ShipHawk
    • Pitney Bowes
    • Epicor Software Corporation
    • Pierbridge
    • Malvern Systems
    • ReadyCloud LLC
    • Shippo
    • Teapplix
    • Temando
    • V-Technologies
    • WiseTech Global