Search Market Research Report

Discover Our Latest Reports
Discover Our Featured Reports
Discover Top Selling Reports

Shipbroking Market Size, Share Global Analysis Report, 2019–2026

report img

Shipbroking Market By Services (Chartering, Sale and Purchase, Offshore, New Buildings and Salvage & Towage) and By Verticals (Oil and Gas, Manufacturing, Aerospace and Defense, Government and Others): Global Industry Perspective, Market Size, Statistical Research, Market Intelligence, Comprehensive Analysis, Historical Trends, and Forecast 2019–2026

Industry Insights

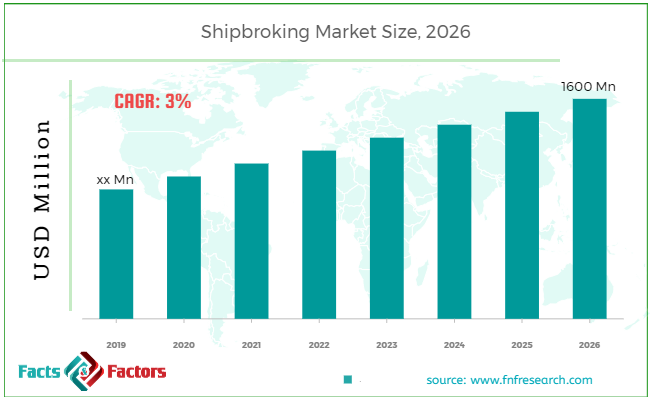
[110+ Pages Report] According to the report published by Facts Factors, the global shipbroking market size was worth around USD 1600 million by 2026 with a compound annual growth rate (CAGR) of roughly 3% between 2020 and 2026. The report analyzes the global shipbroking market drivers, restraints/challenges, and the effect they have on the demands during the projection period. In addition, the report explores emerging opportunities in the shipbroking market.

Shipbroking Market Size

To know more about this report | Request Free Sample Copy

This professional and specialized report study examines the technical and business perspective of the shipbroking industry. The report provides a historical analysis of the industry as well as the projected trends expected to be witnessed in the shipbroking market. The report study analyzes the market statistics at the global as well as the regional levels to gain an in-depth perspective of the overall shipbroking market. The historical insights are provided from 2016 to 2019 and projected trends are provided from 2020 to 2026.

The quantitative data is provided in terms of value (USD Million) for 2016 – 2026. The qualitative data is reinforced by analyzing and providing numerous market dynamics (directly or indirectly affecting the industry) such as growth drivers, restraints, challenges, and opportunities.

We have included various industry analysis models in our report and extensively demonstrated the key business strategies and competitive landscape of the shipbroking market in our study.


logoKey Insights from Primary Research

  • Wide ranging interviews with high ranking representatives of major shipbroking companies provided factual qualitative and quantitative insights of shipbroking market. The overallinsights obtained from the interviews projects for steadygrowth of shipbroking marketin vicinity of 3% CAGR during forecast period of 2020 to 2026.
  • The intervieweesanticipate the global shipbroking market value to surpass the figure of USD 1600 Million. The market projections of primary respondents were validated after comparison with our secondary researchundertaken by experienced analyst team.
  • The chartering service is expected to remain most sought after service by contributing for more than 50 % of total market share. The respondents also believe in offshore services to register steady growth while continuing to remain second most shipbroking service in demand.
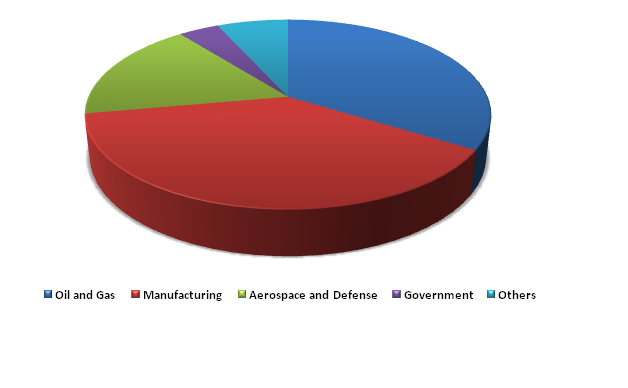
  • The manufacturing sector and the oil and gas sector are anticipated to remain major source of revenue contribution among the verticals. These verticals are anticipated to hold more than 70 % segmental market share.
  • Regionally, Asia-Pacific region is expected to exhibit highest growth among regions. European region is projected to be second largest market for shipbroking industry.

logoKey Recommendations from Analysts

  • Primary insights garnered through regional analysis suggests for greater business potential in Asia Pacific market especially in major manufacturing like China, Japan and Korea. Additionally, India is also expected to see an up rise in manufacturing sector.
  • Establishing shipbroking offices in APAC countries will provide opportunities in early holding and expansion of business.
  • Shipbroking partners are expected to remain key contributors in business growth in new regions. The marketing expertise and client relations will drive the business growth. Additionally, quantity will also play important role as more number of shipbrokers will help in increasing the customer base.
  • Modern technology adoption is expected to act as key factor in competitive environment wherein major shipbroking companies are increasing incorporating new technologies in improving market monitoring and analytics.

logoMarket Attractiveness – By Verticals 2026

Shipbroking Market

To know more about this report | Request Free Sample Copy


Our study also includes an analysis of Porter’s Five Forces framework for understanding the competitive strategies adopted by various stakeholders involved in the entire value chain of the shipbroking market. It also encompasses PESTLE analysis and SWOT analysis.

The report also offers an in-depth analysis of the market shares of each industry player and gives an outline of the market position of key players in the shipbroking market. Moreover, the study offers wide coverage of key strategic advances witnessed in the market such as new product launches, acquisitions & mergers, collaborations & joint ventures, funding & VC activities, agreements, partnerships, R&D activities, and regional expansion of key players of the shipbroking market.

The research study provides a critical assessment of the shipbroking industry by logically segmenting the market on the basis of services, verticals and regions. Based on the past, present, and future trends, all the segments were analyzed from the bottom up, and the market sizes have been estimated from 2020 to 2026. The regional segmentation of the shipbroking industry includes the holistic bifurcation of all the five major continents including North America, Europe, Asia Pacific, Latin America, and the Middle East & Africa.

Major transportation across the globe is conducted by sea route in terms of volume and value. The global shipping volume has been increasing year on year in parallel with the increase in seaborne trade across globe. Furthermore, digitization has been enhancing the communications on various digital platforms. The combination of rising seaborne trade and digitization in the shipbroking industry has been the primary driver for the growth of the shipbroking market.

Additionally, shipbrokers are playing an important role in providing consultation services. These shipbrokers through modern technologies are providing wide-ranging statistical inputs and expertise of the freight market to clients. Shipbrokers have also been in demand for providing professional legal assistance in resolving disputes raised in legal matters. The advantages gained through hiring shipbrokers have increased the demand for shipbroking services which in turn have propelled the growth of the shipbroking market.

The shipbroking market is segmented based on services and verticals.  On the basis of services segmentation, the market is classified into chartering, sale and purchase, offshore, new buildings and salvage & towage. In terms of verticals segmentation, the market is bifurcated into oil and gas, manufacturing, aerospace and defense, government and others.

logoReport Scope

Report Attribute

Details

Market Size in 2019

USD XX Billion

Projected Market Size in 2026

USD 1600 Million

CAGR Growth Rate

3% CAGR

Base Year

2019

Forecast Years

2020-2026

Key Market Players

Barry RoglianoSalles International S.A, Braemar Shipping Services PLC, Bright Cook & Co (S&P) Limited, Charles R. Weber Company, Inc., CLARKSON PLC, Compass Maritime Services, LLC, E.A. Gibson Shipbrokers Ltd, Howe Robinson Partners, INTEROCEAN SHIPPING COMPANY, Maersk Broker K/S, McQuilling Partners, Inc., Poten and Partners Group, Inc., Simpson Spence Young, SPI Marine, and Velian Ship Brokers.

Key Segment

By Services, By Verticals, By Region

Major Regions Covered

North America, Europe, Asia Pacific, Latin America, and the Middle East & Africa

Purchase Options

Request customized purchase options to meet your research needs. Explore purchase options

logoSome of the essential players operating in the shipbroking market, but not restricted to include

  • Barry RoglianoSalles International S.A
  • Braemar Shipping Services PLC
  • Bright Cook & Co (S&P) Limited
  • Charles R. Weber Company Inc.
  • CLARKSON PLC
  • Compass Maritime Services
  • LLC
  • E.A. Gibson Shipbrokers Ltd
  • Howe Robinson Partners
  • INTEROCEAN SHIPPING COMPANY
  • Maersk Broker K/S
  • McQuilling Partners Inc.
  • Poten  Partners Group Inc.
  • Simpson Spence Young
  • SPI Marine
  • Velian Ship Brokers.

The taxonomy of the shipbroking industry by its scope and segmentation is as follows:

logoBy ServicesSegmentation Analysis

  • Chartering 
  • Sale and Purchase 
  • Offshore 
  • New Buildings 
  • Salvage and Towage

logoBy Verticals Segmentation Analysis

  • Oil and Gas 
  • Manufacturing 
  • Aerospace and Defense 
  • Government 
  • Others 

logoBy Regional Segmentation Analysis

  • North America
    • The U.S.
    • Canada
  • Europe
    • France
    • The UK
    • Spain
    • Germany
    • Italy
    • Rest of Europe
  • Asia Pacific
    • China
    • Japan
    • India
    • South Korea
    • Southeast Asia
    • Rest of Asia Pacific
  • Latin America
    • Brazil
    • Mexico
    • Rest of Latin America
  • Middle East & Africa
    • GCC
    • South Africa
    • Rest of Middle East & Africa

logoKEY BUSINESS POINTERS ADDRESSED & FOREMOST REASONS TO PROCURE THE REPORT:

  • Statistical Analysis of the Past, Current, and Future Trends of the Industry with Validated Market Sizes Data
  • Direct and Indirect Rationales Impacting the Industry
  • In-depth and Micro Analysis of Viable Segments and Sub-segments
  • Companies and Vendors Market Share, Competitive Landscape, and Player Positioning Analysis
  • Demand Side (Consumption) and Supply Side (Production) Perspective and Analysis wherever applicable
  • Key Buyers and End-Users Analysis
  • Value Chain and Manufacturing Cost Structure Analysis wherever relevant
  • Key Marketing Strategies as well as Key Sales Channels adopted in the market
  • Investment Opportunity Analysis & Patents Analysis wherever feasible
  • Technological Road Map & Technical Analysis
  • Robust Research Methodology comprising dynamic mix (65%~35%) of Extensive Primary Research (primary interviews, ad-hoc surveys, questionnaires) and Protracted Secondary Research (proprietary in-house database, paid external databases, publically available validated sources)

Table of Content

  1. CHAPTER 1. Executive Summary
  2. CHAPTER 2. Shipbroking market – Services Analysis
    1. 2.1. Global Shipbroking Market – Services Overview
    2. 2.2. Global Shipbroking Market Share, by Services, 2019 & 2026 (USD Million)
    3. 2.3. Chartering
      1. 2.3.1. Global Chartering Shipbroking Market, 2016-2026 (USD Million)
    4. 2.4. Sale and Purchase
      1. 2.4.1. Global Sale and Purchase Shipbroking Market, 2016-2026 (USD Million)
    5. 2.5. Offshore
      1. 2.5.1. Global Offshore Shipbroking Market, 2016-2026 (USD Million)
    6. 2.6. New Buildings
      1. 2.6.1. Global New Buildings Shipbroking Market, 2016-2026 (USD Million)
    7. 2.7. Salvage and Towage
      1. 2.7.1. Global Salvage and Towage Shipbroking Market, 2016-2026 (USD Million)
  3. CHAPTER 3. Shipbroking market – Verticals Analysis
    1. 3.1. Global Shipbroking Market – Verticals Overview
    2. 3.2. Global Shipbroking Market Share, by Verticals, 2019 & 2026 (USD Million)
    3. 3.3. Oil and Gas
      1. 3.3.1. Global Oil and Gas Shipbroking Market, 2016-2026 (USD Million)
    4. 3.4. Manufacturing
      1. 3.4.1. Global Manufacturing Shipbroking Market, 2016-2026 (USD Million)
    5. 3.5. Aerospace and Defense
      1. 3.5.1. Global Aerospace and Defense Shipbroking Market, 2016-2026 (USD Million)
    6. 3.6. Government
      1. 3.6.1. Global Government Shipbroking Market, 2016-2026 (USD Million)
    7. 3.7. Others
      1. 3.7.1. Global Others Shipbroking Market, 2016-2026 (USD Million)
  4. CHAPTER 4. Shipbroking market – Regional Analysis
    1. 4.1. Global Shipbroking Market Regional Overview
    2. 4.2. Global Shipbroking Market Share, by Region, 2019 & 2026 (Value)
    3. 4.3. North America
      1. 4.3.1. North America Shipbroking Market size and forecast, 2016-2026
      2. 4.3.2. North America Shipbroking Market, by Country, 2019 & 2026 (USD Million)
      3. 4.3.3. North America Shipbroking Market, by Services, 2016-2026
        1. 4.3.3.1. North America Shipbroking Market, by Services, 2016-2026 (USD Million)
      4. 4.3.4. North America Shipbroking Market, by Verticals, 2016-2026
        1. 4.3.4.1. North America Shipbroking Market, by Verticals, 2016-2026 (USD Million)
      5. 4.3.5. U.S.
        1. 4.3.5.1. U.S. Market size and forecast, 2016-2026 (USD Million)
      6. 4.3.6. Canada
        1. 4.3.6.1. Canada Market size and forecast, 2016-2026 (USD Million)
    4. 4.4. Europe
      1. 4.4.1. Europe Shipbroking Market size and forecast, 2016-2026
      2. 4.4.2. Europe Shipbroking Market, by Country, 2019 & 2026 (USD Million)
      3. 4.4.3. Europe Shipbroking Market, by Services, 2016-2026
        1. 4.4.3.1. Europe Shipbroking Market, by Services, 2016-2026 (USD Million)
      4. 4.4.4. Europe Shipbroking Market, by Verticals, 2016-2026
        1. 4.4.4.1. Europe Shipbroking Market, by Verticals, 2016-2026 (USD Million)
      5. 4.4.5. Germany
        1. 4.4.5.1. Germany Market size and forecast, 2016-2026 (USD Million)
      6. 4.4.6. France
        1. 4.4.6.1. France Market size and forecast, 2016-2026 (USD Million)
      7. 4.4.7. U.K.
        1. 4.4.7.1. U.K. Market size and forecast, 2016-2026 (USD Million)
      8. 4.4.8. Italy
        1. 4.4.8.1. Italy Market size and forecast, 2016-2026 (USD Million)
      9. 4.4.9. Spain
        1. 4.4.9.1. Spain Market size and forecast, 2016-2026 (USD Million)
      10. 4.4.10. Rest of Europe
        1. 4.4.10.1. Rest of Europe Market size and forecast, 2016-2026 (USD Million)
    5. 4.5. Asia Pacific
      1. 4.5.1. Asia Pacific Shipbroking Market size and forecast, 2016-2026
      2. 4.5.2. Asia Pacific Shipbroking Market, by Country, 2019 & 2026 (USD Million)
      3. 4.5.3. Asia Pacific Shipbroking Market, by Services, 2016-2026
        1. 4.5.3.1. Asia Pacific Shipbroking Market, by Services, 2016-2026 (USD Million)
      4. 4.5.4. Asia Pacific Shipbroking Market, by Verticals, 2016-2026
        1. 4.5.4.1. Asia Pacific Shipbroking Market, by Verticals, 2016-2026 (USD Million)
      5. 4.5.5. China
        1. 4.5.5.1. China Market size and forecast, 2016-2026 (USD Million)
      6. 4.5.6. Japan
        1. 4.5.6.1. Japan Market size and forecast, 2016-2026 (USD Million)
      7. 4.5.7. India
        1. 4.5.7.1. India Market size and forecast, 2016-2026 (USD Million)
      8. 4.5.8. South Korea
        1. 4.5.8.1. South Korea Market size and forecast, 2016-2026 (USD Million)
      9. 4.5.9. South-East Asia
        1. 4.5.9.1. South-East Asia Market size and forecast, 2016-2026 (USD Million)
      10. 4.5.10. Rest of Asia Pacific
        1. 4.5.10.1. Rest of Asia Pacific Market size and forecast, 2016-2026 (USD Million)
    6. 4.6. Latin America
      1. 4.6.1. Latin America Shipbroking Market size and forecast, 2016-2026
      2. 4.6.2. Latin America Shipbroking Market, by Country, 2019 & 2026 (USD Million)
      3. 4.6.3. Latin America Shipbroking Market, by Services, 2016-2026
        1. 4.6.3.1. Latin America Shipbroking Market, by Services, 2016-2026 (USD Million)
      4. 4.6.4. Latin America Shipbroking Market, by Verticals, 2016-2026
        1. 4.6.4.1. Latin America Shipbroking Market, by Verticals, 2016-2026 (USD Million)
      5. 4.6.5. Brazil
        1. 4.6.5.1. Brazil Market size and forecast, 2016-2026 (USD Million)
      6. 4.6.6. Mexico
        1. 4.6.6.1. Mexico Market size and forecast, 2016-2026 (USD Million)
      7. 4.6.7. Rest of Latin America
        1. 4.6.7.1. Rest of Latin America Market size and forecast, 2016-2026 (USD Million)
    7. 4.7. The Middle-East and Africa
      1. 4.7.1. The Middle-East and Africa Shipbroking Market size and forecast, 2016-2026
      2. 4.7.2. The Middle-East and Africa Shipbroking Market, by Country, 2019 & 2026 (USD Million)
      3. 4.7.3. The Middle-East and Africa Shipbroking Market, by Services, 2016-2026
        1. 4.7.3.1. The Middle-East and Africa Shipbroking Market, by Services, 2016-2026 (USD Million)
      4. 4.7.4. The Middle-East and Africa Shipbroking Market, by Verticals, 2016-2026
        1. 4.7.4.1. The Middle-East and Africa Shipbroking Market, by Verticals, 2016-2026 (USD Million)
      5. 4.7.5. GCC Countries
        1. 4.7.5.1. GCC Countries Market size and forecast, 2016-2026 (USD Million)
      6. 4.7.6. South Africa
        1. 4.7.6.1. South Africa Market size and forecast, 2016-2026 (USD Million)
      7. 4.7.7. Rest of Middle-East Africa
        1. 4.7.7.1. Rest of Middle-East Africa Market size and forecast, 2016-2026 (USD Million)
  5. CHAPTER 5. Shipbroking market – Competitive Landscape
    1. 5.1. Competitor Market Share – Revenue
    2. 5.2. Market Concentration Rate Analysis, Top 3 and Top 5 Players
    3. 5.3. Strategic Development
      1. 5.3.1. Acquisitions and Mergers
      2. 5.3.2. New Products
      3. 5.3.3. Research & Development Activities
  6. CHAPTER 6. Company Profiles
    1. 6.1. Barry Rogliano Salles International S.A
      1. 6.1.1. Company Overview
      2. 6.1.2. Barry Rogliano Salles International S.A Revenue and Gross Margin
      3. 6.1.3. Product portfolio
      4. 6.1.4. Recent initiatives
    2. 6.2. Braemar Shipping Services PLC
      1. 6.2.1. Company Overview
      2. 6.2.2. Braemar Shipping Services PLC Revenue and Gross Margin
      3. 6.2.3. Product portfolio
      4. 6.2.4. Recent initiatives
    3. 6.3. Bright Cook & Co (S&P) Limited
      1. 6.3.1. Company Overview
      2. 6.3.2. Bright Cook & Co (S&P) Limited Revenue and Gross Margin
      3. 6.3.3. Product portfolio
      4. 6.3.4. Recent initiatives
    4. 6.4. Charles R. Weber Company, Inc.
      1. 6.4.1. Company Overview
      2. 6.4.2. Charles R. Weber Company, Inc. Revenue and Gross Margin
      3. 6.4.3. Product portfolio
      4. 6.4.4. Recent initiatives
    5. 6.5. CLARKSON PLC
      1. 6.5.1. Company Overview
      2. 6.5.2. CLARKSON PLC Revenue and Gross Margin
      3. 6.5.3. Product portfolio
      4. 6.5.4. Recent initiatives
    6. 6.6. Compass Maritime Services, LLC
      1. 6.6.1. Company Overview
      2. 6.6.2. Compass Maritime Services, LLC Revenue and Gross Margin
      3. 6.6.3. Product portfolio
      4. 6.6.4. Recent initiatives
        1. 6.7. E.A. Gibson Shipbrokers Ltd
      5. 6.7.1. Company Overview
        1. 6.7.2. E.A. Gibson Shipbrokers Ltd Revenue and Gross Margin
    7. 6.7.3. Product portfolio
    8. 6.7.4. Recent initiatives
  7. 6.8. Howe Robinson Partners
    1. 6.8.1. Company Overview
    2. 6.8.2. Howe Robinson Partners Revenue and Gross Margin
    3. 6.8.3. Product portfolio
    4. 6.8.4. Recent initiatives
  8. 6.9. INTEROCEAN SHIPPING COMPANY
    1. 6.9.1. Company Overview
    2. 6.9.2. INTEROCEAN SHIPPING COMPANY Revenue and Gross Margin
    3. 6.9.3. Product portfolio
    4. 6.9.4. Recent initiatives
  9. 6.10. Maersk Broker K/S
    1. 6.10.1. Company Overview
    2. 6.10.2. Maersk Broker K/S Revenue and Gross Margin
    3. 6.10.3. Product portfolio
    4. 6.10.4. Recent initiatives
  10. 6.11. McQuilling Partners, Inc.
    1. 6.11.1. Company Overview
    2. 6.11.2. McQuilling Partners, Inc. Revenue and Gross Margin
    3. 6.11.3. Product portfolio
    4. 6.11.4. Recent initiatives
  11. 6.12. Poten and Partners Group, Inc.
    1. 6.12.1. Company Overview
    2. 6.12.2. Poten and Partners Group, Inc. Revenue and Gross Margin
    3. 6.12.3. Product portfolio
    4. 6.12.4. Recent initiatives
  12. 6.13. Simpson Spence Young
    1. 6.13.1. Company Overview
    2. 6.13.2. Simpson Spence Young Revenue and Gross Margin
    3. 6.13.3. Product portfolio
    4. 6.13.4. Recent initiatives
  13. 6.14. SPI Marine
    1. 6.14.1. Company Overview
    2. 6.14.2. SPI Marine Revenue and Gross Margin
    3. 6.14.3. Product portfolio
    4. 6.14.4. Recent initiatives
  14. 6.15. Velian Ship Brokers
    1. 6.15.1. Company Overview
    2. 6.15.2. Velian Ship Brokers Revenue and Gross Margin
    3. 6.15.3. Product portfolio
    4. 6.15.4. Recent initiatives
  • CHAPTER 7. Shipbroking — Industry Analysis
    1. 7.1. Shipbroking Market – Key Trends
      1. 7.1.1. Market Drivers
      2. 7.1.2. Market Restraints
      3. 7.1.3. Market Opportunities
    2. 7.2. Value Chain Analysis
    3. 7.3. Technology Roadmap and Timeline
    4. 7.4. Shipbroking Market – Attractiveness Analysis
      1. 7.4.1. By Services
      2. 7.4.2. By Verticals
      3. 7.4.3. By Region
  • CHAPTER 8. Marketing Strategy Analysis, Distributors
    1. 8.1. Marketing Channel
    2. 8.2. Direct Marketing
    3. 8.3. Indirect Marketing
    4. 8.4. Marketing Channel Development Trend
    5. 8.5. Economic/Political Environmental Change
  • CHAPTER 9. Report Conclusion
  • CHAPTER 10. Research Approach & Methodology
    1. 10.1. Report Description
    2. 10.2. Research Scope
    3. 10.3. Research Methodology
      1. 10.3.1. Secondary Research
      2. 10.3.2. Primary Research
      3. 10.3.3. Models
        1. 10.3.3.1. Company Share Analysis Model
        2. 10.3.3.2. Revenue Based Modeling
        3. 10.3.3.3. Research Limitations

  • List of Figures

    FIG. 1    Global Shipbroking Market, 2016-2026 (USD Million)
    FIG. 2    Global Shipbroking Market Share, by Services, 2019 & 2026 (USD Million)
    FIG. 3    Global Chartering Shipbroking Market, 2016-2026 (USD Million)
    FIG. 4    Global Sale and Purchase Shipbroking Market, 2016-2026 (USD Million)
    FIG. 5    Global Offshore Shipbroking Market, 2016-2026 (USD Million)
    FIG. 6    Global New Buildings Shipbroking Market, 2016-2026 (USD Million)
    FIG. 7    Global Salvage and Towage Shipbroking Market, 2016-2026 (USD Million)
    FIG. 8    Global Shipbroking Market Share, by Verticals, 2019 & 2026 (USD Million)
    FIG. 9    Global Oil and Gas Shipbroking Market, 2016-2026 (USD Million)
    FIG. 10    Global Manufacturing Shipbroking Market, 2016-2026 (USD Million)
    FIG. 11    Global Aerospace and Defense Shipbroking Market, 2016-2026 (USD Million)
    FIG. 12    Global Government Shipbroking Market, 2016-2026 (USD Million)
    FIG. 13    Global Others Shipbroking Market, 2016-2026 (USD Million)
    FIG. 14    Global Shipbroking Market Share, by Region, 2019 & 2026
    FIG. 15    North America Shipbroking Market, 2016-2026
    FIG. 16    U.S. Shipbroking Market, 2016-2026
    FIG. 17    Canada Shipbroking Market, 2016-2026
    FIG. 18    Europe Shipbroking Market, 2016-2026
    FIG. 19    Germany Shipbroking Market, 2016-2026
    FIG. 20    France Shipbroking Market, 2016-2026
    FIG. 21    U.K. Shipbroking Market, 2016-2026
    FIG. 22    Italy Shipbroking Market, 2016-2026
    FIG. 23    Spain Shipbroking Market, 2016-2026
    FIG. 24    Rest of Europe Shipbroking Market, 2016-2026
    FIG. 25    Asia Pacific Shipbroking Market, 2016-2026
    FIG. 26    China Shipbroking Market, 2016-2026
    FIG. 27    Japan Shipbroking Market, 2016-2026
    FIG. 28    India Shipbroking Market, 2016-2026
    FIG. 29    South  Korea Shipbroking Market, 2016-2026
    FIG. 30    South-East Asia Shipbroking Market, 2016-2026
    FIG. 31    Rest of Asia Pacific Shipbroking Market, 2016-2026
    FIG. 32    Latin America Shipbroking Market, 2016-2026
    FIG. 33    Brazil Shipbroking Market, 2016-2026
    FIG. 34    Mexico Shipbroking Market, 2016-2026
    FIG. 35    Rest of Latin America Shipbroking Market, 2016-2026
    FIG. 36    The Middle-East and Africa Shipbroking Market, 2016-2026
    FIG. 37    GCC Countries Shipbroking Market, 2016-2026
    FIG. 38    South Africa Shipbroking Market, 2016-2026
    FIG. 39    Rest of Middle-East Africa Shipbroking Market, 2016-2026
    FIG. 40    Competitor Market Share – Revenue
    FIG. 41    Barry Rogliano Salles International S.A Revenue and Growth Rate
    FIG. 42    Barry Rogliano Salles International S.A Market Share
    FIG. 43    Braemar Shipping Services PLC Revenue and Growth Rate
    FIG. 44    Braemar Shipping Services PLC Market Share
    FIG. 45    Bright Cook & Co (S&P) Limited Revenue and Growth Rate
    FIG. 46    Bright Cook & Co (S&P) Limited Market Share
    FIG. 47    Charles R. Weber Company, Inc. Revenue and Growth Rate
    FIG. 48    Charles R. Weber Company, Inc. Market Share
    FIG. 49    CLARKSON PLC Revenue and Growth Rate
    FIG. 50    CLARKSON PLC Market Share
    FIG. 51    Compass Maritime Services, LLC Revenue and Growth Rate
    FIG. 52    Compass Maritime Services, LLC Market Share
    FIG. 53    E.A. Gibson Shipbrokers Ltd Revenue and Growth Rate
    FIG. 54    E.A. Gibson Shipbrokers Ltd Market Share
    FIG. 55    Howe Robinson Partners Revenue and Growth Rate
    FIG. 56    Howe Robinson Partners Market Share
    FIG. 57    INTEROCEAN SHIPPING COMPANY Revenue and Growth Rate
    FIG. 58    INTEROCEAN SHIPPING COMPANY Market Share
    FIG. 59    Maersk Broker K/S Revenue and Growth Rate
    FIG. 60    Maersk Broker K/S Market Share
    FIG. 61    McQuilling Partners, Inc. Revenue and Growth Rate
    FIG. 62    McQuilling Partners, Inc. Market Share
    FIG. 63    Poten and Partners Group, Inc. Revenue and Growth Rate
    FIG. 64    Poten and Partners Group, Inc. Market Share
    FIG. 65    Simpson Spence Young Revenue and Growth Rate
    FIG. 66    Simpson Spence Young Market Share
    FIG. 67    SPI Marine Revenue and Growth Rate
    FIG. 68    SPI Marine Market Share
    FIG. 69    Velian Ship Brokers Revenue and Growth Rate
    FIG. 70    Velian Ship Brokers Market Share
    FIG. 71    Market Dynamics
    FIG. 72    Global Shipbroking – Value Chain Analysis
    FIG. 73    Technology Roadmap and Timeline
    FIG. 74    Market Attractiveness Analysis – By Services
    FIG. 75    Market Attractiveness Analysis – By Verticals
    FIG. 76    Market Attractiveness Analysis – By Region
    FIG. 77    Market Channel
    FIG. 78    Marketing Channel Development Trend
    FIG. 79    Growth in World Gross Product, 2008-2019


    List of Tables

    TABLE 1 Global Shipbroking Market, 2019 & 2026 (USD Million)
    TABLE 2 Global Shipbroking market, by Services, 2016-2026 (USD Million)
    TABLE 3 Global Shipbroking market, by Verticals, 2016-2026 (USD Million)
    TABLE 4 Global Shipbroking market, by Region, 2016-2026 (USD Million)
    TABLE 5 North America Shipbroking Market, by Services, 2016-2026 (USD Million)
    TABLE 6 North America Shipbroking Market, by Verticals, 2016-2026 (USD Million)
    TABLE 7 Europe Shipbroking Market, by Services, 2016-2026 (USD Million)
    TABLE 8 Europe Shipbroking Market, by Verticals, 2016-2026 (USD Million)
    TABLE 9 Asia Pacific Shipbroking Market, by Services, 2016-2026 (USD Million)
    TABLE 10 Asia Pacific Shipbroking Market, by Verticals, 2016-2026 (USD Million)
    TABLE 11 Latin America Shipbroking Market, by Services, 2016-2026 (USD Million)
    TABLE 12 Latin America Shipbroking Market, by Verticals, 2016-2026 (USD Million)
    TABLE 13 The Middle-East and Africa Shipbroking Market, by Services, 2016-2026 (USD Million)
    TABLE 14 The Middle-East and Africa Shipbroking Market, by Verticals, 2016-2026 (USD Million)
    TABLE 15 Global Shipbroking Market - Company Revenue Analysis 2016-2019 (USD Million)
    TABLE 16 Global Shipbroking Market - Company Revenue Share Analysis 2016-2019
    TABLE 17 Acquisitions and Mergers
    TABLE 18 New Product/Service Launch
    TABLE 19 Research & Development Activities
    TABLE 20 Market Drivers
    TABLE 21 Market Restraints
    TABLE 22 Market Opportunities

  •  

    Industry Major Market Players

    • Barry RoglianoSalles International S.A
    • Braemar Shipping Services PLC
    • Bright Cook & Co (S&P) Limited
    • Charles R. Weber Company Inc.
    • CLARKSON PLC
    • Compass Maritime Services
    • LLC
    • E.A. Gibson Shipbrokers Ltd
    • Howe Robinson Partners
    • INTEROCEAN SHIPPING COMPANY
    • Maersk Broker K/S
    • McQuilling Partners Inc.
    • Poten  Partners Group Inc.
    • Simpson Spence Young
    • SPI Marine
    • Velian Ship Brokers.