Search Market Research Report

Discover Our Latest Reports
Discover Our Featured Reports
Discover Top Selling Reports

Shikimic Acid Market Size, Share Global Analysis Report, 2020–2026

report img

Shikimic Acid Market By Type (Purity<98%, Purity: 98-99%, and Purity>99%) and By Applications (Anti-inflammatory Drugs, Analgesic Drugs, and Antiviral Drugs): Global Industry Outlook, Market Size, Business Intelligence, Consumer Preferences, Statistical Surveys, Comprehensive Analysis, Historical Developments, Current Trends, and Forecast 2020–2026

Industry Insights

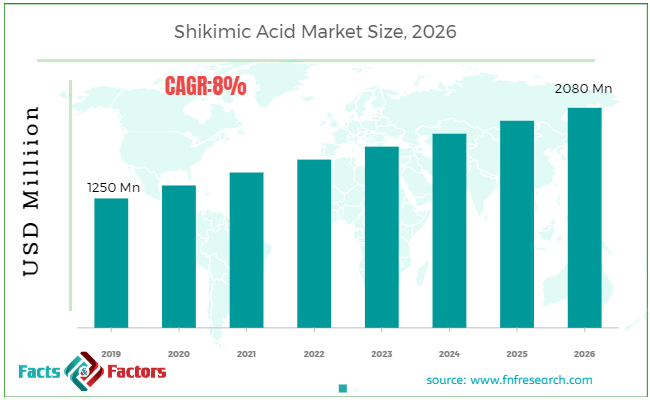
[189+ Pages Report] According to the report published by Facts Factors, the global shikimic acid market size was worth around USD 1250 million in 2019 and is predicted to grow to around USD 2080 million by 2026 with a compound annual growth rate (CAGR) of roughly 8% between 2020 and 2026. The report analyzes the global shikimic acid market drivers, restraints/challenges, and the effect they have on the demands during the projection period. In addition, the report explores emerging opportunities in the shikimic acid market.

The shikimic acid market report analyzes and notifies the industry statistics at the global as well as regional and country levels in order to acquire a thorough perspective of the entire shikimic acid market. The historical and past insights are provided for FY 2016 to FY 2019 whereas projected trends are delivered for FY 2020 to FY 2026. The quantitative and numerical data is represented in terms of both volume (Units) and value (USD Million) from FY 2016 – 2026.

Shikimic Acid Market Size

To know more about this report | Request Free Sample Copy


logoKey Insights from Primary Research

  • As per our primary respondents, the global shikimic acid market is set to grow annually at a rate of around 8%
  • It was established through primary research that the shikimic acid market was valued at around USD 1250 Million in 2019
  • Presently, Europe is holding the largest revenue share among all the regions and is further expected to maintain its position throughout the forecast period.
  • On basis of product segment, Purity 98-99% dominated the global shikimic acid market in 2019. Furthermore, it is also expected to be the fastest-growing product segment of the market in the forecast period.
  • The global shikimic acid market is expected to reach around USD 2080 Million by 2026.

logoKey Recommendations from Analysts

  • As per our analysts, the global shikimic acid market is expected to grow significantly over the forecast period.
  • The strategic and competitive advantage provided by shikimic acid in the pharmaceutical industry is anticipated to be the key factor driving this market globally.
  • As per analysts, the use of shikimic acid in cosmetic products will boost the sales of shikimic acid.
  • Our team of analysts has identified, that increasing demand for cosmetics among the female population will support the growth of the market.
  • Among region, Europe is expected to be the fastest growing market for shikimic acid during the years to come.

The quantitative data is further underlined and reinforced by comprehensive qualitative data which comprises various across-the-board market dynamics. The rationales which directly or indirectly impact the shikimic acid industry are exemplified through parameters such as growth drivers, restraints, challenges, and opportunities among other impacting factors.

Throughout our research report, we have encompassed all the proven models and tools of industry analysis and extensively illustrated all the key business strategies and business models adopted in the shikimic acid industry. The report provides an all-inclusive and detailed competitive landscape prevalent in the shikimic acid market.

The report utilizes established industry analysis tools and models such as Porter’s Five Forces framework to analyze and recognize critical business strategies adopted by various stakeholders involved in the entire value chain of the shikimic acid industry. The shikimic acid market report additionally employs SWOT analysis and PESTLE analysis models for further in-depth analysis.

The report study further includes an in-depth analysis of industry players' market shares and provides an overview of leading players' market position in the Shikimic Acid sector. Key strategic developments in the shikimic acid market competitive landscape such as acquisitions & mergers, inaugurations of different products and services, partnerships & joint ventures, MoU agreements, VC & funding activities, R&D activities, and geographic expansion among other noteworthy activities by key players of the shikimic acid market are appropriately highlighted in the report.

Shikimic acid is shikimate anionic form, cyclitol, cyclohexene, and cyclohexane carboxylic acid. In plants and microorganisms, it is an essential biochemical metabolite. In addition, the acid is easily water soluble, and insoluble in non-polar solvents. Shikimic acid is used extensively as a chiral building block for pharmaceutical synthesis. Moreover, rising flu across the globe has raised the demand for this acid in pharmaceutical industries. In addition, the rising focus on research & developments in this industry to improve bio-based and natural drugs will grow the market rapidly in the coming years. However, due to its limited availability of raw materials, the market growth may get affected. Furthermore, its rising usage in the cosmetic industry and agriculture sector is significantly influencing market growth.

The shikimic acid market research report delivers an acute valuation and taxonomy of the shikimic acid industry by practically splitting the market on the basis of different types, applications, and regions. Through the analysis of the historical and projected trends, all the segments and sub-segments were evaluated through the bottom-up approach, and different market sizes have been projected for FY 2020 to FY 2026.

logoReport Scope

Report Attribute

Details

Market Size in 2019

USD 1250 Million

Projected Market Size in 2026

USD 2080 Million

CAGR Growth Rate

8% CAGR

Base Year

2019

Forecast Years

2020-2026

Key Market Players

Guangxi Wanshan, Shanxi Huike, SS Fermozyme Private Limited, Suzhou Norming, Younous Herb Extract Co., Ltd, Biogin, BioBioPha Co., Ltd., Dezhou Yunxiang Food Co., Ltd., and Roche Holding AG, and Others

Key Segment

By Type, Application, and Region

Major Regions Covered

North America, Europe, Asia Pacific, Latin America, and the Middle East & Africa

Purchase Options

Request customized purchase options to meet your research needs. Explore purchase options

The regional segmentation of the shikimic acid industry includes the complete classification of all the major continents including North America, Latin America, Europe, Asia Pacific, and Middle East & Africa. Further, country-wise data for the shikimic acid industry is provided for the leading economies of the world.

The shikimic acid market is segmented based on type and application. On the basis of type segmentation, the market is classified into categorized into purity<98%, purity: 98-99%, and purity>99%. In terms of Application segmentation, the market is bifurcated into anti-inflammatory drugs, analgesic drugs, and antiviral drugs among others.

logoSome of the essential players operating in the shikimic acid market, but not restricted to include 

  • Guangxi Wanshan
  • Shanxi Huike
  • SS Fermozyme Private Limited
  • Suzhou Norming
  • Younous Herb Extract Co. Ltd
  • Biogin
  • BioBioPha Co. Ltd.
  • Dezhou Yunxiang Food Co. Ltd.
  • Roche Holding AG

The taxonomy of the shikimic acid industry by its scope and segmentation is as follows:

logo By Type Segmentation Analysis

  • Purity<98%
  • Purity: 98-99%
  • Purity>99%

logo By Application Segmentation Analysis

  • Anti-inflammatory Drugs
  • Analgesic Drugs
  • Antiviral Drugs
  • Others

logo Regional Segmentation Analysis

  • North America
    • The U.S.
    • Canada
  • Europe
    • Germany
    • The UK
    • France
    • Spain
    • Italy
    • Rest of Europe
  • Asia Pacific
    • China
    • Japan
    • India
    • South Korea
    • Southeast Asia
    • Rest of Asia Pacific
  • Latin America
    • Brazil
    • Mexico
    • Rest of Latin America
  • Middle East & Africa
    • GCC
    • South Africa
    • Rest of Middle East & Africa

Table of Content

  1. CHAPTER 1. Executive Summary
    1. CHAPT1ER 2. shikimic acid market – Types Analysis
    2. 2.1. Global Shikimic Acid Market – Types Overview
    3. 2.2. Global Shikimic Acid Market Share, by Types, 2018 & 2025 (USD Million)
    4. 2.3. Global Shikimic Acid Market share, by Types, 2018 & 2025 (Kilo Tons)
    5. 2.4. Purity<98%
      1. 2.4.1. Global Purity<98% Shikimic Acid Market, 2016-2026 (USD Million)
      2. 2.4.2. Global Purity<98% Shikimic Acid Market, 2016-2026 (Kilo Tons)
    6. 2.5. Purity: 98-99%
      1. 2.5.1. Global Purity: 98-99% Shikimic Acid Market, 2016-2026 (USD Million)
      2. 2.5.2. Global Purity: 98-99% Shikimic Acid Market, 2016-2026 (Kilo Tons)
    7. 2.6. Purity>99%
      1. 2.6.1. Global Purity>99% Shikimic Acid Market, 2016-2026 (USD Million)
      2. 2.6.2. Global Purity>99% Shikimic Acid Market, 2016-2026 (Kilo Tons)
  2. CHAPTER 3. shikimic acid market – Application Analysis
    1. 3.1. Global Shikimic Acid Market – Application Overview
    2. 3.2. Global Shikimic Acid Market Share, by Application, 2018 & 2025 (USD Million)
    3. 3.3. Global Shikimic Acid Market share, by Application, 2018 & 2025 (Kilo Tons)
    4. 3.4. Anti-inflammatory Drugs
      1. 3.4.1. Global Anti-inflammatory Drugs Shikimic Acid Market, 2016-2026 (USD Million)
      2. 3.4.2. Global Anti-inflammatory Drugs Shikimic Acid Market, 2016-2026 (Kilo Tons)
    5. 3.5. Analgesic Drugs
      1. 3.5.1. Global Analgesic Drugs Shikimic Acid Market, 2016-2026 (USD Million)
      2. 3.5.2. Global Analgesic Drugs Shikimic Acid Market, 2016-2026 (Kilo Tons)
    6. 3.6. Antiviral Drugs
      1. 3.6.1. Global Antiviral Drugs Shikimic Acid Market, 2016-2026 (USD Million)
      2. 3.6.2. Global Antiviral Drugs Shikimic Acid Market, 2016-2026 (Kilo Tons)
    7. 3.7. Others
      1. 3.7.1. Global Others Shikimic Acid Market, 2016-2026 (USD Million)
      2. 3.7.2. Global Others Shikimic Acid Market, 2016-2026 (Kilo Tons)
  3. CHAPTER 4. shikimic acid market – Regional Analysis
    1. 4.1. Global Shikimic Acid Market Regional Overview
    2. 4.2. Global Shikimic Acid Market Share, by Region, 2018 & 2025 (Value)
    3. 4.3. Global Shikimic Acid Market Share, by Region, 2018 & 2025 (Volume)
    4. 4.4. North America
      1. 4.4.1. North America Shikimic Acid Market size and forecast, 2016-2026
      2. 4.4.2. North America Shikimic Acid Market, by Country, 2018 - 2025 (USD Million)
      3. 4.4.3. North America Market size and forecast, 2016-2026 (Kilo Tons)
      4. 4.4.4. North America Shikimic Acid Market, by Country, 2018 - 2025 (Kilo Tons)
      5. 4.4.5. North America Shikimic Acid Market, by Types, 2016-2026
        1. 4.4.5.1. North America Shikimic Acid Market, by Types, 2016-2026 (USD Million)
        2. 4.4.5.2. North America Shikimic Acid Market, by Types, 2016-2026 (Kilo Tons)
      6. 4.4.6. North America Shikimic Acid Market, by Application, 2016-2026
        1. 4.4.6.1. North America Shikimic Acid Market, by Application, 2016-2026 (USD Million)
        2. 4.4.6.2. North America Shikimic Acid Market, by Application, 2016-2026 (Kilo Tons)
      7. 4.4.7. U.S.
        1. 4.4.7.1. U.S. Market size and forecast, 2016-2026 (USD Million)
        2. 4.4.7.2. U.S. Market size and forecast, 2016-2026 (Kilo Tons)
      8. 4.4.8. Canada
        1. 4.4.8.1. Canada Market size and forecast, 2016-2026 (USD Million)
        2. 4.4.8.2. Canada Market size and forecast, 2016-2026 (Kilo Tons)
    5. 4.5. Europe
      1. 4.5.1. Europe Shikimic Acid Market size and forecast, 2016-2026
      2. 4.5.2. Europe Shikimic Acid Market, by Country, 2018 - 2025 (USD Million)
      3. 4.5.3. Europe Market size and forecast, 2016-2026 (Kilo Tons)
      4. 4.5.4. Europe Shikimic Acid Market, by Country, 2018 - 2025 (Kilo Tons)
      5. 4.5.5. Europe Shikimic Acid Market, by Types, 2016-2026
        1. 4.5.5.1. Europe Shikimic Acid Market, by Types, 2016-2026 (USD Million)
        2. 4.5.5.2. Europe Shikimic Acid Market, by Types, 2016-2026 (Kilo Tons)
      6. 4.5.6. Europe Shikimic Acid Market, by Application, 2016-2026
        1. 4.5.6.1. Europe Shikimic Acid Market, by Application, 2016-2026 (USD Million)
        2. 4.5.6.2. Europe Shikimic Acid Market, by Application, 2016-2026 (Kilo Tons)
      7. 4.5.7. Germany
        1. 4.5.7.1. Germany Market size and forecast, 2016-2026 (USD Million)
        2. 4.5.7.2. Germany Market size and forecast, 2016-2026 (Kilo Tons)
      8. 4.5.8. France
        1. 4.5.8.1. France Market size and forecast, 2016-2026 (USD Million)
        2. 4.5.8.2. France Market size and forecast, 2016-2026 (Kilo Tons)
      9. 4.5.9. U.K.
        1. 4.5.9.1. U.K. Market size and forecast, 2016-2026 (USD Million)
        2. 4.5.9.2. U.K. Market size and forecast, 2016-2026 (Kilo Tons)
      10. 4.5.10. Italy
        1. 4.5.10.1. Italy Market size and forecast, 2016-2026 (USD Million)
        2. 4.5.10.2. Italy Market size and forecast, 2016-2026 (Kilo Tons)
      11. 4.5.11. Spain
        1. 4.5.11.1. Spain Market size and forecast, 2016-2026 (USD Million)
        2. 4.5.11.2. Spain Market size and forecast, 2016-2026 (Kilo Tons)
      12. 4.5.12. Rest of Europe
        1. 4.5.12.1. Rest of Europe Market size and forecast, 2016-2026 (USD Million)
        2. 4.5.12.2. Rest of Europe Market size and forecast, 2016-2026 (Kilo Tons)
    6. 4.6. Asia Pacific
      1. 4.6.1. Asia Pacific Shikimic Acid Market size and forecast, 2016-2026
      2. 4.6.2. Asia Pacific Shikimic Acid Market, by Country, 2018 - 2025 (USD Million)
      3. 4.6.3. Asia Pacific Market size and forecast, 2016-2026 (Kilo Tons)
      4. 4.6.4. Asia Pacific Shikimic Acid Market, by Country, 2018 - 2025 (Kilo Tons)
      5. 4.6.5. Asia Pacific Shikimic Acid Market, by Types, 2016-2026
        1. 4.6.5.1. Asia Pacific Shikimic Acid Market, by Types, 2016-2026 (USD Million)
        2. 4.6.5.2. Asia Pacific Shikimic Acid Market, by Types, 2016-2026 (Kilo Tons)
      6. 4.6.6. Asia Pacific Shikimic Acid Market, by Application, 2016-2026
        1. 4.6.6.1. Asia Pacific Shikimic Acid Market, by Application, 2016-2026 (USD Million)
        2. 4.6.6.2. Asia Pacific Shikimic Acid Market, by Application, 2016-2026 (Kilo Tons)
      7. 4.6.7. China
        1. 4.6.7.1. China Market size and forecast, 2016-2026 (USD Million)
        2. 4.6.7.2. China Market size and forecast, 2016-2026 (Kilo Tons)
      8. 4.6.8. Japan
        1. 4.6.8.1. Japan Market size and forecast, 2016-2026 (USD Million)
        2. 4.6.8.2. Japan Market size and forecast, 2016-2026 (Kilo Tons)
      9. 4.6.9. India
        1. 4.6.9.1. India Market size and forecast, 2016-2026 (USD Million)
        2. 4.6.9.2. India Market size and forecast, 2016-2026 (Kilo Tons)
      10. 4.6.10. South Korea
        1. 4.6.10.1. South Korea Market size and forecast, 2016-2026 (USD Million)
        2. 4.6.10.2. South Korea Market size and forecast, 2016-2026 (Kilo Tons)
      11. 4.6.11. South-East Asia
        1. 4.6.11.1. South-East Asia Market size and forecast, 2016-2026 (USD Million)
        2. 4.6.11.2. South-East Asia Market size and forecast, 2016-2026 (Kilo Tons)
      12. 4.6.12. Rest of Asia Pacific
        1. 4.6.12.1. Rest of Asia Pacific Market size and forecast, 2016-2026 (USD Million)
        2. 4.6.12.2. Rest of Asia Pacific Market size and forecast, 2016-2026 (Kilo Tons)
    7. 4.7. Latin America
      1. 4.7.1. Latin America Shikimic Acid Market size and forecast, 2016-2026
      2. 4.7.2. Latin America Shikimic Acid Market, by Country, 2018 - 2025 (USD Million)
      3. 4.7.3. Latin America Market size and forecast, 2016-2026 (Kilo Tons)
      4. 4.7.4. Latin America Shikimic Acid Market, by Country, 2018 - 2025 (Kilo Tons)
      5. 4.7.5. Latin America Shikimic Acid Market, by Types, 2016-2026
        1. 4.7.5.1. Latin America Shikimic Acid Market, by Types, 2016-2026 (USD Million)
        2. 4.7.5.2. Latin America Shikimic Acid Market, by Types, 2016-2026 (Kilo Tons)
      6. 4.7.6. Latin America Shikimic Acid Market, by Application, 2016-2026
        1. 4.7.6.1. Latin America Shikimic Acid Market, by Application, 2016-2026 (USD Million)
        2. 4.7.6.2. Latin America Shikimic Acid Market, by Application, 2016-2026 (Kilo Tons)
      7. 4.7.7. Brazil
        1. 4.7.7.1. Brazil Market size and forecast, 2016-2026 (USD Million)
        2. 4.7.7.2. Brazil Market size and forecast, 2016-2026 (Kilo Tons)
      8. 4.7.8. Mexico
        1. 4.7.8.1. Mexico Market size and forecast, 2016-2026 (USD Million)
        2. 4.7.8.2. Mexico Market size and forecast, 2016-2026 (Kilo Tons)
      9. 4.7.9. Rest of Latin America
        1. 4.7.9.1. Rest of Latin America Market size and forecast, 2016-2026 (USD Million)
        2. 4.7.9.2. Rest of Latin America Market size and forecast, 2016-2026 (Kilo Tons)
    8. 4.8. The Middle-East and Africa
      1. 4.8.1. The Middle-East and Africa Shikimic Acid Market size and forecast, 2016-2026
      2. 4.8.2. The Middle-East and Africa Shikimic Acid Market, by Country, 2018 - 2025 (USD Million)
      3. 4.8.3. The Middle-East and Africa Market size and forecast, 2016-2026 (Kilo Tons)
      4. 4.8.4. The Middle-East and Africa Shikimic Acid Market, by Country, 2018 - 2025 (Kilo Tons)
      5. 4.8.5. The Middle-East and Africa Shikimic Acid Market, by Types, 2016-2026
        1. 4.8.5.1. The Middle-East and Africa Shikimic Acid Market, by Types, 2016-2026 (USD Million)
        2. 4.8.5.2. The Middle-East and Africa Shikimic Acid Market, by Types, 2016-2026 (Kilo Tons)
      6. 4.8.6. The Middle-East and Africa Shikimic Acid Market, by Application, 2016-2026
        1. 4.8.6.1. The Middle-East and Africa Shikimic Acid Market, by Application, 2016-2026 (USD Million)
        2. 4.8.6.2. The Middle-East and Africa Shikimic Acid Market, by Application, 2016-2026 (Kilo Tons)
      7. 4.8.7. GCC Countries
        1. 4.8.7.1. GCC Countries Market size and forecast, 2016-2026 (USD Million)
        2. 4.8.7.2. GCC Countries Market size and forecast, 2016-2026 (Kilo Tons)
      8. 4.8.8. South Africa
        1. 4.8.8.1. South Africa Market size and forecast, 2016-2026 (USD Million)
        2. 4.8.8.2. South Africa Market size and forecast, 2016-2026 (Kilo Tons)
      9. 4.8.9. Rest of Middle-East Africa
        1. 4.8.9.1. Rest of Middle-East Africa Market size and forecast, 2016-2026 (USD Million)
        2. 4.8.9.2. Rest of Middle-East Africa Market size and forecast, 2016-2026 (Kilo Tons)
  4. CHAPTER 5. Shikimic Acid Production, Consumption, Export, Import by Regions
    1. 5.1. Global Shikimic Acid production and revenue, 2015-2025 (USD Million) (Kilo Tons)
    2. 5.2. Global Import and Export Analysis, by Region
  5. CHAPTER 6. shikimic acid market – Competitive Landscape
    1. 6.1. Competitor Market Share – Revenue
    2. 6.2. Market Concentration Rate Analysis, Top 3 and Top 5 Players
    3. 6.3. Competitor Market Share – Volume
    4. 6.4. Strategic Development
      1. 6.4.1. Acquisitions and Mergers
      2. 6.4.2. New Products
      3. 6.4.3. Research & Development Activities
  6. CHAPTER 7. Company Profiles
    1. 7.1. Shaanxi Huike Botanical Development Co., Ltd
      1. 7.1.1. Company Overview
      2. 7.1.2. Shaanxi Huike Botanical Development Co., Ltd Sales, Revenue, Price, and Gross Margin
      3. 7.1.3. Product portfolio
      4. 7.1.4. Recent initiatives
    2. 7.2. Younous Herb Extract Co., Ltd
      1. 7.2.1. Company Overview
      2. 7.2.2. Younous Herb Extract Co., Ltd Sales, Revenue, Price, and Gross Margin
      3. 7.2.3. Product portfolio
      4. 7.2.4. Recent initiatives
    3. 7.3. Suzhou Nuoming Biotechnology Co., Ltd
      1. 7.3.1. Company Overview
      2. 7.3.2. Suzhou Nuoming Biotechnology Co., Ltd Sales, Revenue, Price, and Gross Margin
      3. 7.3.3. Product portfolio
      4. 7.3.4. Recent initiatives
    4. 7.4. Roche Holdings AG
      1. 7.4.1. Company Overview
      2. 7.4.2. Roche Holdings AG Sales, Revenue, Price, and Gross Margin
      3. 7.4.3. Product portfolio
      4. 7.4.4. Recent initiatives
    5. 7.5. BioBioPha Co., Ltd
      1. 7.5.1. Company Overview
      2. 7.5.2. BioBioPha Co., Ltd Sales, Revenue, Price, and Gross Margin
      3. 7.5.3. Product portfolio
      4. 7.5.4. Recent initiatives
    6. 7.6. BioGin
      1. 7.6.1. Company Overview
      2. 7.6.2. BioGin Sales, Revenue, Price, and Gross Margin
      3. 7.6.3. Product portfolio
      4. 7.6.4. Recent initiatives
    7. 7.7. Dezhou Yunxiang Food Co., Ltd
      1. 7.7.1. Company Overview
      2. 7.7.2. Dezhou Yunxiang Food Co., Ltd Sales, Revenue, Price, and Gross Margin
      3. 7.7.3. Product portfolio
      4. 7.7.4. Recent initiatives
    8. 7.8. Xi'an B-Thriving I/E Co.,Ltd.
      1. 7.8.1. Company Overview
      2. 7.8.2. Xi'an B-Thriving I/E Co.,Ltd. Sales, Revenue, Price, and Gross Margin
      3. 7.8.3. Product portfolio
      4. 7.8.4. Recent initiatives
    9. 7.9. Wuhan Yuangcheng Gongchuang Technology Co., Ltd.
      1. 7.9.1. Company Overview
      2. 7.9.2. Wuhan Yuangcheng Gongchuang Technology Co., Ltd. Sales, Revenue, Price, and Gross Margin
      3. 7.9.3. Product portfolio
      4. 7.9.4. Recent initiatives
  7. CHAPTER 8. Shikimic Acid — Industry Analysis
    1. 8.1. Introduction and Taxonomy
    2. 8.2. Shikimic Acid Market – Key Trends
      1. 8.2.1. Market Drivers
      2. 8.2.2. Market Restraints
      3. 8.2.3. Market Opportunities
    3. 8.3. Value Chain Analysis
    4. 8.4. Key Mandates and Regulations
    5. 8.5. Technology Roadmap and Timeline
    6. 8.6. shikimic acid market – Attractiveness Analysis
      1. 8.6.1. By Types
      2. 8.6.2. By Application
      3. 8.6.3. By Region
  8. CHAPTER 9. Raw Material analysis
    1. 9.1. Shikimic Acid Key Raw Material Analysis
      1. 9.1.1. Key Raw Materials
      2. 9.1.2. Price Trend of Key Raw Materials
    2. 9.2. Key Suppliers of Raw Materials
    3. 9.3. Proportion of Manufacturing Cost Structure
      1. 9.3.1. Raw Materials
      2. 9.3.2. Labor Cost
    4. 9.4. Manufacturing Expenses Analysis of Shikimic Acid
  9. CHAPTER 10. Industrial Chain, Sourcing Strategy and Downstream Buyers
    1. 10.1. Shikimic Acid Industrial Chain Analysis
    2. 10.2. Upstream Raw Materials Sourcing
      1. 10.2.1. Risk Mitigation:
      2. 10.2.2. Supplier Relationships:
      3. 10.2.3. Business Processes:
      4. 10.2.4. Securing the Product:
    3. 10.3. Raw Materials Sources of Shikimic Acid Major Manufacturers in 2016
    4. 10.4. Downstream Buyers
    5. 10.5. Distributors/Traders List
  10. CHAPTER 11. Marketing Strategy Analysis, Distributors
    1. 11.1. Marketing Channel
    2. 11.2. Direct Marketing
    3. 11.3. Indirect Marketing
    4. 11.4. Marketing Channel Development Trend
    5. 11.5. Economic/Political Environmental Change
  11. CHAPTER 12. Report Conclusion
  12. CHAPTER 13. Research Approach & Methodology
    1. 13.1. Report Description
    2. 13.2. Research Scope
    3. 13.3. Research Methodology
      1. 13.3.1. Secondary Research
      2. 13.3.2. Primary Research
      3. 13.3.3. Models
        1. 13.3.3.1. Company Share Analysis Model
        2. 13.3.3.2. Revenue Based Modeling
        3. 13.3.3.3. Research Limitations

        List of Figures

        FIG. 1 Global Shikimic Acid Market, 2016-2026 (USD Million)
        FIG. 2 Global Shikimic Acid Market Share, by Types, 2018 & 2025 (USD Million)
        FIG. 3 Global Shikimic Acid Market share, by Types, 2018 & 2025 (Kilo Tons)
        FIG. 4 Global Purity<98% Shikimic Acid Market, 2016-2026 (USD Million)
        FIG. 5 Global Purity<98% Shikimic Acid  Market, 2016-2026 (Kilo Tons)
        FIG. 6 Global Purity: 98-99% Shikimic Acid Market, 2016-2026 (USD Million)
        FIG. 7 Global Purity: 98-99% Shikimic Acid  Market, 2016-2026 (Kilo Tons)
        FIG. 8 Global Purity>99% Shikimic Acid Market, 2016-2026 (USD Million)
        FIG. 9 Global Purity>99% Shikimic Acid  Market, 2016-2026 (Kilo Tons)
        FIG. 10 Global Shikimic Acid Market Share, by Application, 2018 & 2025 (USD Million)
        FIG. 11 Global Shikimic Acid Market share, by Application, 2018 & 2025 (Kilo Tons)
        FIG. 12 Global  Anti-inflammatory Drugs Shikimic Acid Market, 2016-2026 (USD Million)
        FIG. 13 Global  Anti-inflammatory Drugs Shikimic Acid  Market, 2016-2026 (Kilo Tons)
        FIG. 14 Global Analgesic Drugs Shikimic Acid Market, 2016-2026 (USD Million)
        FIG. 15 Global Analgesic Drugs Shikimic Acid  Market, 2016-2026 (Kilo Tons)
        FIG. 16 Global Antiviral Drugs Shikimic Acid Market, 2016-2026 (USD Million)
        FIG. 17 Global Antiviral Drugs Shikimic Acid  Market, 2016-2026 (Kilo Tons)
        FIG. 18 Global Others Shikimic Acid Market, 2016-2026 (USD Million)
        FIG. 19 Global Others Shikimic Acid  Market, 2016-2026 (Kilo Tons)
        FIG. 20 Global Shikimic Acid Market Share, by Region, 2018 & 2025
        FIG. 21 Global Shikimic Acid Market Share, by Region, 2018 & 2025
        FIG. 22 North America Shikimic Acid Market, 2016-2026
        FIG. 23 North America Shikimic Acid  Market, 2016-2026 (Kilo Tons)
        FIG. 24 U.S. Shikimic Acid Market, 2016-2026
        FIG. 25 U.S. Shikimic Acid  Market, 2016-2026 (Kilo Tons)
        FIG. 26 Canada Shikimic Acid Market, 2016-2026
        FIG. 27 Canada Shikimic Acid  Market, 2016-2026 (Kilo Tons)
        FIG. 28 Europe Shikimic Acid Market, 2016-2026
        FIG. 29 Europe Shikimic Acid  Market, 2016-2026 (Kilo Tons)
        FIG. 30 Germany Shikimic Acid Market, 2016-2026
        FIG. 31 Germany Shikimic Acid  Market, 2016-2026 (Kilo Tons)
        FIG. 32 France Shikimic Acid Market, 2016-2026
        FIG. 33 France Shikimic Acid  Market, 2016-2026 (Kilo Tons)
        FIG. 34 U.K. Shikimic Acid Market, 2016-2026
        FIG. 35 U.K. Shikimic Acid  Market, 2016-2026 (Kilo Tons)
        FIG. 36 Italy Shikimic Acid Market, 2016-2026
        FIG. 37 Italy Shikimic Acid  Market, 2016-2026 (Kilo Tons)
        FIG. 38 Spain Shikimic Acid Market, 2016-2026
        FIG. 39 Spain Shikimic Acid  Market, 2016-2026 (Kilo Tons)
        FIG. 40 Rest of Europe Shikimic Acid Market, 2016-2026
        FIG. 41 Rest of Europe Shikimic Acid  Market, 2016-2026 (Kilo Tons)
        FIG. 42 Asia Pacific Shikimic Acid Market, 2016-2026
        FIG. 43 Asia Pacific Shikimic Acid  Market, 2016-2026 (Kilo Tons)
        FIG. 44 China Shikimic Acid Market, 2016-2026
        FIG. 45 China Shikimic Acid  Market, 2016-2026 (Kilo Tons)
        FIG. 46 Japan Shikimic Acid Market, 2016-2026
        FIG. 47 Japan Shikimic Acid  Market, 2016-2026 (Kilo Tons)
        FIG. 48 India Shikimic Acid Market, 2016-2026
        FIG. 49 India Shikimic Acid  Market, 2016-2026 (Kilo Tons)
        FIG. 50 South  Korea Shikimic Acid Market, 2016-2026
        FIG. 51 South  Korea Shikimic Acid  Market, 2016-2026 (Kilo Tons)
        FIG. 52 South-East Asia Shikimic Acid Market, 2016-2026
        FIG. 53 South-East Asia Shikimic Acid  Market, 2016-2026 (Kilo Tons)
        FIG. 54 Rest of Asia Pacific Shikimic Acid Market, 2016-2026
        FIG. 55 Rest of Asia Pacific Shikimic Acid  Market, 2016-2026 (Kilo Tons)
        FIG. 56 Latin America Shikimic Acid Market, 2016-2026
        FIG. 57 Latin America Shikimic Acid  Market, 2016-2026 (Kilo Tons)
        FIG. 58 Brazil Shikimic Acid Market, 2016-2026
        FIG. 59 Brazil Shikimic Acid  Market, 2016-2026 (Kilo Tons)
        FIG. 60 Mexico Shikimic Acid Market, 2016-2026
        FIG. 61 Mexico Shikimic Acid  Market, 2016-2026 (Kilo Tons)
        FIG. 62 Rest of Latin America Shikimic Acid Market, 2016-2026
        FIG. 63 Rest of Latin America Shikimic Acid  Market, 2016-2026 (Kilo Tons)
        FIG. 64 The Middle-East and Africa Shikimic Acid Market, 2016-2026
        FIG. 65 The Middle-East and Africa Shikimic Acid  Market, 2016-2026 (Kilo Tons)
        FIG. 66 GCC Countries Shikimic Acid Market, 2016-2026
        FIG. 67 GCC Countries Shikimic Acid  Market, 2016-2026 (Kilo Tons)
        FIG. 68 South Africa Shikimic Acid Market, 2016-2026
        FIG. 69 South Africa Shikimic Acid  Market, 2016-2026 (Kilo Tons)
        FIG. 70 Rest of Middle-East Africa Shikimic Acid Market, 2016-2026
        FIG. 71 Rest of Middle-East Africa Shikimic Acid  Market, 2016-2026 (Kilo Tons)
        FIG. 72 Global Shikimic Acid production and revenue, 2015-2025 (USD Million) (Kilo Tons)
        FIG. 73 North America Shikimic Acid production and revenue, 2015-2025 (USD Million) (Kilo Tons)
        FIG. 74 Europe Shikimic Acid production and revenue, 2015-2025 (USD Million) (Kilo Tons)
        FIG. 75 Asia Pacific Shikimic Acid production and revenue, 2015-2025 (USD Million) (Kilo Tons)
        FIG. 76 Latin America Shikimic Acid production and revenue, 2015-2025 (USD Million) (Kilo Tons)
        FIG. 77 Middle East and Africa Shikimic Acid production and revenue, 2015-2025 (USD Million) (Kilo Tons)
        FIG. 78 Competitor Market Share – Revenue
        FIG. 79 Competitor Market Share – Volume
        FIG. 80 Shaanxi Huike Botanical Development Co., Ltd Revenue and Growth Rate
        FIG. 81 Shaanxi Huike Botanical Development Co., Ltd Market Share
        FIG. 82 Younous Herb Extract Co., Ltd Revenue and Growth Rate
        FIG. 83 Younous Herb Extract Co., Ltd Market Share
        FIG. 84 Suzhou Nuoming Biotechnology Co., Ltd Revenue and Growth Rate
        FIG. 85 Suzhou Nuoming Biotechnology Co., Ltd Market Share
        FIG. 86 Roche Holdings AG Revenue and Growth Rate
        FIG. 87 Roche Holdings AG Market Share
        FIG. 88 BioBioPha Co., Ltd Revenue and Growth Rate
        FIG. 89 BioBioPha Co., Ltd Market Share
        FIG. 90 BioGin Revenue and Growth Rate
        FIG. 91 BioGin Market Share
        FIG. 92 Dezhou Yunxiang Food Co., Ltd Revenue and Growth Rate
        FIG. 93 Dezhou Yunxiang Food Co., Ltd Market Share
        FIG. 94 Xi'an B-Thriving I/E Co.,Ltd. Revenue and Growth Rate
        FIG. 95 Xi'an B-Thriving I/E Co.,Ltd. Market Share
        FIG. 96 Wuhan Yuangcheng Gongchuang Technology Co., Ltd. Revenue and Growth Rate
        FIG. 97 Wuhan Yuangcheng Gongchuang Technology Co., Ltd. Market Share
        FIG. 98 Market Dynamics
        FIG. 99 Global Shikimic Acid – Value Chain Analysis
        FIG. 100 Key Mandates and Regulations
        FIG. 101 Technology Roadmap and Timeline
        FIG. 102 Market Attractiveness Analysis – By Types
        FIG. 103 Market Attractiveness Analysis – By Application
        FIG. 104 Market Attractiveness Analysis – By Region
        FIG. 105 Manufacturing Cost Structure of Shikimic Acid
        FIG. 106 Shikimic Acid Industrial Chain Analysis
        FIG. 107 Market Channel
        FIG. 108 Marketing Channel Development Trend
        FIG. 109 Growth in World Gross Product, 2008-2018

        List of Tables

        TABLE 1 Global shikimic acid market, 2018 & 2025 (USD Million)
        TABLE 2 Global shikimic acid market, by Types, 2016-2026 (USD Million)
        TABLE 3 Global shikimic acid market, by Types, 2016-2026 (Kilo Tons)
        TABLE 4 Global shikimic acid market, by Application, 2016-2026 (USD Million)
        TABLE 5 Global shikimic acid market, by Application, 2016-2026 (Kilo Tons)
        TABLE 6 Global shikimic acid market, by region, 2016-2026 (USD Million)
        TABLE 7 Global shikimic acid market, by region, 2016-2026 (Kilo Tons)
        TABLE 8 North America Shikimic Acid Market, by Types, 2016-2026 (USD Million)
        TABLE 9 North America Shikimic Acid Market, by Types, 2016-2026 (Kilo Tons)
        TABLE 10 North America Shikimic Acid Market, by Application, 2016-2026 (USD Million)
        TABLE 11 North America Shikimic Acid Market, by Application, 2016-2026 (Kilo Tons)
        TABLE 12 Europe Shikimic Acid Market, by Types, 2016-2026 (USD Million)
        TABLE 13 Europe Shikimic Acid Market, by Types, 2016-2026 (Kilo Tons)
        TABLE 14 Europe Shikimic Acid Market, by Application, 2016-2026 (USD Million)
        TABLE 15 Europe Shikimic Acid Market, by Application, 2016-2026 (Kilo Tons)
        TABLE 16 Asia Pacific Shikimic Acid Market, by Types, 2016-2026 (USD Million)
        TABLE 17 Asia Pacific Shikimic Acid Market, by Types, 2016-2026 (Kilo Tons)
        TABLE 18 Asia Pacific Shikimic Acid Market, by Application, 2016-2026 (USD Million)
        TABLE 19 Asia Pacific Shikimic Acid Market, by Application, 2016-2026 (Kilo Tons)
        TABLE 20 Latin America Shikimic Acid Market, by Types, 2016-2026 (USD Million)
        TABLE 21 Latin America Shikimic Acid Market, by Types, 2016-2026 (Kilo Tons)
        TABLE 22 Latin America Shikimic Acid Market, by Application, 2016-2026 (USD Million)
        TABLE 23 Latin America Shikimic Acid Market, by Application, 2016-2026 (Kilo Tons)
        TABLE 24 The Middle-East and Africa Shikimic Acid Market, by Types, 2016-2026 (USD Million)
        TABLE 25 The Middle-East and Africa Shikimic Acid Market, by Types, 2016-2026 (Kilo Tons)
        TABLE 26 The Middle-East and Africa Shikimic Acid Market, by Application, 2016-2026 (USD Million)
        TABLE 27 The Middle-East and Africa Shikimic Acid Market, by Application, 2016-2026 (Kilo Tons)
        TABLE 28 North America Shikimic Acid Production, Consumption, Export, Import, 2016-2019
        TABLE 29 Europe Shikimic Acid Production, Consumption, Export, Import, 2016-2019
        TABLE 30 Asia Pacific Shikimic Acid Production, Consumption, Export, Import, 2016-2019
        TABLE 31 Latin America Shikimic Acid Production, Consumption, Export, Import, 2016-2019
        TABLE 32 Middle East & Africa Shikimic Acid Production, Consumption, Export, Import, 2016-2019
        TABLE 33 Global Shikimic Acid Market - Company Revenue Analysis 2016-2019 (USD Million)
        TABLE 34 Global Shikimic Acid Market - Company Revenue Share Analysis 2016-2019(%)
        TABLE 35 Global Shikimic Acid Market - Company Volume Analysis 2016-2019 (Kilo Tons)
        TABLE 36 Global Shikimic Acid Market - Company Volume Share Analysis 2016-2019(%)
        TABLE 37 Acquisitions and Mergers
        TABLE 38 New Product/Service Launch
        TABLE 39 Research & Development Activities
        TABLE 40 Market Drivers
        TABLE 41 Market Restraints
        TABLE 42 Market Opportunities
        TABLE 43 Production Base and Market Concentration Rate of Raw Material
        TABLE 44 Key Suppliers of Raw Materials
        TABLE 45 Raw Materials Sources of Shikimic Acid Major Manufacturers in 2016
        TABLE 46 Major Buyers of Shikimic Acid
        TABLE 47 Distributors/Traders of Shikimic Acid by Region

Industry Major Market Players

  • Guangxi Wanshan
  • Shanxi Huike
  • SS Fermozyme Private Limited
  • Suzhou Norming
  • Younous Herb Extract Co. Ltd
  • Biogin
  • BioBioPha Co. Ltd.
  • Dezhou Yunxiang Food Co. Ltd.
  • Roche Holding AG