Search Market Research Report

Discover Our Latest Reports
Discover Our Featured Reports
Discover Top Selling Reports

Shape Memory Alloys Market Size, Share Global Analysis Report, 2020–2026

report img

Shape Memory Alloys Market By Type (Nickel-Titanium (Nitinol) Alloys, Copper-Based Alloys, and Others) and By Application (Biomedical, Automotive, Aerospace & Defense, Consumer Electronics & Household, and Others): Global Industry Outlook, Market Size, Business Intelligence, Consumer Preferences, Statistical Surveys, Comprehensive Analysis, Historical Developments, Current Trends, and Forecast 2020–2026

Industry Insights

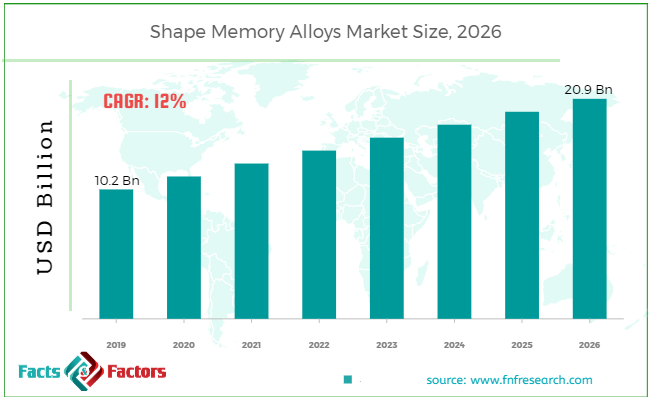
[188+ Pages Report] According to the report published by Facts Factors, the global shape memory alloys market size was worth around USD 10.2 billion in 2019 and is predicted to grow to around USD 20.9 billion by 2026 with a compound annual growth rate (CAGR) of roughly 12% between 2020 and 2026. The report analyzes the global shape memory alloys market drivers, restraints/challenges, and the effect they have on the demands during the projection period. In addition, the report explores emerging opportunities in the shape memory alloys market.

Shape Memory Alloys Market Size

To know more about this report | Request Free Sample Copy

This specialized and expertise oriented industry research report scrutinizes the technical and commercial business outlook of the shape memory alloys industry. The report analyzes and declares the historical and current trends analysis of the shape memory alloys industry and subsequently recommends the projected trends anticipated to be observed in the shape memory alloys market during the upcoming years.

The shape memory alloys market report analyzes and notifies the industry statistics at the global as well as regional and country levels in order to acquire a thorough perspective of the entire shape memory alloys market. The historical and past insights are provided for FY 2016 to FY 2019 whereas projected trends are delivered for FY 2020 to FY 2026. The quantitative and numerical data is represented in terms of both volume (Units) and value (USD Million) from FY 2016 – 2026.


logoKey Insights from Primary Research

  • As per our primary respondents, the global shape memory alloys market is set to grow annually at a rate of around 12%
  • It was established through primary research that the shape memory alloys market was valued at around USD 10 Billion in 2019
  • Presently, the United States and Europe are holding the largest revenue share among all the regions and is further expected to maintain its position throughout the forecast period.
  • On basis of application segment, ‘aerospace industry’ dominated the global shape memory alloys market in 2019.
  • The global shape memory alloys market is expected to reach around USD 20.9 Billion by 2026.

logoKey Recommendations from Analysts

  • As per our analysts, the global shape memory alloys market is expected to grow significantly over the forecast period.
  • The strategic and competitive advantage provided by the shape memory alloys in aerospace industry is anticipated to be the key factor driving this market globally.
  • As per analysts, the use of shape memory alloys in automotive will boost the sales of shape memory alloys.
  • Our team of analysts has identified, that increasing demand for home appliances will support the growth of the market.
  • U.S. is expected to be the fastest growing market for shape memory alloys during the years to come due to on-going research & development activities coupled with strong support of U.S. Government.

The quantitative data is further underlined and reinforced by comprehensive qualitative data which comprises various across-the-board market dynamics. The rationales which directly or indirectly impact the shape memory alloys industry are exemplified through parameters such as growth drivers, restraints, challenges, and opportunities among other impacting factors.

Throughout our research report, we have encompassed all the proven models and tools of industry analysis and extensively illustrated all the key business strategies and business models adopted in the shape memory alloys industry. The report provides an all-inclusive and detailed competitive landscape prevalent in the shape memory alloys market.

The report utilizes established industry analysis tools and models such as Porter’s Five Forces framework to analyze and recognize critical business strategies adopted by various stakeholders involved in the entire value chain of the shape memory alloys industry. The shape memory alloys market report additionally employs SWOT analysis and PESTLE analysis models for further in-depth analysis.

The report study further includes an in-depth analysis of industry players' market shares and provides an overview of leading players' market position in the Shape Memory Alloys sector. Key strategic developments in the shape memory alloys market competitive landscape such as acquisitions & mergers, inaugurations of different products and services, partnerships & joint ventures, MoU agreements, VC & funding activities, R&D activities, and geographic expansion among other noteworthy activities by key players of the shape memory alloys market are appropriately highlighted in the report.

Rising disposable income has raised the demand for home appliances such as furnaces, coffee makers, and refrigerators will foster the market growth. Shape memory alloys are highly used in these appliances owing to properties improved elasticity (SE) and shape memory effect (SME). Moreover, growing adoption of SMEs by aerospace sector owing to their advantageous properties such as high mechanical strength, and fatigue resistance, is booming the market. However, frequent changes in prices of raw materials of shape memory alloys are expected to curb the market growth. In the upcoming years, the increasing demand for such alloys products from emerging economies will lead to a significant demand and supply imbalance.

The shape memory alloys market research report delivers an acute valuation and taxonomy of the shape memory alloys industry by practically splitting the market on the basis of different types, applications, and regions. Through the analysis of the historical and projected trends, all the segments and sub-segments were evaluated through the bottom-up approach, and different market sizes have been projected for FY 2020 to FY 2026.

The regional segmentation of the shape memory alloys industry includes the complete classification of all the major continents including North America, Latin America, Europe, Asia Pacific, and Middle East & Africa. Further, country-wise data for the shape memory alloys industry is provided for the leading economies of the world.

The shape memory alloys market is segmented based on type and application. On the basis of type segmentation, the market is classified into nickel-titanium (nitinol) alloys, copper-based alloys, among others. In terms of Application segmentation, the market is bifurcated into biomedical, automotive, aerospace & defense, consumer electronics & household, and others.

logoReport Scope

Report Attribute

Details

Market Size in 2019

USD 10.2 Billion

Projected Market Size in 2026

USD 20.9 Billion

CAGR Growth Rate

12% CAGR

Base Year

2019

Forecast Years

2019-2026

Key Market Players

Nitinol Devices & Components, SAES Getters, G.RAU GmbH & Co. KG, ATI, Johnson Matthey, Fort Wayne Metals, Furukawa Electric, Nippon Steel & Sumitomo Metal, Nippon Seisen, Metalwerks PMD, Ultimate NiTi Technologies, Dynalloy, PEIER Tech, and Baoji Seabird Metal among others.

Key Segment

By Type, By Industry, By Region

Major Regions Covered

North America, Europe, Asia Pacific, Latin America, and the Middle East & Africa

Purchase Options

Request customized purchase options to meet your research needs. Explore purchase options

logoSome of the leading players in the global market include

  • Nitinol Devices & Components
  • SAES Getters
  • G.RAU GmbH & Co. KG ATI
  • Johnson Matthey
  • Fort Wayne Metals
  • Furukawa Electric
  • Nippon Steel & Sumitomo Metal
  • Nippon Seisen
  • Metalwerks PMD
  • Ultimate NiTi Technologies
  • Dynalloy
  • PEIER Tech
  • Baoji Seabird Metal

The taxonomy of the shape memory alloys industry by its scope and segmentation is as follows:

logoBy Type Segmentation Analysis

  • Nickel-Titanium (Nitinol) Alloys
  • Copper-Based Alloys
  • Others

logoBy Application Segmentation Analysis

  • Biomedical
  • Automotive
  • Aerospace & Defence
  • Consumer Electronics & Household
  • Others

logoBy Regional Segmentation Analysis

  • North America
    • The U.S.
    • Canada
  • Europe
    • Germany
    • The UK
    • France
    • Spain
    • Italy
    • Rest of Europe
  • Asia Pacific
    • China
    • Japan
    • India
    • South Korea
    • Southeast Asia
    • Rest of Asia Pacific
  • Latin America
    • Brazil
    • Mexico
    • Rest of Latin America
  • Middle East & Africa
    • GCC
    • South Africa
    • Rest of Middle East & Africa

Table of Content

  1. CHAPTER 1. Executive Summary
  2. CHAPTER 2. Shape Memory Alloys market – Type Analysis
    1. 2.1. Global Shape Memory Alloys Market – Type Overview
    2. 2.2. Global Shape Memory Alloys Market Share, by Type, 2018 & 2025 (USD Million)
    3. 2.3. Nickel-Titanium (Nitinol) Alloys
      1. 2.3.1. Global Nickel-Titanium (Nitinol) Alloys Shape Memory Alloys Market, 2016-2026 (USD Million)
    4. 2.4. Copper-Based Alloys
      1. 2.4.1. Global Copper-Based Alloys Shape Memory Alloys Market, 2016-2026 (USD Million)
    5. 2.5. Others
      1. 2.5.1. Global Others Shape Memory Alloys Market, 2016-2026 (USD Million)
  3. CHAPTER 3. Shape Memory Alloys market – Application Analysis
    1. 3.1. Global Shape Memory Alloys Market – Application Overview
    2. 3.2. Global Shape Memory Alloys Market Share, by Application, 2018 & 2025 (USD Million)
    3. 3.3. Biomedical
      1. 3.3.1. Global Biomedical Shape Memory Alloys Market, 2016-2026 (USD Million)
    4. 3.4. Automotive
      1. 3.4.1. Global Automotive Shape Memory Alloys Market, 2016-2026 (USD Million)
    5. 3.5. Aerospace & Defense
      1. 3.5.1. Global Aerospace & Defense Shape Memory Alloys Market, 2016-2026 (USD Million)
    6. 3.6. Consumer Electronics
      1. 3.6.1. Global Consumer Electronics Shape Memory Alloys Market, 2016-2026 (USD Million)
    7. 3.7. Others
      1. 3.7.1. Global Others Shape Memory Alloys Market, 2016-2026 (USD Million)
  4. CHAPTER 4. Shape Memory Alloys market – Regional Analysis
    1. 4.1. Global Shape Memory Alloys Market Regional Overview
    2. 4.2. Global Shape Memory Alloys Market Share, by Region, 2018 & 2025 (Value)
    3. 4.3. North America
      1. 4.3.1. North America Shape Memory Alloys Market size and forecast, 2016-2026
      2. 4.3.2. North America Shape Memory Alloys Market, by Country, 2018 & 2025 (USD Million)
      3. 4.3.3. North America Shape Memory Alloys Market, by Type, 2016-2026
        1. 4.3.3.1. North America Shape Memory Alloys Market, by Type, 2016-2026 (USD Million)
      4. 4.3.4. North America Shape Memory Alloys Market, by Application, 2016-2026
        1. 4.3.4.1. North America Shape Memory Alloys Market, by Application, 2016-2026 (USD Million)
      5. 4.3.5. U.S.
        1. 4.3.5.1. U.S. Market size and forecast, 2016-2026 (USD Million)
      6. 4.3.6. Canada
        1. 4.3.6.1. Canada Market size and forecast, 2016-2026 (USD Million)
    4. 4.4. Europe
      1. 4.4.1. Europe Shape Memory Alloys Market size and forecast, 2016-2026
      2. 4.4.2. Europe Shape Memory Alloys Market, by Country, 2018 & 2025 (USD Million)
      3. 4.4.3. Europe Shape Memory Alloys Market, by Type, 2016-2026
        1. 4.4.3.1. Europe Shape Memory Alloys Market, by Type, 2016-2026 (USD Million)
      4. 4.4.4. Europe Shape Memory Alloys Market, by Application, 2016-2026
        1. 4.4.4.1. Europe Shape Memory Alloys Market, by Application, 2016-2026 (USD Million)
      5. 4.4.5. Germany
        1. 4.4.5.1. Germany Market size and forecast, 2016-2026 (USD Million)
      6. 4.4.6. France
        1. 4.4.6.1. France Market size and forecast, 2016-2026 (USD Million)
      7. 4.4.7. U.K.
        1. 4.4.7.1. U.K. Market size and forecast, 2016-2026 (USD Million)
      8. 4.4.8. Italy
        1. 4.4.8.1. Italy Market size and forecast, 2016-2026 (USD Million)
      9. 4.4.9. Spain
        1. 4.4.9.1. Spain Market size and forecast, 2016-2026 (USD Million)
      10. 4.4.10. Rest of Europe
        1. 4.4.10.1. Rest of Europe Market size and forecast, 2016-2026 (USD Million)
    5. 4.5. Asia Pacific
      1. 4.5.1. Asia Pacific Shape Memory Alloys Market size and forecast, 2016-2026
      2. 4.5.2. Asia Pacific Shape Memory Alloys Market, by Country, 2018 & 2025 (USD Million)
      3. 4.5.3. Asia Pacific Shape Memory Alloys Market, by Type, 2016-2026
        1. 4.5.3.1. Asia Pacific Shape Memory Alloys Market, by Type, 2016-2026 (USD Million)
      4. 4.5.4. Asia Pacific Shape Memory Alloys Market, by Application, 2016-2026
        1. 4.5.4.1. Asia Pacific Shape Memory Alloys Market, by Application, 2016-2026 (USD Million)
      5. 4.5.5. China
        1. 4.5.5.1. China Market size and forecast, 2016-2026 (USD Million)
      6. 4.5.6. Japan
        1. 4.5.6.1. Japan Market size and forecast, 2016-2026 (USD Million)
      7. 4.5.7. India
        1. 4.5.7.1. India Market size and forecast, 2016-2026 (USD Million)
      8. 4.5.8. South Korea
        1. 4.5.8.1. South Korea Market size and forecast, 2016-2026 (USD Million)
      9. 4.5.9. South-East Asia
        1. 4.5.9.1. South-East Asia Market size and forecast, 2016-2026 (USD Million)
      10. 4.5.10. Rest of Asia Pacific
        1. 4.5.10.1. Rest of Asia Pacific Market size and forecast, 2016-2026 (USD Million)
    6. 4.6. Latin America
      1. 4.6.1. Latin America Shape Memory Alloys Market size and forecast, 2016-2026
      2. 4.6.2. Latin America Shape Memory Alloys Market, by Country, 2018 & 2025 (USD Million)
      3. 4.6.3. Latin America Shape Memory Alloys Market, by Type, 2016-2026
        1. 4.6.3.1. Latin America Shape Memory Alloys Market, by Type, 2016-2026 (USD Million)
      4. 4.6.4. Latin America Shape Memory Alloys Market, by Application, 2016-2026
        1. 4.6.4.1. Latin America Shape Memory Alloys Market, by Application, 2016-2026 (USD Million)
      5. 4.6.5. Brazil
        1. 4.6.5.1. Brazil Market size and forecast, 2016-2026 (USD Million)
      6. 4.6.6. Mexico
        1. 4.6.6.1. Mexico Market size and forecast, 2016-2026 (USD Million)
      7. 4.6.7. Rest of Latin America
        1. 4.6.7.1. Rest of Latin America Market size and forecast, 2016-2026 (USD Million)
    7. 4.7. The Middle-East and Africa
      1. 4.7.1. The Middle-East and Africa Shape Memory Alloys Market size and forecast, 2016-2026
      2. 4.7.2. The Middle-East and Africa Shape Memory Alloys Market, by Country, 2018 & 2025 (USD Million)
      3. 4.7.3. The Middle-East and Africa Shape Memory Alloys Market, by Type, 2016-2026
        1. 4.7.3.1. The Middle-East and Africa Shape Memory Alloys Market, by Type, 2016-2026 (USD Million)
      4. 4.7.4. The Middle-East and Africa Shape Memory Alloys Market, by Application, 2016-2026
        1. 4.7.4.1. The Middle-East and Africa Shape Memory Alloys Market, by Application, 2016-2026 (USD Million)
      5. 4.7.5. GCC Countries
        1. 4.7.5.1. GCC Countries Market size and forecast, 2016-2026 (USD Million)
      6. 4.7.6. South Africa
        1. 4.7.6.1. South Africa Market size and forecast, 2016-2026 (USD Million)
      7. 4.7.7. Rest of Middle-East Africa
        1. 4.7.7.1. Rest of Middle-East Africa Market size and forecast, 2016-2026 (USD Million)
  5. CHAPTER 5. Shape Memory Alloys market – Competitive Landscape
    1. 5.1. Competitor Market Share – Revenue
    2. 5.2. Market Concentration Rate Analysis, Top 3 and Top 5 Players
    3. 5.3. Strategic Development
      1. 5.3.1. Acquisitions and Mergers
      2. 5.3.2. New Products
      3. 5.3.3. Research & Development Activities
  6. CHAPTER 6. Company Profiles
    1. 6.1. Nitinol Devices & Components
      1. 6.1.1. Company Overview
      2. 6.1.2. Nitinol Devices & Components Revenue and Gross Margin
      3. 6.1.3. Product portfolio
      4. 6.1.4. Recent initiatives
    2. 6.2. SAES Getters
      1. 6.2.1. Company Overview
      2. 6.2.2. SAES Getters Revenue and Gross Margin
      3. 6.2.3. Product portfolio
      4. 6.2.4. Recent initiatives
    3. 6.3. G.RAU GmbH & Co. KG
      1. 6.3.1. Company Overview
      2. 6.3.2. G.RAU GmbH & Co. KG Revenue and Gross Margin
      3. 6.3.3. Product portfolio
      4. 6.3.4. Recent initiatives
    4. 6.4. ATI Wah-chang
      1. 6.4.1. Company Overview
      2. 6.4.2. ATI Wah-chang Revenue and Gross Margin
      3. 6.4.3. Product portfolio
      4. 6.4.4. Recent initiatives
    5. 6.5. Johnson Matthey
      1. 6.5.1. Company Overview
      2. 6.5.2. Johnson Matthey Revenue and Gross Margin
      3. 6.5.3. Product portfolio
      4. 6.5.4. Recent initiatives
    6. 6.6. Fort Wayne Metals
      1. 6.6.1. Company Overview
      2. 6.6.2. Fort Wayne Metals Revenue and Gross Margin
      3. 6.6.3. Product portfolio
      4. 6.6.4. Recent initiatives
    7. 6.7. Furukawa Electric
      1. 6.7.1. Company Overview
      2. 6.7.2. Furukawa Electric Revenue and Gross Margin
      3. 6.7.3. Product portfolio
      4. 6.7.4. Recent initiatives
    8. 6.8. Nippon Steel & Sumitomo Metal
      1. 6.8.1. Company Overview
      2. 6.8.2. Nippon Steel & Sumitomo Metal Revenue and Gross Margin
      3. 6.8.3. Product portfolio
      4. 6.8.4. Recent initiatives
    9. 6.9. Nippon Seisen
      1. 6.9.1. Company Overview
      2. 6.9.2. Nippon Seisen Revenue and Gross Margin
      3. 6.9.3. Product portfolio
      4. 6.9.4. Recent initiatives
    10. 6.10. Metalwerks PMD
      1. 6.10.1. Company Overview
      2. 6.10.2. Metalwerks PMD Revenue and Gross Margin
      3. 6.10.3. Product portfolio
      4. 6.10.4. Recent initiatives
    11. 6.11. Ultimate NiTi Technologies
      1. 6.11.1. Company Overview
      2. 6.11.2. Ultimate NiTi Technologies Revenue and Gross Margin
      3. 6.11.3. Product portfolio
      4. 6.11.4. Recent initiatives
    12. 6.12. Dynalloy
      1. 6.12.1. Company Overview
      2. 6.12.2. Dynalloy Revenue and Gross Margin
      3. 6.12.3. Product portfolio
      4. 6.12.4. Recent initiatives
    13. 6.13. Grikin
      1. 6.13.1. Company Overview
      2. 6.13.2. Grikin Revenue and Gross Margin
      3. 6.13.3. Product portfolio
      4. 6.13.4. Recent initiatives
    14. 6.14. PEIER Tech
      1. 6.14.1. Company Overview
      2. 6.14.2. PEIER Tech Revenue and Gross Margin
      3. 6.14.3. Product portfolio
      4. 6.14.4. Recent initiatives
    15. 6.15. Saite Metal
      1. 6.15.1. Company Overview
      2. 6.15.2. Saite Metal Revenue and Gross Margin
      3. 6.15.3. Product portfolio
      4. 6.15.4. Recent initiatives
    16. 6.16. Smart
      1. 6.16.1. Company Overview
      2. 6.16.2. Smart Revenue and Gross Margin
      3. 6.16.3. Product portfolio
      4. 6.16.4. Recent initiatives
    17. 6.17. Baoji Seabird Metal
      1. 6.17.1. Company Overview
      2. 6.17.2. Baoji Seabird Metal Revenue and Gross Margin
      3. 6.17.3. Product portfolio
      4. 6.17.4. Recent initiatives
  7. CHAPTER 7. Shape Memory Alloys — Industry Analysis
    1. 7.1. Shape Memory Alloys Market – Key Trends
      1. 7.1.1. Market Drivers
      2. 7.1.2. Market Restraints
      3. 7.1.3. Market Opportunities
    2. 7.2. Value Chain Analysis
    3. 7.3. Technology Roadmap and Timeline
    4. 7.4. Shape Memory Alloys Market – Attractiveness Analysis
      1. 7.4.1. By Type
      2. 7.4.2. By Application
      3. 7.4.3. By Region
  8. CHAPTER 8. Marketing Strategy Analysis, Distributors
    1. 8.1. Marketing Channel
    2. 8.2. Direct Marketing
    3. 8.3. Indirect Marketing
    4. 8.4. Marketing Channel Development Trend
    5. 8.5. Economic/Political Environmental Change
  9. CHAPTER 9. Report Conclusion
  10. CHAPTER 10. Research Approach & Methodology
    1. 10.1. Report Description
    2. 10.2. Research Scope
    3. 10.3. Research Methodology
      1. 10.3.1. Secondary Research
      2. 10.3.2. Primary Research
      3. 10.3.3. Models
        1. 10.3.3.1. Company Share Analysis Model
        2. 10.3.3.2. Revenue Based Modeling
        3. 10.3.3.3. Research Limitations

  • List of Figures

    FIG. 1 Global Shape Memory Alloys Market, 2016-2026 (USD Million)
    FIG. 2 Global Shape Memory Alloys Market Share, by Type, 2018 & 2025 (USD Million)
    FIG. 3 Global Nickel-Titanium (Nitinol) Alloys Shape Memory Alloys Market, 2016-2026 (USD Million)
    FIG. 4 Global Copper-Based Alloys Shape Memory Alloys Market, 2016-2026 (USD Million)
    FIG. 5 Global Others Shape Memory Alloys Market, 2016-2026 (USD Million)
    FIG. 6 Global Shape Memory Alloys Market Share, by Application, 2018 & 2025 (USD Million)
    FIG. 7 Global Biomedical Shape Memory Alloys Market, 2016-2026 (USD Million)
    FIG. 8 Global Automotive Shape Memory Alloys Market, 2016-2026 (USD Million)
    FIG. 9 Global Aerospace & Defense Shape Memory Alloys Market, 2016-2026 (USD Million)
    FIG. 10 Global Consumer Electronics Shape Memory Alloys Market, 2016-2026 (USD Million)
    FIG. 11 Global Others Shape Memory Alloys Market, 2016-2026 (USD Million)
    FIG. 12 Global Shape Memory Alloys Market Share, by Region, 2018 & 2025
    FIG. 13 North America Shape Memory Alloys Market, 2016-2026
    FIG. 14 U.S. Shape Memory Alloys Market, 2016-2026
    FIG. 15 Canada Shape Memory Alloys Market, 2016-2026
    FIG. 16 Europe Shape Memory Alloys Market, 2016-2026
    FIG. 17 Germany Shape Memory Alloys Market, 2016-2026
    FIG. 18 France Shape Memory Alloys Market, 2016-2026
    FIG. 19 U.K. Shape Memory Alloys Market, 2016-2026
    FIG. 20 Italy Shape Memory Alloys Market, 2016-2026
    FIG. 21 Spain Shape Memory Alloys Market, 2016-2026
    FIG. 22 Rest of Europe Shape Memory Alloys Market, 2016-2026
    FIG. 23 Asia Pacific Shape Memory Alloys Market, 2016-2026
    FIG. 24 China Shape Memory Alloys Market, 2016-2026
    FIG. 25 Japan Shape Memory Alloys Market, 2016-2026
    FIG. 26 India Shape Memory Alloys Market, 2016-2026
    FIG. 27 South  Korea Shape Memory Alloys Market, 2016-2026
    FIG. 28 South-East Asia Shape Memory Alloys Market, 2016-2026
    FIG. 29 Rest of Asia Pacific Shape Memory Alloys Market, 2016-2026
    FIG. 30 Latin America Shape Memory Alloys Market, 2016-2026
    FIG. 31 Brazil Shape Memory Alloys Market, 2016-2026
    FIG. 32 Mexico Shape Memory Alloys Market, 2016-2026
    FIG. 33 Rest of Latin America Shape Memory Alloys Market, 2016-2026
    FIG. 34 The Middle-East and Africa Shape Memory Alloys Market, 2016-2026
    FIG. 35 GCC Countries Shape Memory Alloys Market, 2016-2026
    FIG. 36 South Africa Shape Memory Alloys Market, 2016-2026
    FIG. 37 Rest of Middle-East Africa Shape Memory Alloys Market, 2016-2026
    FIG. 38 Competitor Market Share – Revenue
    FIG. 39 Nitinol Devices & Components Revenue and Growth Rate
    FIG. 40 Nitinol Devices & Components Market Share
    FIG. 41 SAES Getters Revenue and Growth Rate
    FIG. 42 SAES Getters Market Share
    FIG. 43 G.RAU GmbH & Co. KG Revenue and Growth Rate
    FIG. 44 G.RAU GmbH & Co. KG Market Share
    FIG. 45 ATI Wah-chang Revenue and Growth Rate
    FIG. 46 ATI Wah-chang Market Share
    FIG. 47 Johnson Matthey Revenue and Growth Rate
    FIG. 48 Johnson Matthey Market Share
    FIG. 49 Fort Wayne Metals Revenue and Growth Rate
    FIG. 50 Fort Wayne Metals Market Share
    FIG. 51 Furukawa Electric Revenue and Growth Rate
    FIG. 52 Furukawa Electric Market Share
    FIG. 53 Nippon Steel & Sumitomo Metal Revenue and Growth Rate
    FIG. 54 Nippon Steel & Sumitomo Metal Market Share
    FIG. 55 Nippon Seisen Revenue and Growth Rate
    FIG. 56 Nippon Seisen Market Share
    FIG. 57 Metalwerks PMD Revenue and Growth Rate
    FIG. 58 Metalwerks PMD Market Share
    FIG. 59 Ultimate NiTi Technologies Revenue and Growth Rate
    FIG. 60 Ultimate NiTi Technologies Market Share
    FIG. 61 Dynalloy Revenue and Growth Rate
    FIG. 62 Dynalloy Market Share
    FIG. 63 Grikin Revenue and Growth Rate
    FIG. 64 Grikin Market Share
    FIG. 65 PEIER Tech Revenue and Growth Rate
    FIG. 66 PEIER Tech Market Share
    FIG. 67 Saite Metal Revenue and Growth Rate
    FIG. 68 Saite Metal Market Share
    FIG. 69 Smart Revenue and Growth Rate
    FIG. 70 Smart Market Share
    FIG. 71 Baoji Seabird Metal Revenue and Growth Rate
    FIG. 72 Baoji Seabird Metal Market Share
    FIG. 73 Market Dynamics
    FIG. 74 Global Shape Memory Alloys – Value Chain Analysis
    FIG. 75 Technology Roadmap and Timeline
    FIG. 76 Market Attractiveness Analysis – By Type
    FIG. 77 Market Attractiveness Analysis – By Application
    FIG. 78 Market Attractiveness Analysis – By Region
    FIG. 79 Market Channel
    FIG. 80 Marketing Channel Development Trend
    FIG. 81 Growth in World Gross Product, 2008-2018

    List of Tables

    TABLE 1 Global Shape Memory Alloys Market, 2018 & 2025 (USD Million)
    TABLE 2 Global Shape Memory Alloys market, by Type, 2016-2026 (USD Million)
    TABLE 3 Global Shape Memory Alloys market, by Application, 2016-2026 (USD Million)
    TABLE 4 Global Shape Memory Alloys market, by Region, 2016-2026 (USD Million)
    TABLE 5 North America Shape Memory Alloys Market, by Type, 2016-2026 (USD Million)
    TABLE 6 North America Shape Memory Alloys Market, by Application, 2016-2026 (USD Million)
    TABLE 7 Europe Shape Memory Alloys Market, by Type, 2016-2026 (USD Million)
    TABLE 8 Europe Shape Memory Alloys Market, by Application, 2016-2026 (USD Million)
    TABLE 9 Asia Pacific Shape Memory Alloys Market, by Type, 2016-2026 (USD Million)
    TABLE 10 Asia Pacific Shape Memory Alloys Market, by Application, 2016-2026 (USD Million)
    TABLE 11 Latin America Shape Memory Alloys Market, by Type, 2016-2026 (USD Million)
    TABLE 12 Latin America Shape Memory Alloys Market, by Application, 2016-2026 (USD Million)
    TABLE 13 The Middle-East and Africa Shape Memory Alloys Market, by Type, 2016-2026 (USD Million)
    TABLE 14 The Middle-East and Africa Shape Memory Alloys Market, by Application, 2016-2026 (USD Million)
    TABLE 15 Global Shape Memory Alloys Market - Company Revenue Analysis 2016-2019 (USD Million)
    TABLE 16 Global Shape Memory Alloys Market - Company Revenue Share Analysis 2016-2019(%)
    TABLE 17 Acquisitions and Mergers
    TABLE 18 New Product/Service Launch
    TABLE 19 Research & Development Activities
    TABLE 20 Market Drivers
    TABLE 21 Market Restraints
    TABLE 22 Market Opportunities
    
  •  

    Industry Major Market Players

    • Nitinol Devices & Components
    • SAES Getters
    • G.RAU GmbH & Co. KG ATI
    • Johnson Matthey
    • Fort Wayne Metals
    • Furukawa Electric
    • Nippon Steel & Sumitomo Metal
    • Nippon Seisen
    • Metalwerks PMD
    • Ultimate NiTi Technologies
    • Dynalloy
    • PEIER Tech
    • Baoji Seabird Metal