Search Market Research Report

Discover Our Latest Reports
Discover Our Featured Reports
Discover Top Selling Reports

Sesame Market Size, Share Global Analysis Report, 2020–2026

report img

Sesame Market By Product (Processed, Virgin), By End User (Food Services, Food Processor, Retail) and By Distribution Channel (Modern Trade, Franchise Outlets, Specialty Stores, Online): Global Industry Outlook, Market Size, Business Intelligence, Consumer Preferences, Statistical Surveys, Comprehensive Analysis, Historical Developments, Current Trends, and Forecast 2020–2026

Industry Insights

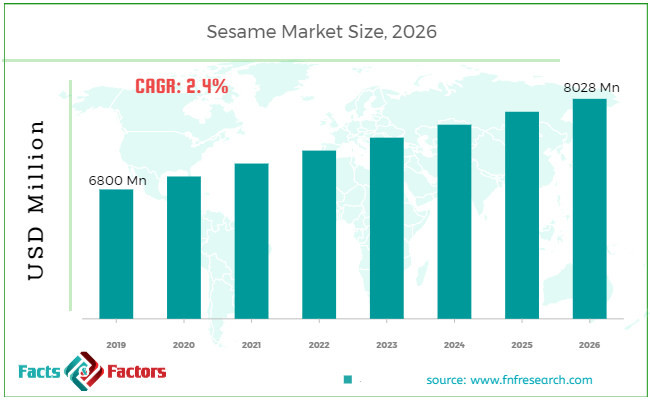
[178+ Pages Report] According to the report published by Facts Factors, the global sesame market size was worth around USD 6,800 million in 2019 and is predicted to grow to around USD 8,028 million by 2026 with a compound annual growth rate (CAGR) of roughly 2.4% between 2020 and 2026. The report analyzes the global sesame market drivers, restraints/challenges, and the effect they have on the demands during the projection period. In addition, the report explores emerging opportunities in the sesame market.

Sesame Market Size

To know more about this report | Request Free Sample Copy

This specialized and expertise-oriented industry research report scrutinizes the technical and commercial business outlook of the Sesame industry. The report analyzes and declares the historical and current trends analysis of the sesame industry and subsequently recommends the projected trends anticipated to be observed in the sesame market during the upcoming years.

The sesame market report analyzes and notifies the industry statistics at the global as well as regional and country levels in order to acquire a thorough perspective of the entire sesame market. The historical and past insights are provided for FY 2016 to FY 2019 whereas projected trends are delivered for FY 2020 to FY 2026. The quantitative and numerical data is represented in terms of value (Million) from FY 2016 – 2026.


logoKey Insights from Primary Research

  • In-depth and exhaustive interviews with chief executives of the major companies operating in the global sesame market, the primary research analysis concludes that the global sesame oil market to witness steady growth of nearly 2.4% over the forecast period.
  • In the year 2019, the market was valued at approximately USD 6800 Million, 2019 and is expected to be valued at over USD 8028 Million by 2026.
  • On the basis of the product segment, processed sesame is expected to exhibit the highest growth rate in the global sesame oil market during the forecast period. The specialty stores are expected to generate maximum demand for the sesame oil system in the near future.
  • The European region is expected to be the remain most attractive revenue-generating region for sesame oil over the forecast period. The Asia Pacific market is also expected to contribute heavily to the global sesame oil market.

logoKey Recommendations from Analysts

  • Our analysts recommend increased focus on the Asia Pacific market as it has a large potential for faster market growth. The presence of economies like India, China, Korea, and Japan provides the immense potential for growth in the region.
  • Strategic developments such as regional expansion and modern supply chain establishment by the major companies are likely to boom global sesame oil consumption over the upcoming years.
  • Our analysts also recommend that the North American region is predicted to witness significant growth attributed to the growing demand for sesame oil, rising vegan population, and higher health-conscious population in the region.
  • North America and the European region are expected to remain a significant sources of revenue during the studied period. Regional dominance in these regions is expected to provide additional capital capabilities for expansion beyond the borders.

logoMarket Share Analysis by Region - 2026


The quantitative data is further underlined and reinforced by comprehensive qualitative data which comprises various across-the-board market dynamics. The rationales which directly or indirectly impact the sesame industry are exemplified through parameters such as growth drivers, restraints, challenges, and opportunities among other impacting factors.

Throughout our research report, we have encompassed all the proven models and tools of industry analysis and extensively illustrated all the key business strategies and business models adopted in the sesame industry. The report provides an all-inclusive and detailed competitive landscape prevalent in the sesame market.

The report utilizes established industry analysis tools and models such as Porter’s Five Forces framework to analyze and recognize critical business strategies adopted by various stakeholders involved in the entire value chain of the sesame industry. The sesame market report additionally employs SWOT analysis and PESTLE analysis models for further in-depth analysis.

The report study further includes an in-depth analysis of industry players' market shares and provides an overview of leading players' market position in the sesame sector. Key strategic developments in the Sesame market competitive landscape such as acquisitions & mergers, inaugurations of different products and services, partnerships & joint ventures, MoU agreements, VC & funding activities, R&D activities, and geographic expansion among other noteworthy activities by key players of the sesame market are appropriately highlighted in the report.

The demand for sesame oil has been rising with increasing consumption by customers. This shift in consumer demand has been observed majorly in Asia and North American regions. The import and export of sesame oil have been favored by the Government's initiatives which in turn is expected to positively impact the sesame farming sector.

Additionally, the growing use of sesame oil in various types of cuisines, ayurvedic products, beauty products, and massage oils is further propelling the growth of the global sesame oil market.

The sesame market research report delivers an acute valuation and taxonomy of the sesame industry by practically splitting the market based on product, end-user, distribution channel, and region. Through the analysis of the historical and projected trends, all the segments and sub-segments were evaluated through the bottom-up approach, and different market sizes have been projected for FY 2020 to FY 2026.

logoReport Scope

Report Attribute

Details

Market Size in 2019

USD 6,800 Million

Projected Market Size in 2026

USD 8,028 Million

CAGR Growth Rate

2.4% CAGR

Base Year

2019

Forecast Years

2020-2026

Key Market Players

Cargill Inc., Ruchi Soya Industries Limited, Archer Daniels Midland Company, Olympic Oils Limited, Marico Limited, American Vegetable Oils, Inc., ConAgra Foods (Agrotech Foods Ltd), The Adani Wilmar Ltd., Associated British Foods plc., Adams Group Inc., Borges International Group S.L.U. Bunge Limited and Fuji Oil Holdings Inc.,., and Others

Key Segment

By Scale, End User, Distribution and Region

Major Regions Covered

North America, Europe, Asia Pacific, Latin America, and the Middle East & Africa

Purchase Options

Request customized purchase options to meet your research needs.Explore purchase options

The regional segmentation of the sesame industry includes the complete classification of all the major continents including North America, Latin America, Europe, Asia Pacific, and the Middle East & Africa. Further, country-wise data for the sesame industry is provided for the leading economies of the world.

The sesame market is segmented based on product, end-user, distribution channel, and region. On the basis of product, the market is classified into processed and virgin. On the basis of end users, the market is bifurcated into food services, food processor,s and retail. On the basis of distribution channel segmentation, the market is classified into modern trade, franchise outlets, specialty stores, and online.

logoSome of the essential players operating in the sesame market, but not restricted include

  • Archer Daniels Midland Company
  • Ruchi Soya Industries Limited
  • The Adani Wilmar Ltd.
  • Marico Limited
  • ConAgra Foods (Agrotech Foods Ltd)
  • Olympic Oils Limited
  • Cargill Inc.
  • American Vegetable Oils Inc.
  • Adams Group Inc.
  • Fuji Oil Holdings Inc.
  • Bunge Limited
  • Associated British Foods plc. 
  • Borges International Group S.L.U.

The taxonomy of the sesame industry by its scope and segmentation is as follows:

logo By Scale Range Segmentation Analysis

  • Processed
  • Virgin

logoBy End User Segmentation Analysis

  • Food Services
  • Food Processor
  • Retail

logo By Distribution Channel Segmentation Analysis

  • Modern Trade
  • Franchise Outlets
  • Specialty Stores
  • Online

logoBy Regional Segmentation Analysis

  • North America
    • The U.S. `
    • Canada
  • Europe
    • Germany
    • The UK
    • France
    • Spain
    • Italy
    • Rest of Europe
  • Asia Pacific
    • China
    • Japan
    • India
    • South Korea
    • Southeast Asia
    • Rest of Asia Pacific
  • Latin America
    • Brazil
    • Mexico
    • Rest of Latin America
  • Middle East & Africa
    • GCC
    • South Africa
    • Rest of Middle East & Africa

Table of Content

  1. CHAPTER 1. Executive Summary
  2. CHAPTER 2. Sesame Oil market – Product Analysis
    1. 2.1. Global Sesame Oil Market – Product Overview
    2. 2.2. Global Sesame Oil Market Share, by Product, 2019 & 2026 (USD Million)
    3. 2.3. Processed
      1. 2.3.1. Global Processed Sesame Oil Market, 2016-2026 (USD Million)
    4. 2.4. Virgin
      1. 2.4.1. Global Virgin Sesame Oil Market, 2016-2026 (USD Million)
  3. CHAPTER 3. Sesame Oil market – End User Analysis
    1. 3.1. Global Sesame Oil Market – End User Overview
    2. 3.2. Global Sesame Oil Market Share, by End User, 2019 & 2026 (USD Million)
    3. 3.3. Food Services
      1. 3.3.1. Global Food Services Sesame Oil Market, 2016-2026 (USD Million)
    4. 3.4. Food Processor
      1. 3.4.1. Global Food Processor Sesame Oil Market, 2016-2026 (USD Million)
    5. 3.5. Retail
      1. 3.5.1. Global Retail Sesame Oil Market, 2016-2026 (USD Million)
  4. CHAPTER 4. Sesame Oil market – Distribution Channel Analysis
    1. 4.1. Global Sesame Oil Market – Distribution Channel Overview
    2. 4.2. Global Sesame Oil Market Share, by Distribution Channel, 2019 & 2026 (USD Million)
    3. 4.3. Modern Trade
      1. 4.3.1. Global Modern Trade Sesame Oil Market, 2016-2026 (USD Million)
    4. 4.4. Franchise Outlets
      1. 4.4.1. Global Franchise Outlets Sesame Oil Market, 2016-2026 (USD Million)
    5. 4.5. Specialty Stores
      1. 4.5.1. Global Specialty Stores Sesame Oil Market, 2016-2026 (USD Million)
    6. 4.6. Online
      1. 4.6.1. Global Online Sesame Oil Market, 2016-2026 (USD Million)
  5. CHAPTER 5. Sesame Oil market – Regional Analysis
    1. 5.1. Global Sesame Oil Market Regional Overview
    2. 5.2. Global Sesame Oil Market Share, by Region, 2019 & 2026 (Value)
    3. 5.3. North America
      1. 5.3.1. North America Sesame Oil Market size and forecast, 2016-2026
      2. 5.3.2. North America Sesame Oil Market, by Country, 2019 & 2026 (USD Million)
      3. 5.3.3. North America Sesame Oil Market, by Product, 2016-2026
        1. 5.3.3.1. North America Sesame Oil Market, by Product, 2016-2026 (USD Million)
      4. 5.3.4. North America Sesame Oil Market, by End User, 2016-2026
        1. 5.3.4.1. North America Sesame Oil Market, by End User, 2016-2026 (USD Million)
      5. 5.3.5. North America Sesame Oil Market, by Distribution Channel, 2016-2026
        1. 5.3.5.1. North America Sesame Oil Market, by Distribution Channel, 2016-2026 (USD Million)
      6. 5.3.6. U.S.
        1. 5.3.6.1. U.S. Market size and forecast, 2016-2026 (USD Million)
      7. 5.3.7. Canada
        1. 5.3.7.1. Canada Market size and forecast, 2016-2026 (USD Million)
    4. 5.4. Europe
      1. 5.4.1. Europe Sesame Oil Market size and forecast, 2016-2026
      2. 5.4.2. Europe Sesame Oil Market, by Country, 2019 & 2026 (USD Million)
      3. 5.4.3. Europe Sesame Oil Market, by Product, 2016-2026
        1. 5.4.3.1. Europe Sesame Oil Market, by Product, 2016-2026 (USD Million)
      4. 5.4.4. Europe Sesame Oil Market, by End User, 2016-2026
        1. 5.4.4.1. Europe Sesame Oil Market, by End User, 2016-2026 (USD Million)
      5. 5.4.5. Europe Sesame Oil Market, by Distribution Channel, 2016-2026
        1. 5.4.5.1. Europe Sesame Oil Market, by Distribution Channel, 2016-2026 (USD Million)
      6. 5.4.6. Germany
        1. 5.4.6.1. Germany Market size and forecast, 2016-2026 (USD Million)
      7. 5.4.7. France
        1. 5.4.7.1. France Market size and forecast, 2016-2026 (USD Million)
      8. 5.4.8. U.K.
        1. 5.4.8.1. U.K. Market size and forecast, 2016-2026 (USD Million)
      9. 5.4.9. Italy
        1. 5.4.9.1. Italy Market size and forecast, 2016-2026 (USD Million)
      10. 5.4.10. Spain
        1. 5.4.10.1. Spain Market size and forecast, 2016-2026 (USD Million)
      11. 5.4.11. Rest of Europe
        1. 5.4.11.1. Rest of Europe Market size and forecast, 2016-2026 (USD Million)
    5. 5.5. Asia Pacific
      1. 5.5.1. Asia Pacific Sesame Oil Market size and forecast, 2016-2026
      2. 5.5.2. Asia Pacific Sesame Oil Market, by Country, 2019 & 2026 (USD Million)
      3. 5.5.3. Asia Pacific Sesame Oil Market, by Product, 2016-2026
        1. 5.5.3.1. Asia Pacific Sesame Oil Market, by Product, 2016-2026 (USD Million)
      4. 5.5.4. Asia Pacific Sesame Oil Market, by End User, 2016-2026
        1. 5.5.4.1. Asia Pacific Sesame Oil Market, by End User, 2016-2026 (USD Million)
      5. 5.5.5. Asia Pacific Sesame Oil Market, by Distribution Channel, 2016-2026
        1. 5.5.5.1. Asia Pacific Sesame Oil Market, by Distribution Channel, 2016-2026 (USD Million)
      6. 5.5.6. China
        1. 5.5.6.1. China Market size and forecast, 2016-2026 (USD Million)
      7. 5.5.7. Japan
        1. 5.5.7.1. Japan Market size and forecast, 2016-2026 (USD Million)
      8. 5.5.8. India
        1. 5.5.8.1. India Market size and forecast, 2016-2026 (USD Million)
      9. 5.5.9. South Korea
        1. 5.5.9.1. South Korea Market size and forecast, 2016-2026 (USD Million)
      10. 5.5.10. South-East Asia
        1. 5.5.10.1. South-East Asia Market size and forecast, 2016-2026 (USD Million)
      11. 5.5.11. Rest of Asia Pacific
        1. 5.5.11.1. Rest of Asia Pacific Market size and forecast, 2016-2026 (USD Million)
    6. 5.6. Latin America
      1. 5.6.1. Latin America Sesame Oil Market size and forecast, 2016-2026
      2. 5.6.2. Latin America Sesame Oil Market, by Country, 2019 & 2026 (USD Million)
      3. 5.6.3. Latin America Sesame Oil Market, by Product, 2016-2026
        1. 5.6.3.1. Latin America Sesame Oil Market, by Product, 2016-2026 (USD Million)
      4. 5.6.4. Latin America Sesame Oil Market, by End User, 2016-2026
        1. 5.6.4.1. Latin America Sesame Oil Market, by End User, 2016-2026 (USD Million)
      5. 5.6.5. Latin America Sesame Oil Market, by Distribution Channel, 2016-2026
        1. 5.6.5.1. Latin America Sesame Oil Market, by Distribution Channel, 2016-2026 (USD Million)
      6. 5.6.6. Brazil
        1. 5.6.6.1. Brazil Market size and forecast, 2016-2026 (USD Million)
      7. 5.6.7. Mexico
        1. 5.6.7.1. Mexico Market size and forecast, 2016-2026 (USD Million)
      8. 5.6.8. Rest of Latin America
        1. 5.6.8.1. Rest of Latin America Market size and forecast, 2016-2026 (USD Million)
    7. 5.7. The Middle-East and Africa
      1. 5.7.1. The Middle-East and Africa Sesame Oil Market size and forecast, 2016-2026
      2. 5.7.2. The Middle-East and Africa Sesame Oil Market, by Country, 2019 & 2026 (USD Million)
      3. 5.7.3. The Middle-East and Africa Sesame Oil Market, by Product, 2016-2026
        1. 5.7.3.1. The Middle-East and Africa Sesame Oil Market, by Product, 2016-2026 (USD Million)
      4. 5.7.4. The Middle-East and Africa Sesame Oil Market, by End User, 2016-2026
        1. 5.7.4.1. The Middle-East and Africa Sesame Oil Market, by End User, 2016-2026 (USD Million)
      5. 5.7.5. The Middle-East and Africa Sesame Oil Market, by Distribution Channel, 2016-2026
        1. 5.7.5.1. The Middle-East and Africa Sesame Oil Market, by Distribution Channel, 2016-2026 (USD Million)
      6. 5.7.6. GCC Countries
        1. 5.7.6.1. GCC Countries Market size and forecast, 2016-2026 (USD Million)
      7. 5.7.7. South Africa
        1. 5.7.7.1. South Africa Market size and forecast, 2016-2026 (USD Million)
      8. 5.7.8. Rest of Middle-East Africa
        1. 5.7.8.1. Rest of Middle-East Africa Market size and forecast, 2016-2026 (USD Million)
  6. CHAPTER 6. Sesame Oil market – Competitive Landscape
    1. 6.1. Competitor Market Share – Revenue
    2. 6.2. Market Concentration Rate Analysis, Top 3 and Top 5 Players
    3. 6.3. Strategic Development
      1. 6.3.1. Acquisitions and Mergers
      2. 6.3.2. New Products
      3. 6.3.3. Research & Development Activities
  7. CHAPTER 7. Company Profiles
    1. 7.1. Archer Daniels Midland Company
      1. 7.1.1. Company Overview
      2. 7.1.2. Archer Daniels Midland Company Revenue and Gross Margin
      3. 7.1.3. Product portfolio
      4. 7.1.4. Recent initiatives
    2. 7.2. Ruchi Soya Industries Limited
      1. 7.2.1. Company Overview
      2. 7.2.2. Ruchi Soya Industries Limited Revenue and Gross Margin
      3. 7.2.3. Product portfolio
      4. 7.2.4. Recent initiatives
    3. 7.3. The Adani Wilmar Ltd.
      1. 7.3.1. Company Overview
      2. 7.3.2. The Adani Wilmar Ltd. Revenue and Gross Margin
      3. 7.3.3. Product portfolio
      4. 7.3.4. Recent initiatives
    4. 7.4. Marico Limited
      1. 7.4.1. Company Overview
      2. 7.4.2. Marico Limited Revenue and Gross Margin
      3. 7.4.3. Product portfolio
      4. 7.4.4. Recent initiatives
    5. 7.5. ConAgra Foods (Agrotech Foods Ltd)
      1. 7.5.1. Company Overview
      2. 7.5.2. ConAgra Foods (Agrotech Foods Ltd) Revenue and Gross Margin
      3. 7.5.3. Product portfolio
      4. 7.5.4. Recent initiatives
    6. 7.6. Olympic Oils Limited
      1. 7.6.1. Company Overview
      2. 7.6.2. Olympic Oils Limited Revenue and Gross Margin
      3. 7.6.3. Product portfolio
      4. 7.6.4. Recent initiatives
    7. 7.7. Cargill Inc.
      1. 7.7.1. Company Overview
      2. 7.7.2. Cargill Inc. Revenue and Gross Margin
      3. 7.7.3. Product portfolio
      4. 7.7.4. Recent initiatives
    8. 7.8. American Vegetable Oils, Inc.
      1. 7.8.1. Company Overview
      2. 7.8.2. American Vegetable Oils, Inc. Revenue and Gross Margin
      3. 7.8.3. Product portfolio
      4. 7.8.4. Recent initiatives
    9. 7.9. Adams Group Inc.
      1. 7.9.1. Company Overview
      2. 7.9.2. Adams Group Inc. Revenue and Gross Margin
      3. 7.9.3. Product portfolio
      4. 7.9.4. Recent initiatives
    10. 7.10. Fuji Oil Holdings Inc.
      1. 7.10.1. Company Overview
      2. 7.10.2. Fuji Oil Holdings Inc. Revenue and Gross Margin
      3. 7.10.3. Product portfolio
      4. 7.10.4. Recent initiatives
    11. 7.11. Bunge Limited
      1. 7.11.1. Company Overview
      2. 7.11.2. Bunge Limited Revenue and Gross Margin
      3. 7.11.3. Product portfolio
      4. 7.11.4. Recent initiatives
    12. 7.12. Associated British Foods plc.
      1. 7.12.1. Company Overview
      2. 7.12.2. Associated British Foods plc. Revenue and Gross Margin
      3. 7.12.3. Product portfolio
      4. 7.12.4. Recent initiatives
    13. 7.13. Borges International Group S.L.U.
      1. 7.13.1. Company Overview
      2. 7.13.2. Borges International Group S.L.U. Revenue and Gross Margin
      3. 7.13.3. Product portfolio
      4. 7.13.4. Recent initiatives
  8. CHAPTER 8. Sesame Oil — Industry Analysis
    1. 8.1. Sesame Oil Market – Key Trends
      1. 8.1.1. Market Drivers
      2. 8.1.2. Market Restraints
      3. 8.1.3. Market Opportunities
    2. 8.2. Value Chain Analysis
    3. 8.3. Technology Roadmap and Timeline
    4. 8.4. Sesame Oil Market – Attractiveness Analysis
      1. 8.4.1. By Product
      2. 8.4.2. By End User
      3. 8.4.3. By Distribution Channel
      4. 8.4.4. By Region
  9. CHAPTER 9. Marketing Strategy Analysis, Distributors
    1. 9.1. Marketing Channel
    2. 9.2. Direct Marketing
    3. 9.3. Indirect Marketing
    4. 9.4. Marketing Channel Development Trend
    5. 9.5. Economic/Political Environmental Change
  10. CHAPTER 10. Report Conclusion
  11. CHAPTER 11. Research Approach & Methodology
    1. 11.1. Report Description
    2. 11.2. Research Scope
    3. 11.3. Research Methodology
      1. 11.3.1. Secondary Research
      2. 11.3.2. Primary Research
      3. 11.3.3. Models
        1. 11.3.3.1. Company Share Analysis Model
        2. 11.3.3.2. Revenue Based Modeling
        3. 11.3.3.3. Research Limitations

        List of Figures

        FIG. 1 Global Sesame Oil Market, 2016-2026 (USD Million)
        FIG. 2 Global Sesame Oil Market Share, by  Product, 2019 & 2026 (USD Million)
        FIG. 3 Global Processed Sesame Oil Market, 2016-2026 (USD Million)
        FIG. 4 Global Virgin Sesame Oil Market, 2016-2026 (USD Million)
        FIG. 5 Global Sesame Oil Market Share, by End User, 2019 & 2026 (USD Million)
        FIG. 6 Global Food Services Sesame Oil Market, 2016-2026 (USD Million)
        FIG. 7 Global Food Processor Sesame Oil Market, 2016-2026 (USD Million)
        FIG. 8 Global Retail Sesame Oil Market, 2016-2026 (USD Million)
        FIG. 9 Global Sesame Oil Market Share, by Distribution Channel, 2019 & 2026 (USD Million)
        FIG. 10 Global Modern Trade Sesame Oil Market, 2016-2026 (USD Million)
        FIG. 11 Global Franchise Outlets Sesame Oil Market, 2016-2026 (USD Million)
        FIG. 12 Global Specialty Stores Sesame Oil Market, 2016-2026 (USD Million)
        FIG. 13 Global Online Sesame Oil Market, 2016-2026 (USD Million)
        FIG. 14 Global Sesame Oil Market Share, by Region, 2019 & 2026
        FIG. 15 North America Sesame Oil Market, 2016-2026
        FIG. 16 U.S. Sesame Oil Market, 2016-2026
        FIG. 17 Canada Sesame Oil Market, 2016-2026
        FIG. 18 Europe Sesame Oil Market, 2016-2026
        FIG. 19 Germany Sesame Oil Market, 2016-2026
        FIG. 20 France Sesame Oil Market, 2016-2026
        FIG. 21 U.K. Sesame Oil Market, 2016-2026
        FIG. 22 Italy Sesame Oil Market, 2016-2026
        FIG. 23 Spain Sesame Oil Market, 2016-2026
        FIG. 24 Rest of Europe Sesame Oil Market, 2016-2026
        FIG. 25 Asia Pacific Sesame Oil Market, 2016-2026
        FIG. 26 China Sesame Oil Market, 2016-2026
        FIG. 27 Japan Sesame Oil Market, 2016-2026
        FIG. 28 India Sesame Oil Market, 2016-2026
        FIG. 29 South  Korea Sesame Oil Market, 2016-2026
        FIG. 30 South-East Asia Sesame Oil Market, 2016-2026
        FIG. 31 Rest of Asia Pacific Sesame Oil Market, 2016-2026
        FIG. 32 Latin America Sesame Oil Market, 2016-2026
        FIG. 33 Brazil Sesame Oil Market, 2016-2026
        FIG. 34 Mexico Sesame Oil Market, 2016-2026
        FIG. 35 Rest of Latin America Sesame Oil Market, 2016-2026
        FIG. 36 The Middle-East and Africa Sesame Oil Market, 2016-2026
        FIG. 37 GCC Countries Sesame Oil Market, 2016-2026
        FIG. 38 South Africa Sesame Oil Market, 2016-2026
        FIG. 39 Rest of Middle-East Africa Sesame Oil Market, 2016-2026
        FIG. 40 Competitor Market Share – Revenue
        FIG. 41 Archer Daniels Midland Company Revenue and Growth Rate
        FIG. 42 Archer Daniels Midland Company Market Share
        FIG. 43 Ruchi Soya Industries Limited Revenue and Growth Rate
        FIG. 44 Ruchi Soya Industries Limited Market Share
        FIG. 45 The Adani Wilmar Ltd. Revenue and Growth Rate
        FIG. 46 The Adani Wilmar Ltd. Market Share
        FIG. 47 Marico Limited Revenue and Growth Rate
        FIG. 48 Marico Limited Market Share
        FIG. 49 ConAgra Foods (Agrotech Foods Ltd) Revenue and Growth Rate
        FIG. 50 ConAgra Foods (Agrotech Foods Ltd) Market Share
        FIG. 51 Olympic Oils Limited Revenue and Growth Rate
        FIG. 52 Olympic Oils Limited Market Share
        FIG. 53 Cargill Inc. Revenue and Growth Rate
        FIG. 54 Cargill Inc. Market Share
        FIG. 55 American Vegetable Oils, Inc. Revenue and Growth Rate
        FIG. 56 American Vegetable Oils, Inc. Market Share
        FIG. 57 Adams Group Inc. Revenue and Growth Rate
        FIG. 58 Adams Group Inc. Market Share
        FIG. 59 Fuji Oil Holdings Inc. Revenue and Growth Rate
        FIG. 60 Fuji Oil Holdings Inc. Market Share
        FIG. 61 Bunge Limited Revenue and Growth Rate
        FIG. 62 Bunge Limited Market Share
        FIG. 63 Associated British Foods plc. Revenue and Growth Rate
        FIG. 64 Associated British Foods plc. Market Share
        FIG. 65 Borges International Group S.L.U. Revenue and Growth Rate
        FIG. 66 Borges International Group S.L.U. Market Share
        FIG. 67 Market Dynamics
        FIG. 68 Global Sesame Oil – Value Chain Analysis
        FIG. 69 Technology Roadmap and Timeline
        FIG. 70 Market Attractiveness Analysis – By  Product
        FIG. 71 Market Attractiveness Analysis – By End User
        FIG. 72 Market Attractiveness Analysis – By Distribution Channel
        FIG. 73 Market Attractiveness Analysis – By Region
        FIG. 74 Market Channel
        FIG. 75 Marketing Channel Development Trend
        FIG. 76 Growth in World Gross Product, 2008-2019
        

        List of Tables

        TABLE 1 Global Sesame Oil Market, 2019 & 2026 (USD Million)
        TABLE 2 Global Sesame Oil market, by  Product, 2016-2026 (USD Million)
        TABLE 3 Global Sesame Oil market, by End User, 2016-2026 (USD Million)
        TABLE 4 Global Sesame Oil market, by Distribution Channel, 2016-2026 (USD Million)
        TABLE 5 Global Sesame Oil market, by Region, 2016-2026 (USD Million)
        TABLE 6 North America Sesame Oil Market, by  Product, 2016-2026 (USD Million)
        TABLE 7 North America Sesame Oil Market, by End User, 2016-2026 (USD Million)
        TABLE 8 North America Sesame Oil Market, by Distribution Channel, 2016-2026 (USD Million)
        TABLE 9 Europe Sesame Oil Market, by  Product, 2016-2026 (USD Million)
        TABLE 10 Europe Sesame Oil Market, by End User, 2016-2026 (USD Million)
        TABLE 11 Europe Sesame Oil Market, by Distribution Channel, 2016-2026 (USD Million)
        TABLE 12 Asia Pacific Sesame Oil Market, by  Product, 2016-2026 (USD Million)
        TABLE 13 Asia Pacific Sesame Oil Market, by End User, 2016-2026 (USD Million)
        TABLE 14 Asia Pacific Sesame Oil Market, by Distribution Channel, 2016-2026 (USD Million)
        TABLE 15 Latin America Sesame Oil Market, by  Product, 2016-2026 (USD Million)
        TABLE 16 Latin America Sesame Oil Market, by End User, 2016-2026 (USD Million)
        TABLE 17 Latin America Sesame Oil Market, by Distribution Channel, 2016-2026 (USD Million)
        TABLE 18 The Middle-East and Africa Sesame Oil Market, by  Product, 2016-2026 (USD Million)
        TABLE 19 The Middle-East and Africa Sesame Oil Market, by End User, 2016-2026 (USD Million)
        TABLE 20 The Middle-East and Africa Sesame Oil Market, by Distribution Channel, 2016-2026 (USD Million)
        TABLE 21 Global Sesame Oil Market - Company Revenue Analysis 2016-2019 (USD Million)
        TABLE 22 Global Sesame Oil Market - Company Revenue Share Analysis 2016-2019(%)
        TABLE 23 Acquisitions and Mergers
        TABLE 24 New Product/Service Launch
        TABLE 25 Research & Development Activities
        TABLE 26 Market Drivers
        TABLE 27 Market Restraints
        TABLE 28 Market Opportunities

Industry Major Market Players

  • Archer Daniels Midland Company
  • Ruchi Soya Industries Limited
  • The Adani Wilmar Ltd.
  • Marico Limited
  • ConAgra Foods (Agrotech Foods Ltd)
  • Olympic Oils Limited
  • Cargill Inc.
  • American Vegetable Oils Inc.
  • Adams Group Inc.
  • Fuji Oil Holdings Inc.
  • Bunge Limited
  • Associated British Foods plc. 
  • Borges International Group S.L.U.