Search Market Research Report

Discover Our Latest Reports
Discover Our Featured Reports
Discover Top Selling Reports

Selective Catalytic Reduction Market Size, Share Global Analysis Report, 2019–2026

report img

Selective Catalytic Reduction Market By Type (Anhydrous Ammonia-SCR, Aqueous Ammonia-SCR and Urea-SCR) and By Application (Transportation, Power Industry, Chemical Industry, Steel Plant and Others): Global Industry Perspective, Market Size, Statistical Research, Market Intelligence, Comprehensive Analysis, Historical Trends, and Forecast 2019–2026

Industry Insights

The report study analyzes the market statistics at the global as well as regional levels to gain an in-depth perspective of the overall Selective catalytic reduction Market. The historical insights are provided from 2016 to 2019 and projected trends are provided from 2020 to 2026. This professional and specialized report study examines the technical and business perspective of the Selective catalytic reduction industry. The report provides a historical analysis of the industry as well as the projected trends expected to be witnessed in the Selective catalytic reduction Market.

The quantitative data is provided in terms of both volumes (Units) and value (USD Million) for 2016 – 2026. The qualitative data is reinforced by analyzing and providing numerous market dynamics (directly or indirectly affecting the industry) such as growth drivers, restraints, challenges, and opportunities.

Selective Catalytic Reduction Market

To know more about this report | Request Free Sample Copy


logoKey Insights from Primary Research

  • Our primary respondents believe the market to witness a rapid growth of 8.6% over the forecast period on account of rising environmental concerns.
  • Some of the CXOs predict the transportation segment to maintain its dominance throughout 2026 due to an increase in the adoption of appropriate emission standards by several countries across the map. Furthermore, the manufacturers operating in this market are partnering and also expanding their presence through mergers and acquisitions across various industry verticals.
  • Some of the industry experts interviewed in the Asia Pacific revealed that the transportation segment is expected to generate considerable revenues for the Selective Catalytic Reduction industry. The rising adoption of automobiles in Asian countries is expected to propel market growth.
  • Regionally, the Asia Pacific region is expected to contribute largely to the global Selective Catalytic Reduction market. Some of the interviewees said that their future plans are to focus majorly innovating in features of Selective Catalytic Reduction application areas. The manufacturers operating in countries such as the U.S. and Canada are expected to create higher adoption opportunities for the Selective Catalytic Reduction market.
  • The information & technology subject matter experts suggest investing in R&D activities to come up with newer, economical, and more efficient Selective Catalytic Reduction. They believe advanced technology in the chemicals and automobile industry will witness widespread acceptance across the value chain of the Selective Catalytic Reduction market.

logoKey Recommendations from Analysts

  • Our analysts recommend focusing on the Asia Pacific Selective Catalytic Reduction market since their calculations revealed that this region turned out to be the top investment pocket across the globe owing to greater opportunities in emerging countries such as India and China.
  • The major reason behind the upsurge in growth and lucrative opportunities underlying in this region is the introduction of norms and regulations by various government organizations across the globe.
  • North America, on the other hand, is expected to foresee robust growth accounting for USD 3473.8 Mn in 2019. This is majorly attributed to rising high-end automobiles across the U.S. and Canada.
  • The strategic mergers and acquisitions by key industry players and high demand across application areas are anticipated to fuel the market growth
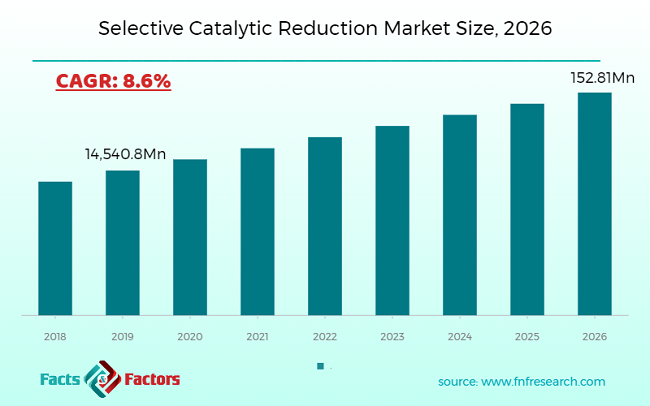
  • The executive summary of the report reads the total opportunity underlying the global Selective Catalytic Reduction market is nearly USD 23,888 Mn between 2020 and 2026.

logo
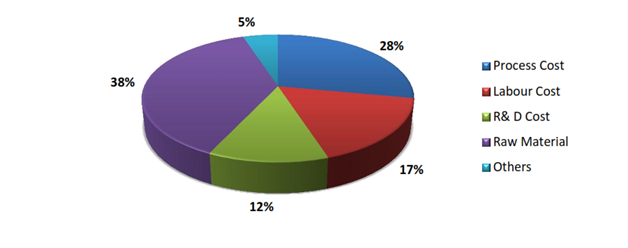
Selective Catalytic Reduction – Cost Structure

Selective catalytic reduction Market

To know more about this report | Request Free Sample Copy


We have included various industry analysis models in our report and extensively demonstrated the key business strategies and competitive landscape of the Selective catalytic reduction Market in our study.

Our study also includes an analysis of Porter’s Five Forces framework for understanding the competitive strategies adopted by various stakeholders involved in the entire value chain of the Selective catalytic reduction Market. It also encompasses PESTLE analysis and SWOT analysis.

The report also offers an in-depth analysis of the market shares of each industry player and gives an outline of the market position of key players in the Selective catalytic reduction Market. Moreover, the study offers wide coverage of key strategic advances witnessed in the market such as new product launches, acquisitions & mergers, collaborations & joint ventures, funding & VC activities, agreements, partnerships, R&D activities, and regional expansion of key players of the Selective catalytic reduction Market.

The research study provides a critical assessment of the Selective catalytic reduction industry by logically segmenting the market on the basis of product type, connectivity, port, distribution channel, and regions. Based on the past, present, and future trends, all the segments were analyzed from the bottom up, and the market sizes have been estimated from 2020 to 2026. The regional segmentation of the Selective catalytic reduction industry includes the holistic bifurcation of all five major continents including North America, Europe, Asia Pacific, Latin America, and the Middle East & Africa.

Selective Catalytic Reduction (SCR) is an emission-controlling process widely used to reduce the emission of nitrogen oxide emitted by vehicles, industries, and other chemical procedures. Selective catalytic reduction offers several benefits, for instance, better fuel economy, easy installation, and meets several emission standards among others.

There are specific rules and regulations governing emission control across various countries that are increasing the demand for selective catalytic reduction. With an increase in passenger vehicles across the globe, controlling hazardous gases has become mandatory. Counties in Asia Pacific have adhered to emission norms to curb environmental threats. Therefore, countries such as India, China, Japan, and others are considered as investment opportunities for selective catalytic reduction manufacturers. In North America, rising industrial activities are going through rapid growth owing to the increasing usage of selective catalytic reduction (SCR) for automotive and transportation, marine, chemical, and oil & gas end-use industries. This is expected to drive the transportation segment for a selective catalytic reduction market.

The Selective catalytic reduction Market is categorized by product type, and by application. The product type segment is further divided into Anhydrous Ammonia-SCR, Aqueous Ammonia-SCR, and Urea-SCR. By Application, the market is divided into Transportation, Power Industry, Chemical Industry, Steel Plant, and Others.

logoReport Scope

Report Attribute

Details

Market Size in 2019

USD 14,540.8 Million

Projected Market Size in 2026

USD 152.81 Million

CAGR Growth Rate

8.6% CAGR

Base Year

2020

Forecast Years

2020-2026

Key Market Players

Johnson Matthey, Hitachi Zosen, Wartsila, GEA, Babcock & Wilcox, Dürr, Rochling, Scheuch GmbH, Eminox, DCL International, Baumot, Babcock Power Environmental, VoSS, and Others.

Key Segment

By Product, By Application, By Region

Major Regions Covered

North America, Europe, Asia Pacific, Latin America, and the Middle East & Africa

Purchase Options

Request customized purchase options to meet your research needs. Explore purchase options

logoSome of the key players operating in the Selective catalytic reduction Market are as follows:

  •  Johnson Matthey
  •  Hitachi Zosen
  •  Wartsila
  •  GEA
  •  Babcock & Wilcox
  •  Dürr
  •  Rochling
  •  Scheuch GmbH
  •  Eminox
  •  DCL International
  •  Baumot
  •  Babcock Power Environmental
  •  VoSS

The taxonomy of the Selective catalytic reduction industry by its scope and segmentation is as follows:

logoGlobal Selective catalytic reduction Market: By Product Type Segmentation Analysis

  • Anhydrous Ammonia-SCR
  • Aqueous Ammonia-SCR
  • Urea-SCR

logoGlobal Selective catalytic reduction Market: By Application Segmentation Analysis

  • Transportation
  • Power Industry
  • Chemical Industry
  • Steel Plant
  • Others

logoGlobal Selective catalytic reduction Market: Regional Segmentation Analysis

  • North America
    • The U.S.
    • Canada
  • Europe
    • France
    • The UK
    • Spain
    • Germany
    • Italy
    • Rest of Europe
  • Asia Pacific
    • China
    • Japan
    • India
    • South Korea
    • Southeast Asia
    • Rest of Asia Pacific
  • Latin America
    • Brazil
    • Mexico
    • Rest of Latin America
  • Middle East & Africa
    • GCC
    • South Africa
    • Rest of Middle East & Africa

logoKEY BUSINESS POINTERS ADDRESSED & FOREMOST REASONS TO PROCURE THE REPORT:

  • Statistical Analysis of the Past, Current, and Future Trends of the Industry with Validated Market Sizes Data
  • Direct and Indirect Rationales Impacting the Industry
  • In-depth and Micro Analysis of Viable Segments and Sub-segments
  • Companies and Vendors Market Share, Competitive Landscape, and Player Positioning Analysis
  • Demand Side (Consumption) and Supply Side (Production) Perspective and Analysis wherever applicable
  • Key Buyers and End-Users Analysis
  • Value Chain and Manufacturing Cost Structure Analysis wherever relevant
  • Key Marketing Strategies as well as Key Sales Channels adopted in the market
  • Investment Opportunity Analysis & Patents Analysis wherever feasible
  • Technological Road Map & Technical Analysis
  • Robust Research Methodology comprising a dynamic mix (65%~35%) of Extensive Primary Research (primary interviews, ad-hoc surveys, questionnaires) and Protracted Secondary Research (proprietary in-house database, paid external databases, publically available validated sources)

Table of Content

  1. CHAPTER 1. Executive Summary
  2. CHAPTER 2. Selective Catalytic Reduction market – Product Analysis
    1. 2.1. Global Selective Catalytic Reduction Market – Product Overview
    2. 2.2. Global Selective Catalytic Reduction Market Share, by Product, 2018 & 2025
    3. 2.3. Global Selective Catalytic Reduction Market share, by Product, 2018 & 2025 (Units)
    4. 2.4. Anhydrous Ammonia-SCR
      1. 2.4.1. Global Anhydrous Ammonia-SCR Selective Catalytic Reduction Market, 2016-2026
      2. 2.4.2. Global Anhydrous Ammonia-SCR Selective Catalytic Reduction Market, 2016-2026 (Units)
    5. 2.5. Aqueous Ammonia-SCR
      1. 2.5.1. Global Aqueous Ammonia-SCR Selective Catalytic Reduction Market, 2016-2026
      2. 2.5.2. Global Aqueous Ammonia-SCR Selective Catalytic Reduction Market, 2016-2026 (Units)
    6. 2.6. Urea-SCR
      1. 2.6.1. Global Urea-SCR Selective Catalytic Reduction Market, 2016-2026
      2. 2.6.2. Global Urea-SCR Selective Catalytic Reduction Market, 2016-2026 (Units)
  3. CHAPTER 3. Selective Catalytic Reduction market – Application Analysis
    1. 3.1. Global Selective Catalytic Reduction Market – Application Overview
    2. 3.2. Global Selective Catalytic Reduction Market Share, by Application, 2018 & 2025
    3. 3.3. Global Selective Catalytic Reduction Market share, by Application, 2018 & 2025 (Units)
    4. 3.4. Transportation
      1. 3.4.1. Global Transportation Selective Catalytic Reduction Market, 2016-2026
      2. 3.4.2. Global Transportation Selective Catalytic Reduction Market, 2016-2026 (Units)
    5. 3.5. Power Industry
      1. 3.5.1. Global Power Industry Selective Catalytic Reduction Market, 2016-2026
      2. 3.5.2. Global Power Industry Selective Catalytic Reduction Market, 2016-2026 (Units)
    6. 3.6. Chemical Industry
      1. 3.6.1. Global Chemical Industry Selective Catalytic Reduction Market, 2016-2026
      2. 3.6.2. Global Chemical Industry Selective Catalytic Reduction Market, 2016-2026 (Units)
    7. 3.7. Steel Plant
      1. 3.7.1. Global Steel Plant Selective Catalytic Reduction Market, 2016-2026
      2. 3.7.2. Global Steel Plant Selective Catalytic Reduction Market, 2016-2026 (Units)
    8. 3.8. Others
      1. 3.8.1. Global Others Selective Catalytic Reduction Market, 2016-2026
      2. 3.8.2. Global Others Selective Catalytic Reduction Market, 2016-2026 (Units)
  4. CHAPTER 4. Selective Catalytic Reduction market – Regional Analysis
    1. 4.1. Global Selective Catalytic Reduction Market Regional Overview
    2. 4.2. Global Selective Catalytic Reduction Market Share, by Region, 2018 & 2025 (Value)
    3. 4.3. Global Selective Catalytic Reduction Market Share, by Region, 2018 & 2025 (Volume)
    4. 4.4. North America
      1. 4.4.1. North America Selective Catalytic Reduction Market size and forecast, 2016-2026
      2. 4.4.2. North America Selective Catalytic Reduction Market, by Country, 2018 - 2025
      3. 4.4.3. North America Market size and forecast, 2016-2026 (Units)
      4. 4.4.4. North America Selective Catalytic Reduction Market, by Country, 2018 - 2025 (Units)
      5. 4.4.5. North America Selective Catalytic Reduction Market, by Product, 2016-2026
        1. 4.4.5.1. North America Selective Catalytic Reduction Market, by Product, 2016-2026
        2. 4.4.5.2. North America Selective Catalytic Reduction Market, by Product, 2016-2026 (Units)
      6. 4.4.6. North America Selective Catalytic Reduction Market, by Application, 2016-2026
        1. 4.4.6.1. North America Selective Catalytic Reduction Market, by Application, 2016-2026
        2. 4.4.6.2. North America Selective Catalytic Reduction Market, by Application, 2016-2026 (Units)
      7. 4.4.7. U.S.
        1. 4.4.7.1. U.S. Market size and forecast, 2016-2026
        2. 4.4.7.2. U.S. Market size and forecast, 2016-2026 (Units)
      8. 4.4.8. Canada
        1. 4.4.8.1. Canada Market size and forecast, 2016-2026
        2. 4.4.8.2. Canada Market size and forecast, 2016-2026 (Units)
    5. 4.5. Europe
      1. 4.5.1. Europe Selective Catalytic Reduction Market size and forecast, 2016-2026
      2. 4.5.2. Europe Selective Catalytic Reduction Market, by Country, 2018 - 2025
      3. 4.5.3. Europe Market size and forecast, 2016-2026 (Units)
      4. 4.5.4. Europe Selective Catalytic Reduction Market, by Country, 2018 - 2025 (Units)
      5. 4.5.5. Europe Selective Catalytic Reduction Market, by Product, 2016-2026
        1. 4.5.5.1. Europe Selective Catalytic Reduction Market, by Product, 2016-2026
        2. 4.5.5.2. Europe Selective Catalytic Reduction Market, by Product, 2016-2026 (Units)
      6. 4.5.6. Europe Selective Catalytic Reduction Market, by Application, 2016-2026
        1. 4.5.6.1. Europe Selective Catalytic Reduction Market, by Application, 2016-2026
        2. 4.5.6.2. Europe Selective Catalytic Reduction Market, by Application, 2016-2026 (Units)
      7. 4.5.7. Germany
        1. 4.5.7.1. Germany Market size and forecast, 2016-2026
        2. 4.5.7.2. Germany Market size and forecast, 2016-2026 (Units)
      8. 4.5.8. France
        1. 4.5.8.1. France Market size and forecast, 2016-2026
        2. 4.5.8.2. France Market size and forecast, 2016-2026 (Units)
      9. 4.5.9. U.K.
        1. 4.5.9.1. U.K. Market size and forecast, 2016-2026
        2. 4.5.9.2. U.K. Market size and forecast, 2016-2026 (Units)
      10. 4.5.10. Italy
        1. 4.5.10.1. Italy Market size and forecast, 2016-2026
        2. 4.5.10.2. Italy Market size and forecast, 2016-2026 (Units)
      11. 4.5.11. Spain
        1. 4.5.11.1. Spain Market size and forecast, 2016-2026
        2. 4.5.11.2. Spain Market size and forecast, 2016-2026 (Units)
      12. 4.5.12. Rest of Europe
        1. 4.5.12.1. Rest of Europe Market size and forecast, 2016-2026
        2. 4.5.12.2. Rest of Europe Market size and forecast, 2016-2026 (Units)
    6. 4.6. Asia Pacific
      1. 4.6.1. Asia Pacific Selective Catalytic Reduction Market size and forecast, 2016-2026
      2. 4.6.2. Asia Pacific Selective Catalytic Reduction Market, by Country, 2018 - 2025
      3. 4.6.3. Asia Pacific Market size and forecast, 2016-2026 (Units)
      4. 4.6.4. Asia Pacific Selective Catalytic Reduction Market, by Country, 2018 - 2025 (Units)
      5. 4.6.5. Asia Pacific Selective Catalytic Reduction Market, by Product, 2016-2026
        1. 4.6.5.1. Asia Pacific Selective Catalytic Reduction Market, by Product, 2016-2026
        2. 4.6.5.2. Asia Pacific Selective Catalytic Reduction Market, by Product, 2016-2026 (Units)
      6. 4.6.6. Asia Pacific Selective Catalytic Reduction Market, by Application, 2016-2026
        1. 4.6.6.1. Asia Pacific Selective Catalytic Reduction Market, by Application, 2016-2026
        2. 4.6.6.2. Asia Pacific Selective Catalytic Reduction Market, by Application, 2016-2026 (Units)
      7. 4.6.7. China
        1. 4.6.7.1. China Market size and forecast, 2016-2026
        2. 4.6.7.2. China Market size and forecast, 2016-2026 (Units)
      8. 4.6.8. Japan
        1. 4.6.8.1. Japan Market size and forecast, 2016-2026
        2. 4.6.8.2. Japan Market size and forecast, 2016-2026 (Units)
      9. 4.6.9. India
        1. 4.6.9.1. India Market size and forecast, 2016-2026
        2. 4.6.9.2. India Market size and forecast, 2016-2026 (Units)
      10. 4.6.10. South Korea
        1. 4.6.10.1. South Korea Market size and forecast, 2016-2026
        2. 4.6.10.2. South Korea Market size and forecast, 2016-2026 (Units)
      11. 4.6.11. South-East Asia
        1. 4.6.11.1. South-East Asia Market size and forecast, 2016-2026
        2. 4.6.11.2. South-East Asia Market size and forecast, 2016-2026 (Units)
      12. 4.6.12. Rest of Asia Pacific
        1. 4.6.12.1. Rest of Asia Pacific Market size and forecast, 2016-2026
        2. 4.6.12.2. Rest of Asia Pacific Market size and forecast, 2016-2026 (Units)
    7. 4.7. Latin America
      1. 4.7.1. Latin America Selective Catalytic Reduction Market size and forecast, 2016-2026
      2. 4.7.2. Latin America Selective Catalytic Reduction Market, by Country, 2018 - 2025
      3. 4.7.3. Latin America Market size and forecast, 2016-2026 (Units)
      4. 4.7.4. Latin America Selective Catalytic Reduction Market, by Country, 2018 - 2025 (Units)
      5. 4.7.5. Latin America Selective Catalytic Reduction Market, by Product, 2016-2026
        1. 4.7.5.1. Latin America Selective Catalytic Reduction Market, by Product, 2016-2026
        2. 4.7.5.2. Latin America Selective Catalytic Reduction Market, by Product, 2016-2026 (Units)
      6. 4.7.6. Latin America Selective Catalytic Reduction Market, by Application, 2016-2026
        1. 4.7.6.1. Latin America Selective Catalytic Reduction Market, by Application, 2016-2026
        2. 4.7.6.2. Latin America Selective Catalytic Reduction Market, by Application, 2016-2026 (Units)
      7. 4.7.7. Brazil
        1. 4.7.7.1. Brazil Market size and forecast, 2016-2026
        2. 4.7.7.2. Brazil Market size and forecast, 2016-2026 (Units)
      8. 4.7.8. Mexico
        1. 4.7.8.1. Mexico Market size and forecast, 2016-2026
        2. 4.7.8.2. Mexico Market size and forecast, 2016-2026 (Units)
      9. 4.7.9. Rest of Latin America
        1. 4.7.9.1. Rest of Latin America Market size and forecast, 2016-2026
        2. 4.7.9.2. Rest of Latin America Market size and forecast, 2016-2026 (Units)
    8. 4.8. The Middle-East and Africa
      1. 4.8.1. The Middle-East and Africa Selective Catalytic Reduction Market size and forecast, 2016-2026
      2. 4.8.2. The Middle-East and Africa Selective Catalytic Reduction Market, by Country, 2018 - 2025
      3. 4.8.3. The Middle-East and Africa Market size and forecast, 2016-2026 (Units)
      4. 4.8.4. The Middle-East and Africa Selective Catalytic Reduction Market, by Country, 2018 - 2025 (Units)
      5. 4.8.5. The Middle-East and Africa Selective Catalytic Reduction Market, by Product, 2016-2026
        1. 4.8.5.1. The Middle-East and Africa Selective Catalytic Reduction Market, by Product, 2016-2026
        2. 4.8.5.2. The Middle-East and Africa Selective Catalytic Reduction Market, by Product, 2016-2026 (Units)
      6. 4.8.6. The Middle-East and Africa Selective Catalytic Reduction Market, by Application, 2016-2026
        1. 4.8.6.1. The Middle-East and Africa Selective Catalytic Reduction Market, by Application, 2016-2026
        2. 4.8.6.2. The Middle-East and Africa Selective Catalytic Reduction Market, by Application, 2016-2026 (Units)
      7. 4.8.7. GCC Countries
        1. 4.8.7.1. GCC Countries Market size and forecast, 2016-2026
        2. 4.8.7.2. GCC Countries Market size and forecast, 2016-2026 (Units)
      8. 4.8.8. South Africa
        1. 4.8.8.1. South Africa Market size and forecast, 2016-2026
        2. 4.8.8.2. South Africa Market size and forecast, 2016-2026 (Units)
      9. 4.8.9. Rest of Middle-East Africa
        1. 4.8.9.1. Rest of Middle-East Africa Market size and forecast, 2016-2026
        2. 4.8.9.2. Rest of Middle-East Africa Market size and forecast, 2016-2026 (Units)
  5. CHAPTER 5. Selective Catalytic Reduction Production, Consumption, Export, Import by Regions
    1. 5.1. Global Selective Catalytic Reduction production and revenue, 2015-2025 (Units)
    2. 5.2. Global Import and Export Analysis, by Region
  6. CHAPTER 6. Selective Catalytic Reduction market – Competitive Landscape
    1. 6.1. Competitor Market Share – Revenue
    2. 6.2. Market Concentration Rate Analysis, Top 3 and Top 5 Players
    3. 6.3. Competitor Market Share – Volume
    4. 6.4. Strategic Development
      1. 6.4.1. Acquisitions and Mergers
      2. 6.4.2. New Products
      3. 6.4.3. Research & Development Activities
  7. CHAPTER 7. Company Profiles
    1. 7.1. Johnson Matthey
      1. 7.1.1. Company Overview
      2. 7.1.2. Johnson Matthey Sales, Revenue, Price, and Gross Margin
      3. 7.1.3. Product portfolio
      4. 7.1.4. Recent initiatives
    2. 7.2. Hitachi Zosen
      1. 7.2.1. Company Overview
      2. 7.2.2. Hitachi Zosen Sales, Revenue, Price, and Gross Margin
      3. 7.2.3. Product portfolio
      4. 7.2.4. Recent initiatives
    3. 7.3. Wartsila
      1. 7.3.1. Company Overview
      2. 7.3.2. Wartsila Sales, Revenue, Price, and Gross Margin
      3. 7.3.3. Product portfolio
      4. 7.3.4. Recent initiatives
    4. 7.4. GEA
      1. 7.4.1. Company Overview
      2. 7.4.2. GEA Sales, Revenue, Price, and Gross Margin
      3. 7.4.3. Product portfolio
      4. 7.4.4. Recent initiatives
    5. 7.5. Babcock & Wilcox
      1. 7.5.1. Company Overview
      2. 7.5.2. Babcock & Wilcox Sales, Revenue, Price, and Gross Margin
      3. 7.5.3. Product portfolio
      4. 7.5.4. Recent initiatives
    6. 7.6. Dürr
      1. 7.6.1. Company Overview
      2. 7.6.2. Dürr Sales, Revenue, Price, and Gross Margin
      3. 7.6.3. Product portfolio
      4. 7.6.4. Recent initiatives
    7. 7.7. Rochling
      1. 7.7.1. Company Overview
      2. 7.7.2. Rochling Sales, Revenue, Price, and Gross Margin
      3. 7.7.3. Product portfolio
      4. 7.7.4. Recent initiatives
    8. 7.8. Scheuch GmbH
      1. 7.8.1. Company Overview
      2. 7.8.2. Scheuch GmbH Sales, Revenue, Price, and Gross Margin
      3. 7.8.3. Product portfolio
      4. 7.8.4. Recent initiatives
    9. 7.9. Eminox
      1. 7.9.1. Company Overview
      2. 7.9.2. Eminox Sales, Revenue, Price, and Gross Margin
      3. 7.9.3. Product portfolio
      4. 7.9.4. Recent initiatives
    10. 7.10. DCL International
      1. 7.10.1. Company Overview
      2. 7.10.2. DCL International Sales, Revenue, Price, and Gross Margin
      3. 7.10.3. Product portfolio
      4. 7.10.4. Recent initiatives
    11. 7.11. Baumot
      1. 7.11.1. Company Overview
      2. 7.11.2. Baumot Sales, Revenue, Price, and Gross Margin
      3. 7.11.3. Product portfolio
      4. 7.11.4. Recent initiatives
    12. 7.12. Babcock Power Environmental
      1. 7.12.1. Company Overview
      2. 7.12.2. Babcock Power Environmental Sales, Revenue, Price, and Gross Margin
      3. 7.12.3. Product portfolio
      4. 7.12.4. Recent initiatives
    13. 7.13. VoSS
      1. 7.13.1. Company Overview
      2. 7.13.2. VoSS Sales, Revenue, Price, and Gross Margin
      3. 7.13.3. Product portfolio
      4. 7.13.4. Recent initiatives
  8. CHAPTER 8. Selective Catalytic Reduction — Industry Analysis
    1. 8.1. Introduction and Taxonomy
    2. 8.2. Selective Catalytic Reduction Market – Key Trends
      1. 8.2.1. Market Drivers
      2. 8.2.2. Market Restraints
      3. 8.2.3. Market Opportunities
    3. 8.3. Value Chain Analysis
    4. 8.4. Key Mandates and Regulations
    5. 8.5. Technology Roadmap and Timeline
    6. 8.6. Selective Catalytic Reduction market – Attractiveness Analysis
      1. 8.6.1. By Product
      2. 8.6.2. By Application
      3. 8.6.3. By Region
  9. CHAPTER 9. Raw Material analysis
    1. 9.1. Selective Catalytic Reduction Key Raw Material Analysis
      1. 9.1.1. Key Raw Materials
      2. 9.1.2. Price Trend of Key Raw Materials
    2. 9.2. Key Suppliers of Raw Materials
    3. 9.3. Proportion of Manufacturing Cost Structure
      1. 9.3.1. Raw Materials
      2. 9.3.2. Labor Cost
    4. 9.4. Manufacturing Expenses Analysis of Selective Catalytic Reduction
  10. CHAPTER 10. Industrial Chain, Sourcing Strategy and Downstream Buyers
    1. 10.1. Selective Catalytic Reduction Industrial Chain Analysis
    2. 10.2. Upstream Raw Materials Sourcing
      1. 10.2.1. Risk Mitigation:
      2. 10.2.2. Supplier Relationships:
      3. 10.2.3. Business Processes:
      4. 10.2.4. Securing the Product:
    3. 10.3. Raw Materials Sources of Selective Catalytic Reduction Major Manufacturers in 2016
    4. 10.4. Downstream Buyers
    5. 10.5. Distributors/Traders List
  11. CHAPTER 11. Marketing Strategy Analysis, Distributors
    1. 11.1. Marketing Channel
    2. 11.2. Direct Marketing
    3. 11.3. Indirect Marketing
    4. 11.4. Marketing Channel Development Trend
    5. 11.5. Economic/Political Environmental Change
  12. CHAPTER 12. Report Conclusion
  13. CHAPTER 13. Research Approach & Methodology
    1. 13.1. Report Description
    2. 13.2. Research Scope
    3. 13.3. Research Methodology
      1. 13.3.1. Secondary Research
      2. 13.3.2. Primary Research
      3. 13.3.3. Models
        1. 13.3.3.1. Company Share Analysis Model
        2. 13.3.3.2. Revenue Based Modeling
        3. 13.3.3.3. Research Limitations"

        List of Figures

        FIG. 1 Global Selective Catalytic Reduction Market, 2016-2026 
        FIG. 2 Global Selective Catalytic Reduction Market Share, by Product, 2018 & 2025 
        FIG. 3 Global Selective Catalytic Reduction Market share, by Product, 2018 & 2025 (Units)
        FIG. 4 Global  Anhydrous Ammonia-SCR Selective Catalytic Reduction Market, 2016-2026 
        FIG. 5 Global  Anhydrous Ammonia-SCR Selective Catalytic Reduction  Market, 2016-2026 (Units)
        FIG. 6 Global Aqueous Ammonia-SCR Selective Catalytic Reduction Market, 2016-2026 
        FIG. 7 Global Aqueous Ammonia-SCR Selective Catalytic Reduction  Market, 2016-2026 (Units)
        FIG. 8 Global Urea-SCR Selective Catalytic Reduction Market, 2016-2026 
        FIG. 9 Global Urea-SCR Selective Catalytic Reduction  Market, 2016-2026 (Units)
        FIG. 10 Global Selective Catalytic Reduction Market Share, by Application, 2018 & 2025 
        FIG. 11 Global Selective Catalytic Reduction Market share, by Application, 2018 & 2025 (Units)
        FIG. 12 Global Transportation Selective Catalytic Reduction Market, 2016-2026 
        FIG. 13 Global Transportation Selective Catalytic Reduction  Market, 2016-2026 (Units)
        FIG. 14 Global Power Industry Selective Catalytic Reduction Market, 2016-2026 
        FIG. 15 Global Power Industry Selective Catalytic Reduction  Market, 2016-2026 (Units)
        FIG. 16 Global Chemical Industry Selective Catalytic Reduction Market, 2016-2026 
        FIG. 17 Global Chemical Industry Selective Catalytic Reduction  Market, 2016-2026 (Units)
        FIG. 18 Global Steel Plant Selective Catalytic Reduction Market, 2016-2026 
        FIG. 19 Global Steel Plant Selective Catalytic Reduction  Market, 2016-2026 (Units)
        FIG. 20 Global Others Selective Catalytic Reduction Market, 2016-2026 
        FIG. 21 Global Others Selective Catalytic Reduction  Market, 2016-2026 (Units)
        FIG. 22 Global Selective Catalytic Reduction Market Share, by Region, 2018 & 2025
        FIG. 23 Global Selective Catalytic Reduction Market Share, by Region, 2018 & 2025
        FIG. 24 North America Selective Catalytic Reduction Market, 2016-2026
        FIG. 25 North America Selective Catalytic Reduction  Market, 2016-2026 (Units)
        FIG. 26 U.S. Selective Catalytic Reduction Market, 2016-2026
        FIG. 27 U.S. Selective Catalytic Reduction  Market, 2016-2026 (Units)
        FIG. 28 Canada Selective Catalytic Reduction Market, 2016-2026
        FIG. 29 Canada Selective Catalytic Reduction  Market, 2016-2026 (Units)
        FIG. 30 Europe Selective Catalytic Reduction Market, 2016-2026
        FIG. 31 Europe Selective Catalytic Reduction  Market, 2016-2026 (Units)
        FIG. 32 Germany Selective Catalytic Reduction Market, 2016-2026
        FIG. 33 Germany Selective Catalytic Reduction  Market, 2016-2026 (Units)
        FIG. 34 France Selective Catalytic Reduction Market, 2016-2026
        FIG. 35 France Selective Catalytic Reduction  Market, 2016-2026 (Units)
        FIG. 36 U.K. Selective Catalytic Reduction Market, 2016-2026
        FIG. 37 U.K. Selective Catalytic Reduction  Market, 2016-2026 (Units)
        FIG. 38 Italy Selective Catalytic Reduction Market, 2016-2026
        FIG. 39 Italy Selective Catalytic Reduction  Market, 2016-2026 (Units)
        FIG. 40 Spain Selective Catalytic Reduction Market, 2016-2026
        FIG. 41 Spain Selective Catalytic Reduction  Market, 2016-2026 (Units)
        FIG. 42 Rest of Europe Selective Catalytic Reduction Market, 2016-2026
        FIG. 43 Rest of Europe Selective Catalytic Reduction  Market, 2016-2026 (Units)
        FIG. 44 Asia Pacific Selective Catalytic Reduction Market, 2016-2026
        FIG. 45 Asia Pacific Selective Catalytic Reduction  Market, 2016-2026 (Units)
        FIG. 46 China Selective Catalytic Reduction Market, 2016-2026
        FIG. 47 China Selective Catalytic Reduction  Market, 2016-2026 (Units)
        FIG. 48 Japan Selective Catalytic Reduction Market, 2016-2026
        FIG. 49 Japan Selective Catalytic Reduction  Market, 2016-2026 (Units)
        FIG. 50 India Selective Catalytic Reduction Market, 2016-2026
        FIG. 51 India Selective Catalytic Reduction  Market, 2016-2026 (Units)
        FIG. 52 South  Korea Selective Catalytic Reduction Market, 2016-2026
        FIG. 53 South  Korea Selective Catalytic Reduction  Market, 2016-2026 (Units)
        FIG. 54 South-East Asia Selective Catalytic Reduction Market, 2016-2026
        FIG. 55 South-East Asia Selective Catalytic Reduction  Market, 2016-2026 (Units)
        FIG. 56 Rest of Asia Pacific Selective Catalytic Reduction Market, 2016-2026
        FIG. 57 Rest of Asia Pacific Selective Catalytic Reduction  Market, 2016-2026 (Units)
        FIG. 58 Latin America Selective Catalytic Reduction Market, 2016-2026
        FIG. 59 Latin America Selective Catalytic Reduction  Market, 2016-2026 (Units)
        FIG. 60 Brazil Selective Catalytic Reduction Market, 2016-2026
        FIG. 61 Brazil Selective Catalytic Reduction  Market, 2016-2026 (Units)
        FIG. 62 Mexico Selective Catalytic Reduction Market, 2016-2026
        FIG. 63 Mexico Selective Catalytic Reduction  Market, 2016-2026 (Units)
        FIG. 64 Rest of Latin America Selective Catalytic Reduction Market, 2016-2026
        FIG. 65 Rest of Latin America Selective Catalytic Reduction  Market, 2016-2026 (Units)
        FIG. 66 The Middle-East and Africa Selective Catalytic Reduction Market, 2016-2026
        FIG. 67 The Middle-East and Africa Selective Catalytic Reduction  Market, 2016-2026 (Units)
        FIG. 68 GCC Countries Selective Catalytic Reduction Market, 2016-2026
        FIG. 69 GCC Countries Selective Catalytic Reduction  Market, 2016-2026 (Units)
        FIG. 70 South Africa Selective Catalytic Reduction Market, 2016-2026
        FIG. 71 South Africa Selective Catalytic Reduction  Market, 2016-2026 (Units)
        FIG. 72 Rest of Middle-East Africa Selective Catalytic Reduction Market, 2016-2026
        FIG. 73 Rest of Middle-East Africa Selective Catalytic Reduction  Market, 2016-2026 (Units)
        FIG. 74 Global Selective Catalytic Reduction production and revenue, 2015-2025  (Units)
        FIG. 75 North America Selective Catalytic Reduction production and revenue, 2015-2025  (Units)
        FIG. 76 Europe Selective Catalytic Reduction production and revenue, 2015-2025  (Units)
        FIG. 77 Asia Pacific Selective Catalytic Reduction production and revenue, 2015-2025  (Units)
        FIG. 78 Latin America Selective Catalytic Reduction production and revenue, 2015-2025  (Units)
        FIG. 79 Middle East and Africa Selective Catalytic Reduction production and revenue, 2015-2025  (Units)
        FIG. 80 Competitor Market Share – Revenue
        FIG. 81 Competitor Market Share – Volume
        FIG. 82 Johnson Matthey Revenue and Growth Rate
        FIG. 83 Johnson Matthey Market Share
        FIG. 84 Hitachi Zosen Revenue and Growth Rate
        FIG. 85 Hitachi Zosen Market Share
        FIG. 86 Wartsila Revenue and Growth Rate
        FIG. 87 Wartsila Market Share
        FIG. 88 GEA Revenue and Growth Rate
        FIG. 89 GEA Market Share
        FIG. 90 Babcock & Wilcox Revenue and Growth Rate
        FIG. 91 Babcock & Wilcox Market Share
        FIG. 92 Dürr Revenue and Growth Rate
        FIG. 93 Dürr Market Share
        FIG. 94 Rochling Revenue and Growth Rate
        FIG. 95 Rochling Market Share
        FIG. 96 Scheuch GmbH Revenue and Growth Rate
        FIG. 97 Scheuch GmbH Market Share
        FIG. 98 Eminox Revenue and Growth Rate
        FIG. 99 Eminox Market Share
        FIG. 100 DCL International Revenue and Growth Rate
        FIG. 101 DCL International Market Share
        FIG. 102 Baumot Revenue and Growth Rate
        FIG. 103 Baumot Market Share
        FIG. 104 Babcock Power Environmental Revenue and Growth Rate
        FIG. 105 Babcock Power Environmental Market Share
        FIG. 106 VoSS Revenue and Growth Rate
        FIG. 107 VoSS Market Share
        FIG. 108 Market Dynamics
        FIG. 109 Global Selective Catalytic Reduction – Value Chain Analysis
        FIG. 110 Key Mandates and Regulations
        FIG. 111 Technology Roadmap and Timeline
        FIG. 112 Market Attractiveness Analysis – By Product
        FIG. 113 Market Attractiveness Analysis – By Application
        FIG. 114 Market Attractiveness Analysis – By Region
        FIG. 115 Manufacturing Cost Structure of Selective Catalytic Reduction
        FIG. 116 Selective Catalytic Reduction Industrial Chain Analysis
        FIG. 117 Market Channel
        FIG. 118 Marketing Channel Development Trend
        FIG. 119 Growth in World Gross Product, 2008-2018

        List of Tables

        TABLE 1 Global Selective Catalytic Reduction market, 2018 & 2025 
        TABLE 2 Global Selective Catalytic Reduction market, by Product, 2016-2026 
        TABLE 3 Global Selective Catalytic Reduction market, by Product, 2016-2026 (Units)
        TABLE 4 Global Selective Catalytic Reduction market, by Application, 2016-2026 
        TABLE 5 Global Selective Catalytic Reduction market, by Application, 2016-2026 (Units)
        TABLE 6 Global Selective Catalytic Reduction market, by region, 2016-2026 
        TABLE 7 Global Selective Catalytic Reduction market, by region, 2016-2026 (Units)
        TABLE 8 North America Selective Catalytic Reduction Market, by Product, 2016-2026 
        TABLE 9 North America Selective Catalytic Reduction Market, by Product, 2016-2026 (Units)
        TABLE 10 North America Selective Catalytic Reduction Market, by Application, 2016-2026 
        TABLE 11 North America Selective Catalytic Reduction Market, by Application, 2016-2026 (Units)
        TABLE 12 Europe Selective Catalytic Reduction Market, by Product, 2016-2026 
        TABLE 13 Europe Selective Catalytic Reduction Market, by Product, 2016-2026 (Units)
        TABLE 14 Europe Selective Catalytic Reduction Market, by Application, 2016-2026 
        TABLE 15 Europe Selective Catalytic Reduction Market, by Application, 2016-2026 (Units)
        TABLE 16 Asia Pacific Selective Catalytic Reduction Market, by Product, 2016-2026 
        TABLE 17 Asia Pacific Selective Catalytic Reduction Market, by Product, 2016-2026 (Units)
        TABLE 18 Asia Pacific Selective Catalytic Reduction Market, by Application, 2016-2026 
        TABLE 19 Asia Pacific Selective Catalytic Reduction Market, by Application, 2016-2026 (Units)
        TABLE 20 Latin America Selective Catalytic Reduction Market, by Product, 2016-2026 
        TABLE 21 Latin America Selective Catalytic Reduction Market, by Product, 2016-2026 (Units)
        TABLE 22 Latin America Selective Catalytic Reduction Market, by Application, 2016-2026 
        TABLE 23 Latin America Selective Catalytic Reduction Market, by Application, 2016-2026 (Units)
        TABLE 24 The Middle-East and Africa Selective Catalytic Reduction Market, by Product, 2016-2026 
        TABLE 25 The Middle-East and Africa Selective Catalytic Reduction Market, by Product, 2016-2026 (Units)
        TABLE 26 The Middle-East and Africa Selective Catalytic Reduction Market, by Application, 2016-2026 
        TABLE 27 The Middle-East and Africa Selective Catalytic Reduction Market, by Application, 2016-2026 (Units)
        TABLE 28 North America Selective Catalytic Reduction Production, Consumption, Export, Import, 2016-2019
        TABLE 29 Europe Selective Catalytic Reduction Production, Consumption, Export, Import, 2016-2019
        TABLE 30 Asia Pacific Selective Catalytic Reduction Production, Consumption, Export, Import, 2016-2019
        TABLE 31 Latin America Selective Catalytic Reduction Production, Consumption, Export, Import, 2016-2019
        TABLE 32 Middle East & Africa Selective Catalytic Reduction Production, Consumption, Export, Import, 2016-2019
        TABLE 33 Global Selective Catalytic Reduction Market - Company Revenue Analysis 2016-2019 
        TABLE 34 Global Selective Catalytic Reduction Market - Company Revenue Share Analysis 2016-2019
        TABLE 35 Global Selective Catalytic Reduction Market - Company Volume Analysis 2016-2019 (Units)
        TABLE 36 Global Selective Catalytic Reduction Market - Company Volume Share Analysis 2016-2019
        TABLE 37 Acquisitions and Mergers
        TABLE 38 New Product/Service Launch
        TABLE 39 Research & Development Activities
        TABLE 40 Market Drivers
        TABLE 41 Market Restraints
        TABLE 42 Market Opportunities
        TABLE 43 Production Base and Market Concentration Rate of Raw Material
        TABLE 44 Key Suppliers of Raw Materials
        TABLE 45 Raw Materials Sources of Selective Catalytic Reduction Major Manufacturers in 2016
        TABLE 46 Major Buyers of Selective Catalytic Reduction
        TABLE 47 Distributors/Traders of Selective Catalytic Reduction by Region
        

Industry Major Market Players

  •  Johnson Matthey
  •  Hitachi Zosen
  •  Wartsila
  •  GEA
  •  Babcock & Wilcox
  •  Dürr
  •  Rochling
  •  Scheuch GmbH
  •  Eminox
  •  DCL International
  •  Baumot
  •  Babcock Power Environmental
  •  VoSS