Search Market Research Report

Discover Our Latest Reports
Discover Our Featured Reports
Discover Top Selling Reports

Security Assurance Market Size, Share Global Analysis Report, 2020 – 2026

report img

Security Assurance Market By Application (Business Applications, System & Network Infrastructure, and Mobility Solutions) by Organization Size (Large Sized Enterprises and Small and Medium-Sized Enterprises) for Industry Verticals (BFSI, Telecommunications, Government, Healthcare, Retail, Manufacturing, and Others) -Global Industry Perspective, Comprehensive Analysis and Forecast 2020 – 2026

Industry Insights

The security assurance market report analyzes and notifies the industry statistics at the global as well as regional and country levels in order to acquire a thorough perspective of the entire security assurance market. The historical and past insights are provided for FY 2016 to FY 2019 whereas projected trends are delivered for FY 2020 to FY 2026. The quantitative and numerical data is represented in terms of value (USD Million) from FY 2016 – 2026.

This specialized and expertise-oriented industry research report scrutinizes the technical and commercial business outlook of the security assurance industry. The report analyzes and declares the historical and current trends analysis of the security assurance industry and subsequently recommends the projected trends anticipated to be observed in the security assurance market during the upcoming years.

Security Assurance Market Size

To know more about this report | Request Free Sample Copy


logoKey Insights from Primary Research

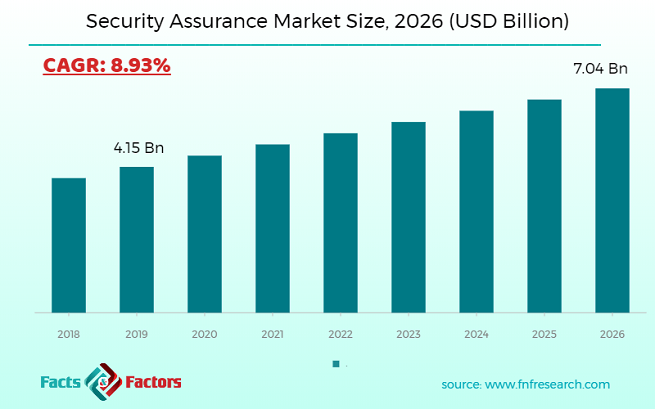
  • As per our primary analysis, the global security assurance market is  expected to reach around USD 7 billion in 2026
  • North America emerged as a leading regional market for global security assurance market in 2019 and accounted for over 49% of the revenue share. Most of the primary respondents told us that, growing cyber-attack, paired with the availability of various cloud-based security solutions will be key factors predicted to shape the growth of the North American security assurance market in coming years
  • BFSI accounted for the largest revenue share in the global security assurance market the last year.
  • According to our respondent, Europe is also expected to contribute significantly to the global security assurance market in the near future, owing to rising government and private enterprises' investments in data security. In addition, the new regulation which is the EU General Data Protection Regulation (GDPR) is expected to drive numerous enterprises to increase spending on information security.

logoKey Recommendations from Analysts

  • As per our analysts, the security assurance market revenue was around USD 28 billion in 2019.
  • The healthcare industry vertical is emerged as the fastest-growing security assurance market and is estimated to grow at a CAGR of 10.84% in the analysis period.
  • Based on industry verticals, the BFSI segment accounted for the largest revenue and contribute around 26% of revenue share in the global security assurance market
  • Our analysts believe that Asia Pacific is expected to be the fastest-growing region in the global security assurance market in the coming years, owing to the requirement to reduce IT security risks and the growing adoption of security assurance services among small and medium-sized enterprises in the region. The enterprises in Asia-Pacific have experienced being targeted by hackers as likened to other regions, due to unsuccessful cyber laws and lack of awareness. The rising digital transformation and the advent of IoT, are leading to current network infrastructure rising susceptible to cyber-attacks.
  • Microsoft, IBM, Oracle, Micro Focus, SAS, Infosys, and Accenture are among the major market participant in the global security assurance marketplace

The quantitative data is further underlined and reinforced by comprehensive qualitative data which comprises various across-the-board market dynamics. The rationales which directly or indirectly impact the security assurance industry are exemplified through parameters such as growth drivers, restraints, challenges, and opportunities among other impacting factors.

Throughout our research report, we have encompassed all the proven models and tools of industry analysis and extensively illustrated all the key business strategies and business models adopted in the security assurance industry. The report provides an all-inclusive and detailed competitive landscape prevalent in the security assurance market.

The report utilizes established industry analysis tools and models such as Porter’s Five Forces framework to analyze and recognize critical business strategies adopted by various stakeholders involved in the entire value chain of the security assurance industry. The security assurance market report additionally employs SWOT analysis and PESTLE analysis models for further in-depth analysis.

The report study further includes an in-depth analysis of industry players' market shares and provides an overview of leading players' market position in the security assurance sector. Key strategic developments in the Security Assurance market competitive landscape such as acquisitions & mergers, inaugurations of different products and services, partnerships & joint ventures, MoU agreements, VC & funding activities, R&D activities, and geographic expansion among other noteworthy activities by key players of the security assurance market are appropriately highlighted in the report.

North America has been particularly responsive to adopting advanced technologies, including cloud computing, artificial intelligence, and IoT. The growing adoption of security assurance solutions in large-sized enterprises in the region is expected to support North America to continue its dominance in the global security assurance market in the near future. In addition, avoidance of rising security breaches and threats is also expected to act as a driving strength for the growth of the market. The U.S. and Canada are the major contributing countries in this region. For instance, the adoption of advanced technologies by large-sized enterprises in Canada, including IoT devices, like connected networked sensors and baby monitors for municipal services. These technologies are adopted to protect confidential information or data. In addition, the presence of major IT players such as Microsoft, IBM, Oracle, SAP, and others in the U.S. also provides security assurance solutions to the various verticals in the region and also plays a supporting role in the growth of the market.

The security assurance market research report delivers an acute valuation and taxonomy of the security assurance industry by practically splitting the market on the basis of different detection, end-use, and regions. Through the analysis of the historical and projected trends, all the segments and sub-segments were evaluated through the bottom-up approach, and different market sizes have been projected for FY 2020 to FY 2026. The regional segmentation of the security assurance industry includes the complete classification of all the major continents including North America, Latin America, Europe, Asia Pacific, and the Middle East & Africa. Further, country-wise data for the security assurance industry is provided for the leading economies of the world.

The global security assurance market is segmented on the basis of application, organization size, industry verticals, and region. On the basis of application, the market is classified into mobility solutions, business applications, and systems and network infrastructure. The growth of the mobility solutions segment has been accelerated over the years. With the growing use and demand for mobile devices and connectivity, the networks are more vulnerable to cyber-attacks which are expected to further boost the growth of the mobility solutions segment in the coming period. By organization size, the global security assurance market is divided into large-sized enterprises and small and medium-sized enterprises. On the basis of industry verticals, the market is fragmented into BFSI, healthcare, government, manufacturing, retail, telecommunications, and others.

logoReport Scope

Report Attribute

Details

Market Size in 2019

USD 4.15 billion

Projected Market Size in 2026

USD 7.04 billion

CAGR Growth Rate

8.93% CAGR

Base Year

2019

Forecast Years

2020-2026

Key Market Players

Accenture, Signature Consulting Group, Avaya, Aura, BizCarta, IBM, Infosys, Micro Focus, Telos, Microsoft, OpenText, NETSCOUT, SAS, Sogeti, Cipher, CRITICAL Software, Content Security, Radix Security, Spirent, Happiest Minds, Oracle, Tenable, and Wipro among others.

Key Segment

By Application, By Organization Size, By Region

Major Regions Covered

North America, Europe, Asia Pacific, Latin America, and the Middle East & Africa

Purchase Options

Request customized purchase options to meet your research needs. Explore purchase options

The taxonomy of the security assurance industry by its scope and segmentation is as follows:

logoSome of the major players operating in the security assurance market include

  •  Accenture
  •  Signature Consulting Group
  •  Avaya
  •  Aura
  •  BizCarta
  •  IBM
  •  Infosys
  •  Micro Focus
  •  Telos
  •  Microsoft
  •  OpenText
  •  NETSCOUT
  •  SAS
  •  Sogeti
  •  Cipher
  •  CRITICAL Software
  •  Content Security
  •  Radix Security
  •  Spirent
  •  Happiest Minds
  •  Oracle
  •  Tenable
  •  Wipro

logo Application Segment Analysis

  • Business Applications
  • System & Network Infrastructure
  • Mobility Solutions

logo Organization Size Segment Analysis

  • Large Sized Enterprises
  • Small and Medium-Sized Enterprises

logo Industry Verticals Segment Analysis

  • BFSI
  • Telecommunications
  • Government
  • Healthcare
  • Retail
  • Manufacturing
  • Others

logo Regional Segmentation Analysis (Customizable)

  • North America
    • The U.S.
    • Canada
  • Europe
    • Germany
    • The UK
    • France
    • Spain
    • Italy
    • Rest of Europe
  • Asia Pacific
    • China
    • Japan
    • India
    • South Korea
    • Southeast Asia
    • Rest of Asia Pacific
  • Latin America
    • Brazil
    • Mexico
    • Rest of Latin America
  • Middle East & Africa
    • GCC
    • South Africa
    • Rest of the Middle East & Africa

Table of Content

  1. CHAPTER 1. Executive Summary
  2. CHAPTER 2. Security Assurance market – Application Analysis
    1. 2.1. Global Security Assurance Market – Application Overview
    2. 2.2. Global Security Assurance Market Share, by Application, 2019 & 2026 (USD Million)
    3. 2.3. Business Applications
      1. 2.3.1. Global Business Applications Security Assurance Market, 2016-2019 (USD Million)
    4. 2.4. System & Network Infrastructure
      1. 2.4.1. Global System & Network Infrastructure Security Assurance Market, 2016-2019 (USD Million)
    5. 2.5. Mobility Solutions
      1. 2.5.1. Global Mobility Solutions Security Assurance Market, 2016-2019 (USD Million)
  3. CHAPTER 3. Security Assurance market – Organization Size Analysis
    1. 3.1. Global Security Assurance Market – Organization Size Overview
    2. 3.2. Global Security Assurance Market Share, by Organization Size, 2019 & 2026 (USD Million)
    3. 3.3. Large Sized Enterprises
      1. 3.3.1. Global Large Sized Enterprises Security Assurance Market, 2016-2019 (USD Million)
    4. 3.4. Small and Medium-Sized Enterprises
      1. 3.4.1. Global Small and Medium-Sized Enterprises Security Assurance Market, 2016-2019 (USD Million)
  4. CHAPTER 4. Security Assurance market – Industry Verticals Analysis
    1. 4.1. Global Security Assurance Market – Industry Verticals Overview
    2. 4.2. Global Security Assurance Market Share, by Industry Verticals, 2019 & 2026 (USD Million)
    3. 4.3. BFSI
      1. 4.3.1. Global BFSI Security Assurance Market, 2016-2019 (USD Million)
    4. 4.4. Telecommunications
      1. 4.4.1. Global Telecommunications Security Assurance Market, 2016-2019 (USD Million)
    5. 4.5. Government
      1. 4.5.1. Global Government Security Assurance Market, 2016-2019 (USD Million)
    6. 4.6. Healthcare
      1. 4.6.1. Global Healthcare Security Assurance Market, 2016-2019 (USD Million)
    7. 4.7. Retail
      1. 4.7.1. Global Retail Security Assurance Market, 2016-2019 (USD Million)
    8. 4.8. Manufacturing
      1. 4.8.1. Global Manufacturing Security Assurance Market, 2016-2019 (USD Million)
    9. 4.9. Others
      1. 4.9.1. Global Others Security Assurance Market, 2016-2019 (USD Million)
  5. CHAPTER 5. Security Assurance market – Regional Analysis
    1. 5.1. Global Security Assurance Market Regional Overview
    2. 5.2. Global Security Assurance Market Share, by Region, 2019 & 2026 (Value)
    3. 5.3. North America
      1. 5.3.1. North America Security Assurance Market size and forecast, 2016-2019
      2. 5.3.2. North America Security Assurance Market, by Country, 2019 & 2026 (USD Million)
      3. 5.3.3. North America Security Assurance Market, by Application, 2016-2019
        1. 5.3.3.1. North America Security Assurance Market, by Application, 2016-2019 (USD Million)
      4. 5.3.4. North America Security Assurance Market, by Organization Size, 2016-2019
        1. 5.3.4.1. North America Security Assurance Market, by Organization Size, 2016-2019 (USD Million)
      5. 5.3.5. North America Security Assurance Market, by Industry Verticals, 2016-2019
        1. 5.3.5.1. North America Security Assurance Market, by Industry Verticals, 2016-2019 (USD Million)
      6. 5.3.6. U.S.
        1. 5.3.6.1. U.S. Market size and forecast, 2016-2019 (USD Million)
      7. 5.3.7. Canada
        1. 5.3.7.1. Canada Market size and forecast, 2016-2019 (USD Million)
    4. 5.4. Europe
      1. 5.4.1. Europe Security Assurance Market size and forecast, 2016-2019
      2. 5.4.2. Europe Security Assurance Market, by Country, 2019 & 2026 (USD Million)
      3. 5.4.3. Europe Security Assurance Market, by Application, 2016-2019
        1. 5.4.3.1. Europe Security Assurance Market, by Application, 2016-2019 (USD Million)
      4. 5.4.4. Europe Security Assurance Market, by Organization Size, 2016-2019
        1. 5.4.4.1. Europe Security Assurance Market, by Organization Size, 2016-2019 (USD Million)
      5. 5.4.5. Europe Security Assurance Market, by Industry Verticals, 2016-2019
        1. 5.4.5.1. Europe Security Assurance Market, by Industry Verticals, 2016-2019 (USD Million)
      6. 5.4.6. Germany
        1. 5.4.6.1. Germany Market size and forecast, 2016-2019 (USD Million)
      7. 5.4.7. France
        1. 5.4.7.1. France Market size and forecast, 2016-2019 (USD Million)
      8. 5.4.8. U.K.
        1. 5.4.8.1. U.K. Market size and forecast, 2016-2019 (USD Million)
      9. 5.4.9. Italy
        1. 5.4.9.1. Italy Market size and forecast, 2016-2019 (USD Million)
      10. 5.4.10. Spain
        1. 5.4.10.1. Spain Market size and forecast, 2016-2019 (USD Million)
      11. 5.4.11. Rest of Europe
        1. 5.4.11.1. Rest of Europe Market size and forecast, 2016-2019 (USD Million)
    5. 5.5. Asia Pacific
      1. 5.5.1. Asia Pacific Security Assurance Market size and forecast, 2016-2019
      2. 5.5.2. Asia Pacific Security Assurance Market, by Country, 2019 & 2026 (USD Million)
      3. 5.5.3. Asia Pacific Security Assurance Market, by Application, 2016-2019
        1. 5.5.3.1. Asia Pacific Security Assurance Market, by Application, 2016-2019 (USD Million)
      4. 5.5.4. Asia Pacific Security Assurance Market, by Organization Size, 2016-2019
        1. 5.5.4.1. Asia Pacific Security Assurance Market, by Organization Size, 2016-2019 (USD Million)
      5. 5.5.5. Asia Pacific Security Assurance Market, by Industry Verticals, 2016-2019
        1. 5.5.5.1. Asia Pacific Security Assurance Market, by Industry Verticals, 2016-2019 (USD Million)
      6. 5.5.6. China
        1. 5.5.6.1. China Market size and forecast, 2016-2019 (USD Million)
      7. 5.5.7. Japan
        1. 5.5.7.1. Japan Market size and forecast, 2016-2019 (USD Million)
      8. 5.5.8. India
        1. 5.5.8.1. India Market size and forecast, 2016-2019 (USD Million)
      9. 5.5.9. South Korea
        1. 5.5.9.1. South Korea Market size and forecast, 2016-2019 (USD Million)
      10. 5.5.10. South-East Asia
        1. 5.5.10.1. South-East Asia Market size and forecast, 2016-2019 (USD Million)
      11. 5.5.11. Rest of Asia Pacific
        1. 5.5.11.1. Rest of Asia Pacific Market size and forecast, 2016-2019 (USD Million)
    6. 5.6. Latin America
      1. 5.6.1. Latin America Security Assurance Market size and forecast, 2016-2019
      2. 5.6.2. Latin America Security Assurance Market, by Country, 2019 & 2026 (USD Million)
      3. 5.6.3. Latin America Security Assurance Market, by Application, 2016-2019
        1. 5.6.3.1. Latin America Security Assurance Market, by Application, 2016-2019 (USD Million)
      4. 5.6.4. Latin America Security Assurance Market, by Organization Size, 2016-2019
        1. 5.6.4.1. Latin America Security Assurance Market, by Organization Size, 2016-2019 (USD Million)
      5. 5.6.5. Latin America Security Assurance Market, by Industry Verticals, 2016-2019
        1. 5.6.5.1. Latin America Security Assurance Market, by Industry Verticals, 2016-2019 (USD Million)
      6. 5.6.6. Brazil
        1. 5.6.6.1. Brazil Market size and forecast, 2016-2019 (USD Million)
      7. 5.6.7. Mexico
        1. 5.6.7.1. Mexico Market size and forecast, 2016-2019 (USD Million)
      8. 5.6.8. Rest of Latin America
        1. 5.6.8.1. Rest of Latin America Market size and forecast, 2016-2019 (USD Million)
    7. 5.7. The Middle-East and Africa
      1. 5.7.1. The Middle-East and Africa Security Assurance Market size and forecast, 2016-2019
      2. 5.7.2. The Middle-East and Africa Security Assurance Market, by Country, 2019 & 2026 (USD Million)
      3. 5.7.3. The Middle-East and Africa Security Assurance Market, by Application, 2016-2019
        1. 5.7.3.1. The Middle-East and Africa Security Assurance Market, by Application, 2016-2019 (USD Million)
      4. 5.7.4. The Middle-East and Africa Security Assurance Market, by Organization Size, 2016-2019
        1. 5.7.4.1. The Middle-East and Africa Security Assurance Market, by Organization Size, 2016-2019 (USD Million)
      5. 5.7.5. The Middle-East and Africa Security Assurance Market, by Industry Verticals, 2016-2019
        1. 5.7.5.1. The Middle-East and Africa Security Assurance Market, by Industry Verticals, 2016-2019 (USD Million)
      6. 5.7.6. GCC Countries
        1. 5.7.6.1. GCC Countries Market size and forecast, 2016-2019 (USD Million)
      7. 5.7.7. South Africa
        1. 5.7.7.1. South Africa Market size and forecast, 2016-2019 (USD Million)
      8. 5.7.8. Rest of Middle-East Africa
        1. 5.7.8.1. Rest of Middle-East Africa Market size and forecast, 2016-2019 (USD Million)
  6. CHAPTER 6. Security Assurance market – Competitive Landscape
    1. 6.1. Competitor Market Share – Revenue
    2. 6.2. Market Concentration Rate Analysis, Top 3 and Top 5 Players
    3. 6.3. Strategic Development
      1. 6.3.1. Acquisitions and Mergers
      2. 6.3.2. New Products
      3. 6.3.3. Research & Development Activities
  7. CHAPTER 7. Company Profiles
    1. 7.1. Accenture
      1. 7.1.1. Company Overview
      2. 7.1.2. Accenture Revenue and Gross Margin
      3. 7.1.3. Product portfolio
      4. 7.1.4. Recent initiatives
    2. 7.2. Signature Consulting Group
      1. 7.2.1. Company Overview
      2. 7.2.2. Signature Consulting Group Revenue and Gross Margin
      3. 7.2.3. Product portfolio
      4. 7.2.4. Recent initiatives
    3. 7.3. Avaya
      1. 7.3.1. Company Overview
      2. 7.3.2. Avaya Revenue and Gross Margin
      3. 7.3.3. Product portfolio
      4. 7.3.4. Recent initiatives
    4. 7.4. Aura
      1. 7.4.1. Company Overview
      2. 7.4.2. Aura Revenue and Gross Margin
      3. 7.4.3. Product portfolio
      4. 7.4.4. Recent initiatives
    5. 7.5. BizCarta
      1. 7.5.1. Company Overview
      2. 7.5.2. BizCarta Revenue and Gross Margin
      3. 7.5.3. Product portfolio
      4. 7.5.4. Recent initiatives
    6. 7.6. IBM
      1. 7.6.1. Company Overview
      2. 7.6.2. IBM Revenue and Gross Margin
      3. 7.6.3. Product portfolio
      4. 7.6.4. Recent initiatives
    7. 7.7. Infosys
      1. 7.7.1. Company Overview
      2. 7.7.2. Infosys Revenue and Gross Margin
      3. 7.7.3. Product portfolio
      4. 7.7.4. Recent initiatives
    8. 7.8. Micro Focus
      1. 7.8.1. Company Overview
      2. 7.8.2. Micro Focus Revenue and Gross Margin
      3. 7.8.3. Product portfolio
      4. 7.8.4. Recent initiatives
    9. 7.9. Telos
      1. 7.9.1. Company Overview
      2. 7.9.2. Telos Revenue and Gross Margin
      3. 7.9.3. Product portfolio
      4. 7.9.4. Recent initiatives
    10. 7.10. Microsoft
      1. 7.10.1. Company Overview
      2. 7.10.2. Microsoft Revenue and Gross Margin
      3. 7.10.3. Product portfolio
      4. 7.10.4. Recent initiatives
    11. 7.11. OpenText
      1. 7.11.1. Company Overview
      2. 7.11.2. OpenText Revenue and Gross Margin
      3. 7.11.3. Product portfolio
      4. 7.11.4. Recent initiatives
    12. 7.12. NETSCOUT
      1. 7.12.1. Company Overview
      2. 7.12.2. NETSCOUT Revenue and Gross Margin
      3. 7.12.3. Product portfolio
      4. 7.12.4. Recent initiatives
    13. 7.13. SAS
      1. 7.13.1. Company Overview
      2. 7.13.2. SAS Revenue and Gross Margin
      3. 7.13.3. Product portfolio
      4. 7.13.4. Recent initiatives
    14. 7.14. Sogeti
      1. 7.14.1. Company Overview
      2. 7.14.2. Sogeti Revenue and Gross Margin
      3. 7.14.3. Product portfolio
      4. 7.14.4. Recent initiatives
    15. 7.15. Cipher
      1. 7.15.1. Company Overview
      2. 7.15.2. Cipher Revenue and Gross Margin
      3. 7.15.3. Product portfolio
      4. 7.15.4. Recent initiatives
    16. 7.16. CRITICAL Software
      1. 7.16.1. Company Overview
      2. 7.16.2. CRITICAL Software Revenue and Gross Margin
      3. 7.16.3. Product portfolio
      4. 7.16.4. Recent initiatives
    17. 7.17. Content Security
      1. 7.17.1. Company Overview
      2. 7.17.2. Content Security Revenue and Gross Margin
      3. 7.17.3. Product portfolio
      4. 7.17.4. Recent initiatives
    18. 7.18. Radix Security
      1. 7.18.1. Company Overview
      2. 7.18.2. Radix Security Revenue and Gross Margin
      3. 7.18.3. Product portfolio
      4. 7.18.4. Recent initiatives
    19. 7.19. Spirent
      1. 7.19.1. Company Overview
      2. 7.19.2. Spirent Revenue and Gross Margin
      3. 7.19.3. Product portfolio
      4. 7.19.4. Recent initiatives
    20. 7.20. Happiest Minds
      1. 7.20.1. Company Overview
      2. 7.20.2. Happiest Minds Revenue and Gross Margin
      3. 7.20.3. Product portfolio
      4. 7.20.4. Recent initiatives
    21. 7.21. Oracle
      1. 7.21.1. Company Overview
      2. 7.21.2. Oracle Revenue and Gross Margin
      3. 7.21.3. Product portfolio
      4. 7.21.4. Recent initiatives
    22. 7.22. Tenable
      1. 7.22.1. Company Overview
      2. 7.22.2. Tenable Revenue and Gross Margin
      3. 7.22.3. Product portfolio
      4. 7.22.4. Recent initiatives
    23. 7.23. Wipro
      1. 7.23.1. Company Overview
      2. 7.23.2. Wipro Revenue and Gross Margin
      3. 7.23.3. Product portfolio
      4. 7.23.4. Recent initiatives
  8. CHAPTER 8. Security Assurance — Industry Analysis
    1. 8.1. Security Assurance Market – Key Trends
      1. 8.1.1. Market Drivers
      2. 8.1.2. Market Restraints
      3. 8.1.3. Market Opportunities
    2. 8.2. Value Chain Analysis
    3. 8.3. Technology Roadmap and Timeline
    4. 8.4. Security Assurance Market – Attractiveness Analysis
      1. 8.4.1. By Application
      2. 8.4.2. By Organization Size
      3. 8.4.3. By Industry Verticals
      4. 8.4.4. By Region
  9. CHAPTER 9. Marketing Strategy Analysis, Distributors
    1. 9.1. Marketing Channel
    2. 9.2. Direct Marketing
    3. 9.3. Indirect Marketing
    4. 9.4. Marketing Channel Development Trend
    5. 9.5. Economic/Political Environmental Change
  10. CHAPTER 10. Report Conclusion
  11. CHAPTER 11. Research Approach & Methodology
    1. 11.1. Report Description
    2. 11.2. Research Scope
    3. 11.3. Research Methodology
      1. 11.3.1. Secondary Research
      2. 11.3.2. Primary Research
      3. 11.3.3. Models
        1. 11.3.3.1. Company Share Analysis Model
        2. 11.3.3.2. Revenue Based Modeling
        3. 11.3.3.3. Research Limitations

        List of Figures

        FIG. 1 Global Security Assurance Market, 2016-2019 (USD Million)
        FIG. 2 Global Security Assurance Market Share, by Application, 2019 & 2026 (USD Million)
        FIG. 3 Global Business Applications Security Assurance Market, 2016-2019 (USD Million)
        FIG. 4 Global System & Network Infrastructure Security Assurance Market, 2016-2019 (USD Million)
        FIG. 5 Global Mobility Solutions Security Assurance Market, 2016-2019 (USD Million)
        FIG. 6 Global Security Assurance Market Share, by Organization Size, 2019 & 2026 (USD Million)
        FIG. 7 Global Large Sized Enterprises Security Assurance Market, 2016-2019 (USD Million)
        FIG. 8 Global Small and Medium-Sized Enterprises Security Assurance Market, 2016-2019 (USD Million)
        FIG. 9 Global Security Assurance Market Share, by Industry Verticals, 2019 & 2026 (USD Million)
        FIG. 10 Global BFSI Security Assurance Market, 2016-2019 (USD Million)
        FIG. 11 Global Telecommunications Security Assurance Market, 2016-2019 (USD Million)
        FIG. 12 Global Government Security Assurance Market, 2016-2019 (USD Million)
        FIG. 13 Global Healthcare Security Assurance Market, 2016-2019 (USD Million)
        FIG. 14 Global Retail Security Assurance Market, 2016-2019 (USD Million)
        FIG. 15 Global Manufacturing Security Assurance Market, 2016-2019 (USD Million)
        FIG. 16 Global Others Security Assurance Market, 2016-2019 (USD Million)
        FIG. 17 Global Security Assurance Market Share, by Region, 2019 & 2026
        FIG. 18 North America Security Assurance Market, 2016-2019
        FIG. 19 U.S. Security Assurance Market, 2016-2019
        FIG. 20 Canada Security Assurance Market, 2016-2019
        FIG. 21 Europe Security Assurance Market, 2016-2019
        FIG. 22 Germany Security Assurance Market, 2016-2019
        FIG. 23 France Security Assurance Market, 2016-2019
        FIG. 24 U.K. Security Assurance Market, 2016-2019
        FIG. 25 Italy Security Assurance Market, 2016-2019
        FIG. 26 Spain Security Assurance Market, 2016-2019
        FIG. 27 Rest of Europe Security Assurance Market, 2016-2019
        FIG. 28 Asia Pacific Security Assurance Market, 2016-2019
        FIG. 29 China Security Assurance Market, 2016-2019
        FIG. 30 Japan Security Assurance Market, 2016-2019
        FIG. 31 India Security Assurance Market, 2016-2019
        FIG. 32 South  Korea Security Assurance Market, 2016-2019
        FIG. 33 South-East Asia Security Assurance Market, 2016-2019
        FIG. 34 Rest of Asia Pacific Security Assurance Market, 2016-2019
        FIG. 35 Latin America Security Assurance Market, 2016-2019
        FIG. 36 Brazil Security Assurance Market, 2016-2019
        FIG. 37 Mexico Security Assurance Market, 2016-2019
        FIG. 38 Rest of Latin America Security Assurance Market, 2016-2019
        FIG. 39 The Middle-East and Africa Security Assurance Market, 2016-2019
        FIG. 40 GCC Countries Security Assurance Market, 2016-2019
        FIG. 41 South Africa Security Assurance Market, 2016-2019
        FIG. 42 Rest of Middle-East Africa Security Assurance Market, 2016-2019
        FIG. 43 Competitor Market Share – Revenue
        FIG. 44 Accenture Revenue and Growth Rate
        FIG. 45 Accenture Market Share
        FIG. 46 Signature Consulting Group Revenue and Growth Rate
        FIG. 47 Signature Consulting Group Market Share
        FIG. 48 Avaya Revenue and Growth Rate
        FIG. 49 Avaya Market Share
        FIG. 50 Aura Revenue and Growth Rate
        FIG. 51 Aura Market Share
        FIG. 52 BizCarta Revenue and Growth Rate
        FIG. 53 BizCarta Market Share
        FIG. 54 IBM Revenue and Growth Rate
        FIG. 55 IBM Market Share
        FIG. 56 Infosys Revenue and Growth Rate
        FIG. 57 Infosys Market Share
        FIG. 58 Micro Focus Revenue and Growth Rate
        FIG. 59 Micro Focus Market Share
        FIG. 60 Telos Revenue and Growth Rate
        FIG. 61 Telos Market Share
        FIG. 62 Microsoft Revenue and Growth Rate
        FIG. 63 Microsoft Market Share
        FIG. 64 OpenText Revenue and Growth Rate
        FIG. 65 OpenText Market Share
        FIG. 66 NETSCOUT Revenue and Growth Rate
        FIG. 67 NETSCOUT Market Share
        FIG. 68 SAS Revenue and Growth Rate
        FIG. 69 SAS Market Share
        FIG. 70 Sogeti Revenue and Growth Rate
        FIG. 71 Sogeti Market Share
        FIG. 72 Cipher Revenue and Growth Rate
        FIG. 73 Cipher Market Share
        FIG. 74 CRITICAL Software Revenue and Growth Rate
        FIG. 75 CRITICAL Software Market Share
        FIG. 76 Content Security Revenue and Growth Rate
        FIG. 77 Content Security Market Share
        FIG. 78 Radix Security Revenue and Growth Rate
        FIG. 79 Radix Security Market Share
        FIG. 80 Spirent Revenue and Growth Rate
        FIG. 81 Spirent Market Share
        FIG. 82 Happiest Minds Revenue and Growth Rate
        FIG. 83 Happiest Minds Market Share
        FIG. 84 Oracle Revenue and Growth Rate
        FIG. 85 Oracle Market Share
        FIG. 86 Tenable Revenue and Growth Rate
        FIG. 87 Tenable Market Share
        FIG. 88 Wipro Revenue and Growth Rate
        FIG. 89 Wipro Market Share
        FIG. 90 Market Dynamics
        FIG. 91 Global Security Assurance – Value Chain Analysis
        FIG. 92 Technology Roadmap and Timeline
        FIG. 93 Market Attractiveness Analysis – By Application
        FIG. 94 Market Attractiveness Analysis – By Organization Size
        FIG. 95 Market Attractiveness Analysis – By Industry Verticals
        FIG. 96 Market Attractiveness Analysis – By Region
        FIG. 97 Market Channel
        FIG. 98 Marketing Channel Development Trend
        FIG. 99 Growth in World Gross Product, 2008-2018
        

        List of Tables

        TABLE 1 Global Security Assurance Market, 2019 & 2026 (USD Million)
        TABLE 2 Global Security Assurance market, by Application, 2016-2019 (USD Million)
        TABLE 3 Global Security Assurance market, by Organization Size, 2016-2019 (USD Million)
        TABLE 4 Global Security Assurance market, by Industry Verticals, 2016-2019 (USD Million)
        TABLE 5 Global Security Assurance market, by Region, 2016-2019 (USD Million)
        TABLE 6 North America Security Assurance Market, by Application, 2016-2019 (USD Million)
        TABLE 7 North America Security Assurance Market, by Organization Size, 2016-2019 (USD Million)
        TABLE 8 North America Security Assurance Market, by Industry Verticals, 2016-2019 (USD Million)
        TABLE 9 Europe Security Assurance Market, by Application, 2016-2019 (USD Million)
        TABLE 10 Europe Security Assurance Market, by Organization Size, 2016-2019 (USD Million)
        TABLE 11 Europe Security Assurance Market, by Industry Verticals, 2016-2019 (USD Million)
        TABLE 12 Asia Pacific Security Assurance Market, by Application, 2016-2019 (USD Million)
        TABLE 13 Asia Pacific Security Assurance Market, by Organization Size, 2016-2019 (USD Million)
        TABLE 14 Asia Pacific Security Assurance Market, by Industry Verticals, 2016-2019 (USD Million)
        TABLE 15 Latin America Security Assurance Market, by Application, 2016-2019 (USD Million)
        TABLE 16 Latin America Security Assurance Market, by Organization Size, 2016-2019 (USD Million)
        TABLE 17 Latin America Security Assurance Market, by Industry Verticals, 2016-2019 (USD Million)
        TABLE 18 The Middle-East and Africa Security Assurance Market, by Application, 2016-2019 (USD Million)
        TABLE 19 The Middle-East and Africa Security Assurance Market, by Organization Size, 2016-2019 (USD Million)
        TABLE 20 The Middle-East and Africa Security Assurance Market, by Industry Verticals, 2016-2019 (USD Million)
        TABLE 21 Global Security Assurance Market - Company Revenue Analysis 2015-2025 (USD Million)
        TABLE 22 Global Security Assurance Market - Company Revenue Share Analysis 2015-2025(%)
        TABLE 23 Acquisitions and Mergers
        TABLE 24 New Product/Service Launch
        TABLE 25 Research & Development Activities
        TABLE 26 Market Drivers
        TABLE 27 Market Restraints
        TABLE 28 Market Opportunities
        

Industry Major Market Players

  •  Accenture
  •  Signature Consulting Group
  •  Avaya
  •  Aura
  •  BizCarta
  •  IBM
  •  Infosys
  •  Micro Focus
  •  Telos
  •  Microsoft
  •  OpenText
  •  NETSCOUT
  •  SAS
  •  Sogeti
  •  Cipher
  •  CRITICAL Software
  •  Content Security
  •  Radix Security
  •  Spirent
  •  Happiest Minds
  •  Oracle
  •  Tenable
  •  Wipro