Search Market Research Report

Discover Our Latest Reports
Discover Our Featured Reports
Discover Top Selling Reports

Sacha Inchi Market Size, Share Global Analysis Report, 2019 - 2026

report img

Sacha Inchi Market By Form (Powder Sacha Inchi and Liquid Sacha Inchi), By Application (Pharmaceuticals, Cosmetics, Food and beverages, Dietary supplement) and By Distribution Channel (Direct Sale and Distributor): Global Industry Perspective, Comprehensive Analysis, and Forecast 2019 - 2026

Industry Insights

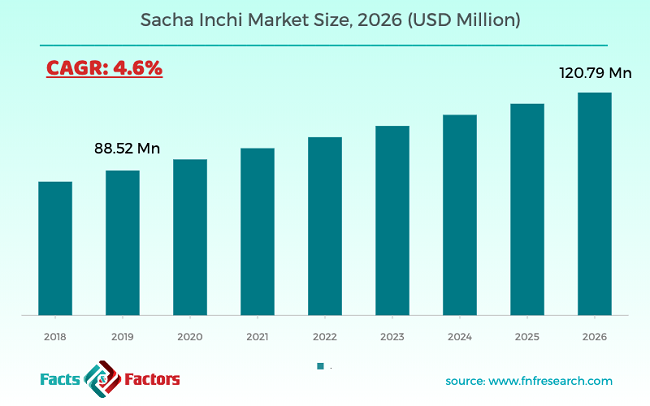
[110+ Pages Report] According to the report published by Facts Factors, the global sacha inchi market size was worth around USD 88.52 million in 2019 and is predicted to grow to aroundUSD 120.79 million by 2026 with a compound annual growth rate (CAGR) of roughly 4.6% between 2020 and 2026. The report analyzes the global sacha inchi market drivers, restraints/challenges, and the effect they have on the demands during the projection period. In addition, the report explores emerging opportunities in the sacha inchi market.

Sacha Inchi Market

To know more about this report | Request Free Sample Copy

The report encompasses the forecast as well as analysis of the Sacha Inchi market on the global and regional level. The study displays historical data of 2016 to 2019 along with a forecast from 2019 to 2026 based on revenue (USD Million). Additionally, the market growth drivers, opportunities, limitations, and trends are also included in the Sacha Inchi market report.  

We have included industry analysis models in our report and extensively demonstrated the key business strategies and competitive landscape of the Sacha Inchi market in our study.

Our study also includes an analysis of Porter’s Five Forces framework for understanding the competitive strategies used by market competitors. It also encompasses PESTLE analysis and SWOT analysis.


logoKey Insights from Primary Research

  • As per our primary respondents, the Sacha Inchi market is set to grow annually at a rate of around 4%
  • It was established through primary research that the Sacha Inchi market was valued at around USD 88.52 Million in 2019
  • In terms of volume, the Sacha Inchi market stood at around 60 million square meters, in 2019
  • Based on Form segmentation, the “Powder” category accounting for around 54% share, in 2019
  • Based on Application segmentation, the “Pharmaceuticals” category held the leading share at more than 40%, in 2019
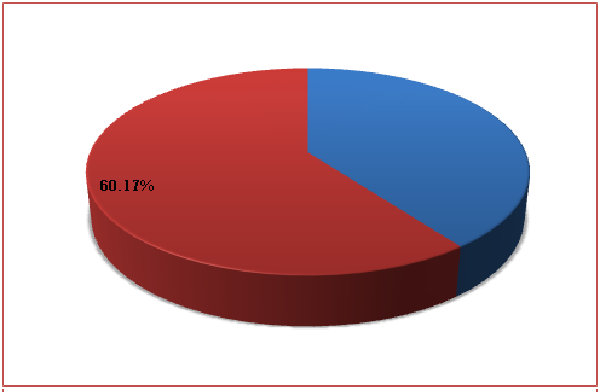
  • Based on Distribution Channel segmentation, the “Direct Sales” category accounting for around 60 % share, in 2019

logoKey Recommendations from Analysts

  • As per our analysis, the Asia Pacific market is estimated to grow at a CAGR of 5% during 2019-2026
  • The technology advancement in manufacturing and processing is anticipated as a key market driver in the region
  • China Growing at a CAGR around 6%, the sacha inchi market provides numerous opportunities for all of the involved stakeholders across the entire value chain.
  • One of the major demand-side factors affecting the sacha inchi market includes high customer leaning towards plant-based or vegan products.
  • Moreover, sacha inchi has numerous health benefits such as Staphylococcus aureus adherence inhibition, increased HDL, and reduced cholesterol is also bolstering the product demand across many sectors

logoGlobal Sacha Inchi Market Share – By Distribution Channel

Sacha Inchi Market

To know more about this report | Request Free Sample Copy


The report also offers an in-depth analysis of the market share of each industry player and gives outline of the market position of key players in the Sacha Inchi market. Moreover, the study offers wide coverage of key strategic improvements witnessed in the market such as acquisitions & mergers, new product launches, agreements, partnerships, collaborations & joint ventures, R&D activities, and geographical expansion of key players of the Sacha Inchi market.

The study provides a decisive view of the Sacha Inchi market by segmenting the Sacha Inchi market based on Type, Application, and regions. All the segments have been analyzed based on present and future trends and the market is estimated from 2019 to 2025.

logoReport Scope

Report Attribute

Details

Market Size in 2019

USD 88.52 Million

Projected Market Size in 2026

USD 120.79 Million

CAGR Growth Rate

4.6% CAGR

Base Year

2019

Forecast Years

2020-2026

Key Market Players

Imlakesh Organics, MaiSavanhLao, Natures Power Nutraceuticals Corp, Flora Health, and Herbs America., and Others

Key Segment

By Type, Application, Distribution, and Region

Major Regions Covered

North America, Europe, Asia Pacific, Latin America, and the Middle East & Africa

Purchase Options

Request customized purchase options to meet your research needs.Explore purchase options

The regional segmentation includes the current and forecast demand for North America, Europe, Asia Pacific, Latin America, and the Middle East and Africa.

The purchasing pattern of the consumers worldwide is based on the evolving fashion trends and changing hairstyles. The market share is largely influenced by the product sales greatly impacted by religious beliefs and ethnic populations. Ornamented pins, easy access to clips, and bands on the e-commerce web portal will further accelerate the industry surge over the forecast timespan.

The Sacha Inchi market is segmented based on Form, application and distribution channel. Form-wise, the market is classified into powder sacha inchi and liquid sacha inchi. In terms of application, the market segment is sectored into pharmaceuticals, cosmetics, food and beverages, dietary supplements. Distribution Channel -wise, the market is classified into direct sales and distributor.

logoSome of the leading players in the global market include

  • Imlakesh Organics
  • MaiSavanhLao
  • Natures Power Nutraceuticals Corp
  • Flora Health
  • Herbs America.

This report segments the Sacha Inchi market as follows:

logoBy Form Segment Analysis

  • Powder Sacha Inchi
  • Liquid Sacha Inchi

logoBy Application Segment Analysis

  • Pharmaceuticals
  • Cosmetics
  • Food and beverages
  • Dietary supplement

logoBy Distribution Channel Segment Analysis

  • Direct Sale
  • Distributor

logoBy Regional Segment Analysis

  • North America
    • U.S.
    • Canada
  • Europe
    • Germany
    • France
    • UK
    • Italy
    • Spain
    • Rest of Europe
  • Asia Pacific
    • China
    • Japan
    • India
    • South Korea
    • South-East Asia
    • Rest of Asia Pacific
  • Latin America
    • Brazil
    • Mexico
    • Rest of Latin America
  • The Middle-East and Africa
    • GCC Countries
    • South Africa
    • Rest of Middle-East Africa

logoKey Pointers Addressed by the Report

  • Historical data and forecast analysis of the market
  • Drivers and Restraints affecting market dynamics
  • Exhaustive analysis about the future market trends
  • Comprehensive information about the leading market segments and region
  • Strategic developments made by the competitive players and in-depth analysis about its impact on market growth

Table of Content

  1. CHAPTER 1. Executive Summary
  2. CHAPTER 2. Sacha Inchi market – Form Analysis
    1. 2.1. Global Sacha Inchi Market – Form Overview
    2. 2.2. Global Sacha Inchi Market Share, by Form, 2016 & 2026 (USD Million)
    3. 2.3. Global Sacha Inchi Market share, by Form, 2016 & 2026 (Tones)
    4. 2.4. Powder Sacha Inchi
      1. 2.4.1. Global Powder Sacha Inchi Sacha Inchi Market, 2016-2026 (USD Million)
      2. 2.4.2. Global Powder Sacha Inchi Sacha Inchi Market, 2016-2026 (Tones)
    5. 2.5. Liquid Sacha Inchi
      1. 2.5.1. Global Liquid Sacha Inchi Sacha Inchi Market, 2016-2026 (USD Million)
      2. 2.5.2. Global Liquid Sacha Inchi Sacha Inchi Market, 2016-2026 (Tones)
  3. CHAPTER 3. Sacha Inchi market – Application Analysis
    1. 3.1. Global Sacha Inchi Market – Application Overview
    2. 3.2. Global Sacha Inchi Market Share, by Application, 2016 & 2026 (USD Million)
    3. 3.3. Global Sacha Inchi Market share, by Application, 2016 & 2026 (Tones)
    4. 3.4. Pharmaceuticals
      1. 3.4.1. Global Pharmaceuticals Sacha Inchi Market, 2016-2026 (USD Million)
      2. 3.4.2. Global Pharmaceuticals Sacha Inchi Market, 2016-2026 (Tones)
    5. 3.5. Cosmetics
      1. 3.5.1. Global Cosmetics Sacha Inchi Market, 2016-2026 (USD Million)
      2. 3.5.2. Global Cosmetics Sacha Inchi Market, 2016-2026 (Tones)
    6. 3.6. Food and beverages
      1. 3.6.1. Global Food and beverages Sacha Inchi Market, 2016-2026 (USD Million)
      2. 3.6.2. Global Food and beverages Sacha Inchi Market, 2016-2026 (Tones)
    7. 3.7. Dietary supplement
      1. 3.7.1. Global Dietary supplement Sacha Inchi Market, 2016-2026 (USD Million)
      2. 3.7.2. Global Dietary supplement Sacha Inchi Market, 2016-2026 (Tones)
  4. CHAPTER 4. Sacha Inchi market – Distribution Channel Analysis
    1. 4.1. Global Sacha Inchi Market – Distribution Channel Overview
    2. 4.2. Global Sacha Inchi Market Share, by Distribution Channel, 2016 & 2026 (USD Million)
    3. 4.3. Global Sacha Inchi Market share, by Distribution Channel, 2016 & 2026 (Tones)
    4. 4.4. Direct Sale
      1. 4.4.1. Global Direct Sale Sacha Inchi Market, 2016-2026 (USD Million)
      2. 4.4.2. Global Direct Sale Sacha Inchi Market, 2016-2026 (Tones)
    5. 4.5. Distributor
      1. 4.5.1. Global Distributor Sacha Inchi Market, 2016-2026 (USD Million)
      2. 4.5.2. Global Distributor Sacha Inchi Market, 2016-2026 (Tones)
  5. CHAPTER 5. Sacha Inchi market – Regional Analysis
    1. 5.1. Global Sacha Inchi Market Regional Overview
    2. 5.2. Global Sacha Inchi Market Share, by Region, 2016 & 2026 (Value)
    3. 5.3. Global Sacha Inchi Market Share, by Region, 2016 & 2026 (Volume)
    4. 5.4. North America
      1. 5.4.1. North America Sacha Inchi Market size and forecast, 2016-2026
      2. 5.4.2. North America Sacha Inchi Market, by Country, 2018 - 2025 (USD Million)
      3. 5.4.3. North America Market size and forecast, 2016-2026 (Tones)
      4. 5.4.4. North America Sacha Inchi Market, by Country, 2018 - 2025 (Tones)
      5. 5.4.5. North America Sacha Inchi Market, by Form, 2016-2026
        1. 5.4.5.1. North America Sacha Inchi Market, by Form, 2016-2026 (USD Million)
        2. 5.4.5.2. North America Sacha Inchi Market, by Form, 2016-2026 (Tones)
      6. 5.4.6. North America Sacha Inchi Market, by Application, 2016-2026
        1. 5.4.6.1. North America Sacha Inchi Market, by Application, 2016-2026 (USD Million)
        2. 5.4.6.2. North America Sacha Inchi Market, by Application, 2016-2026 (Tones)
      7. 5.4.7. North America Sacha Inchi Market, by Distribution Channel, 2016-2026
        1. 5.4.7.1. North America Sacha Inchi Market, by Distribution Channel, 2016-2026 (USD Million)
        2. 5.4.7.2. North America Sacha Inchi Market, by Distribution Channel, 2016-2026 (Tones)
      8. 5.4.8. U.S.
        1. 5.4.8.1. U.S. Market size and forecast, 2016-2026 (USD Million)
        2. 5.4.8.2. U.S. Market size and forecast, 2016-2026 (Tones)
      9. 5.4.9. Canada
        1. 5.4.9.1. Canada Market size and forecast, 2016-2026 (USD Million)
        2. 5.4.9.2. Canada Market size and forecast, 2016-2026 (Tones)
    5. 5.5. Europe
      1. 5.5.1. Europe Sacha Inchi Market size and forecast, 2016-2026
      2. 5.5.2. Europe Sacha Inchi Market, by Country, 2018 - 2025 (USD Million)
      3. 5.5.3. Europe Market size and forecast, 2016-2026 (Tones)
      4. 5.5.4. Europe Sacha Inchi Market, by Country, 2018 - 2025 (Tones)
      5. 5.5.5. Europe Sacha Inchi Market, by Form, 2016-2026
        1. 5.5.5.1. Europe Sacha Inchi Market, by Form, 2016-2026 (USD Million)
        2. 5.5.5.2. Europe Sacha Inchi Market, by Form, 2016-2026 (Tones)
      6. 5.5.6. Europe Sacha Inchi Market, by Application, 2016-2026
        1. 5.5.6.1. Europe Sacha Inchi Market, by Application, 2016-2026 (USD Million)
        2. 5.5.6.2. Europe Sacha Inchi Market, by Application, 2016-2026 (Tones)
      7. 5.5.7. Europe Sacha Inchi Market, by Distribution Channel, 2016-2026
        1. 5.5.7.1. Europe Sacha Inchi Market, by Distribution Channel, 2016-2026 (USD Million)
        2. 5.5.7.2. Europe Sacha Inchi Market, by Distribution Channel, 2016-2026 (Tones)
      8. 5.5.8. Germany
        1. 5.5.8.1. Germany Market size and forecast, 2016-2026 (USD Million)
        2. 5.5.8.2. Germany Market size and forecast, 2016-2026 (Tones)
      9. 5.5.9. France
        1. 5.5.9.1. France Market size and forecast, 2016-2026 (USD Million)
        2. 5.5.9.2. France Market size and forecast, 2016-2026 (Tones)
      10. 5.5.10. U.K.
        1. 5.5.10.1. U.K. Market size and forecast, 2016-2026 (USD Million)
        2. 5.5.10.2. U.K. Market size and forecast, 2016-2026 (Tones)
      11. 5.5.11. Italy
        1. 5.5.11.1. Italy Market size and forecast, 2016-2026 (USD Million)
        2. 5.5.11.2. Italy Market size and forecast, 2016-2026 (Tones)
      12. 5.5.12. Spain
        1. 5.5.12.1. Spain Market size and forecast, 2016-2026 (USD Million)
        2. 5.5.12.2. Spain Market size and forecast, 2016-2026 (Tones)
      13. 5.5.13. Rest of Europe
        1. 5.5.13.1. Rest of Europe Market size and forecast, 2016-2026 (USD Million)
        2. 5.5.13.2. Rest of Europe Market size and forecast, 2016-2026 (Tones)
    6. 5.6. Asia Pacific
      1. 5.6.1. Asia Pacific Sacha Inchi Market size and forecast, 2016-2026
      2. 5.6.2. Asia Pacific Sacha Inchi Market, by Country, 2018 - 2025 (USD Million)
      3. 5.6.3. Asia Pacific Market size and forecast, 2016-2026 (Tones)
      4. 5.6.4. Asia Pacific Sacha Inchi Market, by Country, 2018 - 2025 (Tones)
      5. 5.6.5. Asia Pacific Sacha Inchi Market, by Form, 2016-2026
        1. 5.6.5.1. Asia Pacific Sacha Inchi Market, by Form, 2016-2026 (USD Million)
        2. 5.6.5.2. Asia Pacific Sacha Inchi Market, by Form, 2016-2026 (Tones)
      6. 5.6.6. Asia Pacific Sacha Inchi Market, by Application, 2016-2026
        1. 5.6.6.1. Asia Pacific Sacha Inchi Market, by Application, 2016-2026 (USD Million)
        2. 5.6.6.2. Asia Pacific Sacha Inchi Market, by Application, 2016-2026 (Tones)
      7. 5.6.7. Asia Pacific Sacha Inchi Market, by Distribution Channel, 2016-2026
        1. 5.6.7.1. Asia Pacific Sacha Inchi Market, by Distribution Channel, 2016-2026 (USD Million)
        2. 5.6.7.2. Asia Pacific Sacha Inchi Market, by Distribution Channel, 2016-2026 (Tones)
      8. 5.6.8. China
        1. 5.6.8.1. China Market size and forecast, 2016-2026 (USD Million)
        2. 5.6.8.2. China Market size and forecast, 2016-2026 (Tones)
      9. 5.6.9. Japan
        1. 5.6.9.1. Japan Market size and forecast, 2016-2026 (USD Million)
        2. 5.6.9.2. Japan Market size and forecast, 2016-2026 (Tones)
      10. 5.6.10. India
        1. 5.6.10.1. India Market size and forecast, 2016-2026 (USD Million)
        2. 5.6.10.2. India Market size and forecast, 2016-2026 (Tones)
      11. 5.6.11. South Korea
        1. 5.6.11.1. South Korea Market size and forecast, 2016-2026 (USD Million)
        2. 5.6.11.2. South Korea Market size and forecast, 2016-2026 (Tones)
      12. 5.6.12. South-East Asia
        1. 5.6.12.1. South-East Asia Market size and forecast, 2016-2026 (USD Million)
        2. 5.6.12.2. South-East Asia Market size and forecast, 2016-2026 (Tones)
      13. 5.6.13. Rest of Asia Pacific
        1. 5.6.13.1. Rest of Asia Pacific Market size and forecast, 2016-2026 (USD Million)
        2. 5.6.13.2. Rest of Asia Pacific Market size and forecast, 2016-2026 (Tones)
    7. 5.7. Latin America
      1. 5.7.1. Latin America Sacha Inchi Market size and forecast, 2016-2026
      2. 5.7.2. Latin America Sacha Inchi Market, by Country, 2018 - 2025 (USD Million)
      3. 5.7.3. Latin America Market size and forecast, 2016-2026 (Tones)
      4. 5.7.4. Latin America Sacha Inchi Market, by Country, 2018 - 2025 (Tones)
      5. 5.7.5. Latin America Sacha Inchi Market, by Form, 2016-2026
        1. 5.7.5.1. Latin America Sacha Inchi Market, by Form, 2016-2026 (USD Million)
        2. 5.7.5.2. Latin America Sacha Inchi Market, by Form, 2016-2026 (Tones)
      6. 5.7.6. Latin America Sacha Inchi Market, by Application, 2016-2026
        1. 5.7.6.1. Latin America Sacha Inchi Market, by Application, 2016-2026 (USD Million)
        2. 5.7.6.2. Latin America Sacha Inchi Market, by Application, 2016-2026 (Tones)
      7. 5.7.7. Latin America Sacha Inchi Market, by Distribution Channel, 2016-2026
        1. 5.7.7.1. Latin America Sacha Inchi Market, by Distribution Channel, 2016-2026 (USD Million)
        2. 5.7.7.2. Latin America Sacha Inchi Market, by Distribution Channel, 2016-2026 (Tones)
      8. 5.7.8. Brazil
        1. 5.7.8.1. Brazil Market size and forecast, 2016-2026 (USD Million)
        2. 5.7.8.2. Brazil Market size and forecast, 2016-2026 (Tones)
      9. 5.7.9. Mexico
        1. 5.7.9.1. Mexico Market size and forecast, 2016-2026 (USD Million)
        2. 5.7.9.2. Mexico Market size and forecast, 2016-2026 (Tones)
      10. 5.7.10. Rest of Latin America
        1. 5.7.10.1. Rest of Latin America Market size and forecast, 2016-2026 (USD Million)
        2. 5.7.10.2. Rest of Latin America Market size and forecast, 2016-2026 (Tones)
    8. 5.8. The Middle-East and Africa
      1. 5.8.1. The Middle-East and Africa Sacha Inchi Market size and forecast, 2016-2026
      2. 5.8.2. The Middle-East and Africa Sacha Inchi Market, by Country, 2018 - 2025 (USD Million)
      3. 5.8.3. The Middle-East and Africa Market size and forecast, 2016-2026 (Tones)
      4. 5.8.4. The Middle-East and Africa Sacha Inchi Market, by Country, 2018 - 2025 (Tones)
      5. 5.8.5. The Middle-East and Africa Sacha Inchi Market, by Form, 2016-2026
        1. 5.8.5.1. The Middle-East and Africa Sacha Inchi Market, by Form, 2016-2026 (USD Million)
        2. 5.8.5.2. The Middle-East and Africa Sacha Inchi Market, by Form, 2016-2026 (Tones)
      6. 5.8.6. The Middle-East and Africa Sacha Inchi Market, by Application, 2016-2026
        1. 5.8.6.1. The Middle-East and Africa Sacha Inchi Market, by Application, 2016-2026 (USD Million)
        2. 5.8.6.2. The Middle-East and Africa Sacha Inchi Market, by Application, 2016-2026 (Tones)
      7. 5.8.7. The Middle-East and Africa Sacha Inchi Market, by Distribution Channel, 2016-2026
        1. 5.8.7.1. The Middle-East and Africa Sacha Inchi Market, by Distribution Channel, 2016-2026 (USD Million)
        2. 5.8.7.2. The Middle-East and Africa Sacha Inchi Market, by Distribution Channel, 2016-2026 (Tones)
      8. 5.8.8. GCC Countries
        1. 5.8.8.1. GCC Countries Market size and forecast, 2016-2026 (USD Million)
        2. 5.8.8.2. GCC Countries Market size and forecast, 2016-2026 (Tones)
      9. 5.8.9. South Africa
        1. 5.8.9.1. South Africa Market size and forecast, 2016-2026 (USD Million)
        2. 5.8.9.2. South Africa Market size and forecast, 2016-2026 (Tones)
      10. 5.8.10. Rest of Middle-East Africa
        1. 5.8.10.1. Rest of Middle-East Africa Market size and forecast, 2016-2026 (USD Million)
        2. 5.8.10.2. Rest of Middle-East Africa Market size and forecast, 2016-2026 (Tones)
  6. CHAPTER 6. Sacha Inchi Production, Consumption, Export, Import by Regions
    1. 6.1. Global Sacha Inchi Production and Consumption, 2015-2025 (Tones)
    2. 6.2. Global Import and Export Analysis, by Region
  7. CHAPTER 7. Sacha Inchi market – Competitive Landscape
    1. 7.1. Competitor Market Share – Revenue
    2. 7.2. Market Concentration Rate Analysis, Top 3 and Top 5 Players
    3. 7.3. Competitor Market Share – Volume
    4. 7.4. Strategic Development
      1. 7.4.1. Acquisitions and Mergers
      2. 7.4.2. New Products
      3. 7.4.3. Research & Development Activities
  8. CHAPTER 8. Company Profiles
    1. 8.1. Imlakesh Organics
      1. 8.1.1. Company Overview
      2. 8.1.2. Imlakesh Organics Sales, Revenue, Price, and Gross Margin
      3. 8.1.3. Product portfolio
      4. 8.1.4. Recent initiatives
    2. 8.2. MaiSavanhLao
      1. 8.2.1. Company Overview
      2. 8.2.2. MaiSavanhLao Sales, Revenue, Price, and Gross Margin
      3. 8.2.3. Product portfolio
      4. 8.2.4. Recent initiatives
    3. 8.3. Natures Power Nutraceuticals Corp
      1. 8.3.1. Company Overview
      2. 8.3.2. Natures Power Nutraceuticals Corp Sales, Revenue, Price, and Gross Margin
      3. 8.3.3. Product portfolio
      4. 8.3.4. Recent initiatives
    4. 8.4. Flora Health
      1. 8.4.1. Company Overview
      2. 8.4.2. Flora Health Sales, Revenue, Price, and Gross Margin
      3. 8.4.3. Product portfolio
      4. 8.4.4. Recent initiatives
    5. 8.5. Herbs America
      1. 8.5.1. Company Overview
      2. 8.5.2. Herbs America Sales, Revenue, Price, and Gross Margin
      3. 8.5.3. Product portfolio
      4. 8.5.4. Recent initiatives
  9. CHAPTER 9. Sacha Inchi — Industry Analysis
    1. 9.1. Introduction and Taxonomy
    2. 9.2. Sacha Inchi Market – Key Trends
      1. 9.2.1. Market Drivers
      2. 9.2.2. Market Restraints
      3. 9.2.3. Market Opportunities
    3. 9.3. Value Chain Analysis
    4. 9.4. Key Mandates and Regulations
    5. 9.5. Technology Roadmap and Timeline
    6. 9.6. Sacha Inchi market – Attractiveness Analysis
      1. 9.6.1. By Form
      2. 9.6.2. By Application
      3. 9.6.3. By Distribution Channel
      4. 9.6.4. By Region
  10. CHAPTER 10. Raw Material analysis
    1. 10.1. Sacha Inchi Key Raw Material Analysis
      1. 10.1.1. Key Raw Materials
      2. 10.1.2. Price Trend of Key Raw Materials
    2. 10.2. Key Suppliers of Raw Materials
    3. 10.3. Proportion of Manufacturing Cost Structure
      1. 10.3.1. Raw Materials
      2. 10.3.2. Labor Cost
    4. 10.4. Manufacturing Expenses Analysis of Sacha Inchi
  11. CHAPTER 11. Industrial Chain, Sourcing Strategy and Downstream Buyers
    1. 11.1. Sacha Inchi Industrial Chain Analysis
    2. 11.2. Upstream Raw Materials Sourcing
      1. 11.2.1. Risk Mitigation:
      2. 11.2.2. Supplier Relationships:
      3. 11.2.3. Business Processes:
      4. 11.2.4. Securing the Product:
    3. 11.3. Raw Materials Sources of Sacha Inchi Major Manufacturers in 2016
    4. 11.4. Downstream Buyers
    5. 11.5. Distributors/Traders List
  12. CHAPTER 12. Marketing Strategy Analysis, Distributors
    1. 12.1. Marketing Channel
    2. 12.2. Direct Marketing
    3. 12.3. Indirect Marketing
    4. 12.4. Marketing Channel Development Trend
    5. 12.5. Economic/Political Environmental Change
  13. CHAPTER 13. Report Conclusion
  14. CHAPTER 14. Research Approach & Methodology
    1. 14.1. Report Description
    2. 14.2. Research Scope
    3. 14.3. Research Methodology
      1. 14.3.1. Secondary Research
      2. 14.3.2. Primary Research
      3. 14.3.3. Models
        1. 14.3.3.1. Company Share Analysis Model
        2. 14.3.3.2. Revenue Based Modeling
        3. 14.3.3.3. Research Limitations

        List of Figures

        FIG. 1    Global Sacha Inchi Market, 2016-2026 (USD Million)
        FIG. 2    Global Sacha Inchi Market Share, by Form, 2019 & 2026 (USD Million)
        FIG. 3    Global Sacha Inchi Market share, by Form, 2019 & 2026 (Tons)
        FIG. 4    Global Powder Sacha Inchi Sacha Inchi Market, 2016-2026 (USD Million)
        FIG. 5    Global Powder Sacha Inchi Sacha Inchi  Market, 2016-2026 (Tons)
        FIG. 6    Global Liquid Sacha Inchi Sacha Inchi Market, 2016-2026 (USD Million)
        FIG. 7    Global Liquid Sacha Inchi Sacha Inchi  Market, 2016-2026 (Tons)
        FIG. 8    Global Sacha Inchi Market Share, by Application, 2019 & 2026 (USD Million)
        FIG. 9    Global Sacha Inchi Market share, by Application, 2019 & 2026 (Tons)
        FIG. 10    Global Pharmaceuticals Sacha Inchi Market, 2016-2026 (USD Million)
        FIG. 11    Global Pharmaceuticals Sacha Inchi  Market, 2016-2026 (Tons)
        FIG. 12    Global Cosmetics Sacha Inchi Market, 2016-2026 (USD Million)
        FIG. 13    Global Cosmetics Sacha Inchi  Market, 2016-2026 (Tons)
        FIG. 14    Global Food and beverages Sacha Inchi Market, 2016-2026 (USD Million)
        FIG. 15    Global Food and beverages Sacha Inchi  Market, 2016-2026 (Tons)
        FIG. 16    Global Dietary supplement Sacha Inchi Market, 2016-2026 (USD Million)
        FIG. 17    Global Dietary supplement Sacha Inchi  Market, 2016-2026 (Tons)
        FIG. 18    Global Sacha Inchi Market Share, by Distribution Channel, 2019 & 2026 (USD Million)
        FIG. 19    Global Sacha Inchi Market share, by Distribution Channel, 2019 & 2026 (Tons)
        FIG. 20    Global Direct Sale Sacha Inchi Market, 2016-2026 (USD Million)
        FIG. 21    Global Direct Sale Sacha Inchi  Market, 2016-2026 (Tons)
        FIG. 22    Global Distributor Sacha Inchi Market, 2016-2026 (USD Million)
        FIG. 23    Global Distributor Sacha Inchi  Market, 2016-2026 (Tons)
        FIG. 24    Global Sacha Inchi Market Share, by Region, 2019 & 2026
        FIG. 25    Global Sacha Inchi Market Share, by Region, 2019 & 2026
        FIG. 26    North America Sacha Inchi Market, 2016-2026
        FIG. 27    North America Sacha Inchi  Market, 2016-2026 (Tons)
        FIG. 28    U.S. Sacha Inchi Market, 2016-2026
        FIG. 29    U.S. Sacha Inchi  Market, 2016-2026 (Tons)
        FIG. 30    Canada Sacha Inchi Market, 2016-2026
        FIG. 31    Canada Sacha Inchi  Market, 2016-2026 (Tons)
        FIG. 32    Europe Sacha Inchi Market, 2016-2026
        FIG. 33    Europe Sacha Inchi  Market, 2016-2026 (Tons)
        FIG. 34    Germany Sacha Inchi Market, 2016-2026
        FIG. 35    Germany Sacha Inchi  Market, 2016-2026 (Tons)
        FIG. 36    France Sacha Inchi Market, 2016-2026
        FIG. 37    France Sacha Inchi  Market, 2016-2026 (Tons)
        FIG. 38    U.K. Sacha Inchi Market, 2016-2026
        FIG. 39    U.K. Sacha Inchi  Market, 2016-2026 (Tons)
        FIG. 40    Italy Sacha Inchi Market, 2016-2026
        FIG. 41    Italy Sacha Inchi  Market, 2016-2026 (Tons)
        FIG. 42    Spain Sacha Inchi Market, 2016-2026
        FIG. 43    Spain Sacha Inchi  Market, 2016-2026 (Tons)
        FIG. 44    Rest of Europe Sacha Inchi Market, 2016-2026
        FIG. 45    Rest of Europe Sacha Inchi  Market, 2016-2026 (Tons)
        FIG. 46    Asia Pacific Sacha Inchi Market, 2016-2026
        FIG. 47    Asia Pacific Sacha Inchi  Market, 2016-2026 (Tons)
        FIG. 48    China Sacha Inchi Market, 2016-2026
        FIG. 49    China Sacha Inchi  Market, 2016-2026 (Tons)
        FIG. 50    Japan Sacha Inchi Market, 2016-2026
        FIG. 51    Japan Sacha Inchi  Market, 2016-2026 (Tons)
        FIG. 52    India Sacha Inchi Market, 2016-2026
        FIG. 53    India Sacha Inchi  Market, 2016-2026 (Tons)
        FIG. 54    South  Korea Sacha Inchi Market, 2016-2026
        FIG. 55    South  Korea Sacha Inchi  Market, 2016-2026 (Tons)
        FIG. 56    South-East Asia Sacha Inchi Market, 2016-2026
        FIG. 57    South-East Asia Sacha Inchi  Market, 2016-2026 (Tons)
        FIG. 58    Rest of Asia Pacific Sacha Inchi Market, 2016-2026
        FIG. 59    Rest of Asia Pacific Sacha Inchi  Market, 2016-2026 (Tons)
        FIG. 60    Latin America Sacha Inchi Market, 2016-2026
        FIG. 61    Latin America Sacha Inchi  Market, 2016-2026 (Tons)
        FIG. 62    Brazil Sacha Inchi Market, 2016-2026
        FIG. 63    Brazil Sacha Inchi  Market, 2016-2026 (Tons)
        FIG. 64    Mexico Sacha Inchi Market, 2016-2026
        FIG. 65    Mexico Sacha Inchi  Market, 2016-2026 (Tons)
        FIG. 66    Rest of Latin America Sacha Inchi Market, 2016-2026
        FIG. 67    Rest of Latin America Sacha Inchi  Market, 2016-2026 (Tons)
        FIG. 68    The Middle-East and Africa Sacha Inchi Market, 2016-2026
        FIG. 69    The Middle-East and Africa Sacha Inchi  Market, 2016-2026 (Tons)
        FIG. 70    GCC Countries Sacha Inchi Market, 2016-2026
        FIG. 71    GCC Countries Sacha Inchi  Market, 2016-2026 (Tons)
        FIG. 72    South Africa Sacha Inchi Market, 2016-2026
        FIG. 73    South Africa Sacha Inchi  Market, 2016-2026 (Tons)
        FIG. 74    Rest of Middle-East Africa Sacha Inchi Market, 2016-2026
        FIG. 75    Rest of Middle-East Africa Sacha Inchi  Market, 2016-2026 (Tons)
        FIG. 76    Global Sacha Inchi Production and Consumption, 2015-2025 (Tons)
        FIG. 77    North America Sacha Inchi Production and Consumption, 2015-2025 (Tons)
        FIG. 78    Europe Sacha Inchi Production and Consumption, 2015-2025 (Tons)
        FIG. 79    Asia Pacific Sacha Inchi Production and Consumption, 2015-2025 (Tons)
        FIG. 80    Latin America Sacha Inchi Production and Consumption, 2015-2025 (Tons)
        FIG. 81    Middle East and Africa Sacha Inchi Production and Consumption, 2015-2025 (Tons)
        FIG. 82    Competitor Market Share – Revenue
        FIG. 83    Competitor Market Share – Volume
        FIG. 84    Imlakesh Organics Revenue and Growth Rate
        FIG. 85    Imlakesh Organics Market Share
        FIG. 86    MaiSavanhLao Revenue and Growth Rate
        FIG. 87    MaiSavanhLao Market Share
        FIG. 88    Natures Power Nutraceuticals Corp Revenue and Growth Rate
        FIG. 89    Natures Power Nutraceuticals Corp Market Share
        FIG. 90    Flora Health Revenue and Growth Rate
        FIG. 91    Flora Health Market Share
        FIG. 92    Herbs America Revenue and Growth Rate
        FIG. 93    Herbs America Market Share
        FIG. 94    Market Dynamics
        FIG. 95    Global Sacha Inchi – Value Chain Analysis
        FIG. 96    Key Mandates and Regulations
        FIG. 97    Technology Roadmap and Timeline
        FIG. 98    Market Attractiveness Analysis – By Form
        FIG. 99    Market Attractiveness Analysis – By Application
        FIG. 100    Market Attractiveness Analysis – By Distribution Channel
        FIG. 101    Market Attractiveness Analysis – By Region
        FIG. 102    Manufacturing Cost Structure of Sacha Inchi
        FIG. 103    Sacha Inchi Industrial Chain Analysis
        FIG. 104    Market Channel
        FIG. 105    Marketing Channel Development Trend
        FIG. 106    Growth in World Gross Product, 2010-2019


        List of Tables

        TABLE 1    Global Sacha Inchi market, 2019 & 2026 (USD Million)
        TABLE 2    Global Sacha Inchi market, by Form, 2016-2026 (USD Million)
        TABLE 3    Global Sacha Inchi market, by Form, 2016-2026 (Tons)
        TABLE 4    Global Sacha Inchi market, by Application, 2016-2026 (USD Million)
        TABLE 5    Global Sacha Inchi market, by Application, 2016-2026 (Tons)
        TABLE 6    Global Sacha Inchi market, by Distribution Channel, 2016-2026 (USD Million)
        TABLE 7    Global Sacha Inchi market, by Distribution Channel, 2016-2026 (Tons)
        TABLE 8    Global Sacha Inchi market, by region, 2016-2026 (USD Million)
        TABLE 9    Global Sacha Inchi market, by region, 2016-2026 (Tons)
        TABLE 10    North America Sacha Inchi Market, by Form, 2016-2026 (USD Million)
        TABLE 11    North America Sacha Inchi Market, by Form, 2016-2026 (Tons)
        TABLE 12    North America Sacha Inchi Market, by Application, 2016-2026 (USD Million)
        TABLE 13    North America Sacha Inchi Market, by Application, 2016-2026 (Tons)
        TABLE 14    North America Sacha Inchi Market, by Distribution Channel, 2016-2026 (USD Million)
        TABLE 15    North America Sacha Inchi Market, by Distribution Channel, 2016-2026 (Tons)
        TABLE 16    Europe Sacha Inchi Market, by Form, 2016-2026 (USD Million)
        TABLE 17    Europe Sacha Inchi Market, by Form, 2016-2026 (Tons)
        TABLE 18    Europe Sacha Inchi Market, by Application, 2016-2026 (USD Million)
        TABLE 19    Europe Sacha Inchi Market, by Application, 2016-2026 (Tons)
        TABLE 20    Europe Sacha Inchi Market, by Distribution Channel, 2016-2026 (USD Million)
        TABLE 21    Europe Sacha Inchi Market, by Distribution Channel, 2016-2026 (Tons)
        TABLE 22    Asia Pacific Sacha Inchi Market, by Form, 2016-2026 (USD Million)
        TABLE 23    Asia Pacific Sacha Inchi Market, by Form, 2016-2026 (Tons)
        TABLE 24    Asia Pacific Sacha Inchi Market, by Application, 2016-2026 (USD Million)
        TABLE 25    Asia Pacific Sacha Inchi Market, by Application, 2016-2026 (Tons)
        TABLE 26    Asia Pacific Sacha Inchi Market, by Distribution Channel, 2016-2026 (USD Million)
        TABLE 27    Asia Pacific Sacha Inchi Market, by Distribution Channel, 2016-2026 (Tons)
        TABLE 28    Latin America Sacha Inchi Market, by Form, 2016-2026 (USD Million)
        TABLE 29    Latin America Sacha Inchi Market, by Form, 2016-2026 (Tons)
        TABLE 30    Latin America Sacha Inchi Market, by Application, 2016-2026 (USD Million)
        TABLE 31    Latin America Sacha Inchi Market, by Application, 2016-2026 (Tons)
        TABLE 32    Latin America Sacha Inchi Market, by Distribution Channel, 2016-2026 (USD Million)
        TABLE 33    Latin America Sacha Inchi Market, by Distribution Channel, 2016-2026 (Tons)
        TABLE 34    The Middle-East and Africa Sacha Inchi Market, by Form, 2016-2026 (USD Million)
        TABLE 35    The Middle-East and Africa Sacha Inchi Market, by Form, 2016-2026 (Tons)
        TABLE 36    The Middle-East and Africa Sacha Inchi Market, by Application, 2016-2026 (USD Million)
        TABLE 37    The Middle-East and Africa Sacha Inchi Market, by Application, 2016-2026 (Tons)
        TABLE 38    The Middle-East and Africa Sacha Inchi Market, by Distribution Channel, 2016-2026 (USD Million)
        TABLE 39    The Middle-East and Africa Sacha Inchi Market, by Distribution Channel, 2016-2026 (Tons)
        TABLE 40    North America Sacha Inchi Production, Consumption, Export, Import, 2016-2019
        TABLE 41    Europe Sacha Inchi Production, Consumption, Export, Import, 2016-2019
        TABLE 42    Asia Pacific Sacha Inchi Production, Consumption, Export, Import, 2016-2019
        TABLE 43    Latin America Sacha Inchi Production, Consumption, Export, Import, 2016-2019
        TABLE 44    Middle East & Africa Sacha Inchi Production, Consumption, Export, Import, 2016-2019
        TABLE 45    Global Sacha Inchi Market - Company Revenue Analysis 2016-2019 (USD Million)
        TABLE 46    Global Sacha Inchi Market - Company Revenue Share Analysis 2016-2019(%)
        TABLE 47    Global Sacha Inchi Market - Company Volume Analysis 2016-2019 (Tons)
        TABLE 48    Global Sacha Inchi Market - Company Volume Share Analysis 2016-2019(%)
        TABLE 49    Acquisitions and Mergers
        TABLE 50    New Product/Service Launch
        TABLE 51    Research & Development Activities
        TABLE 52    Market Drivers
        TABLE 53    Market Restraints
        TABLE 54    Market Opportunities
        TABLE 55    Production Base and Market Concentration Rate of Raw Material
        TABLE 56    Key Suppliers of Raw Materials
        TABLE 57    Raw Materials Sources of Sacha Inchi Major Manufacturers in 2016
        TABLE 58    Major Buyers of Sacha Inchi
        TABLE 59    Distributors/Traders of Sacha Inchi by Region

Industry Major Market Players

  • Imlakesh Organics
  • MaiSavanhLao
  • Natures Power Nutraceuticals Corp
  • Flora Health
  • Herbs America.