Search Market Research Report

Discover Our Latest Reports
Discover Our Featured Reports
Discover Top Selling Reports

Rubber Processing Chemicals Market Size, Share Global Analysis Report, 2020–2026

report img

Rubber Processing Chemicals Market By Type (Flame Retardants, Anti-Degradants, Processing Aid and Accelerators) and By Application (Non-Tire and Tire): Global Industry Outlook, Market Size, Business Intelligence, Consumer Preferences, Statistical Surveys, Comprehensive Analysis, Historical Developments, Current Trends, and Forecast 2020–2026

Industry Insights

[191+ Pages Report] According to the report published by Facts Factors, the global rubber processing chemicals market size was worth around USD 4.6 billion in 2019 and is predicted to grow to around USD 6.5 billion by 2026 with a compound annual growth rate (CAGR) of roughly 5.2% between 2020 and 2026. The report analyzes the global rubber processing chemicals market drivers, restraints/challenges, and the effect they have on the demands during the projection period. In addition, the report explores emerging opportunities in the rubber processing chemicals market.

Rubber Processing Chemicals Market Size

To know more about this report | Request Free Sample Copy

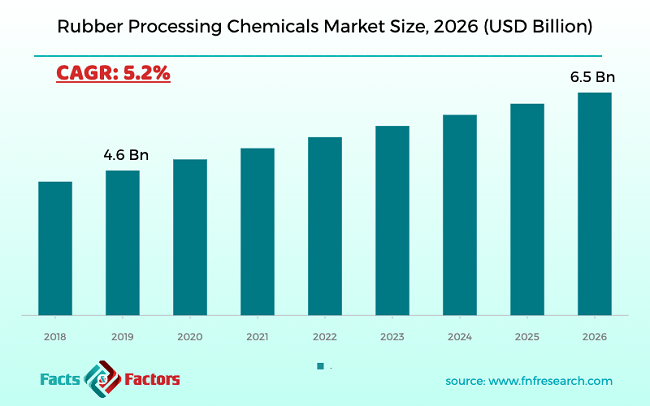
The rubber processing chemicals market report analyzes and notifies the industry statistics at the global as well as regional and country levels in order to acquire a thorough perspective of the entire rubber processing chemicals market. The historical and past insights are provided for FY 2016 to FY 2019 whereas projected trends are delivered for FY 2020 to FY 2026. The quantitative and numerical data is represented in terms of both volume (Kilo Tons) and value (USD Billion) from FY 2016 – 2026.

This specialized and expertise-oriented industry research report scrutinizes the technical and commercial business outlook of the rubber processing chemicals industry. The report analyzes and declares the historical and current trends analysis of the rubber processing chemicals industry and subsequently recommends the projected trends anticipated to be observed in the rubber processing chemicals market during the upcoming years.


logoKey Insights from Primary Research

  • As per our primary respondents, the rubber processing chemicals market is set to grow annually at a rate of around 5.2%
  • It was established through primary research that the rubber processing chemicals market was valued at around USD 4.6 billion in 2019
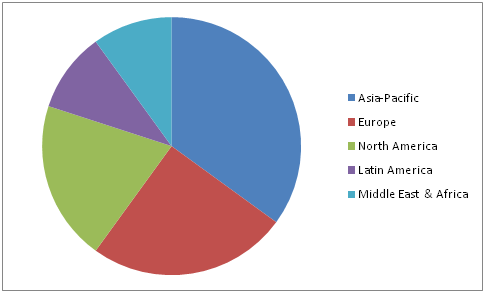
  • The Asia Pacific held the largest market share of rubber processing chemicals in terms of revenue in 2019
  • The “Anti-Degradants” category, on the basis of type segmentation, was the leading revenue-generating category in 2019
  • The “Tire” category, on the basis of application segmentation, was the leading revenue-generating in 2019

logoKey Recommendations from Analysts

  • As per our analysts, the rubber and automobile industry is expected to drive the market for rubber processing chemicals in the coming years
  • High demand for heat, water, and mechanical resistance rubber is likely to fuel the rubber processing chemicals market in the near future
  • Stringent regulation led by the government for rubber processing due to the huge amount of pollution caused by rubber processing is anticipated to hamper the market growth
  • Emerging economies such as India, China, and Japan are expected to be the most prominent markets for rubber processing chemicals in the near future due to the increasing automobile industry
  • Stringent regulations imposed by the government in North America for the use of rubber processing chemicals may limit the growth of the rubber processing chemicals market

logoGlobal Rubber Processing Chemicals Market Share – By Region

Rubber Processing Chemicals Market

To know more about this report | Request Free Sample Copy


The quantitative data is further underlined and reinforced by comprehensive qualitative data which comprises various across-the-board market dynamics. The rationales which directly or indirectly impact the rubber processing chemicals industry are exemplified through parameters such as growth drivers, restraints, challenges, and opportunities among other impacting factors.

Throughout our research report, we have encompassed all the proven models and tools of industry analysis and extensively illustrated all the key business strategies and business models adopted in the rubber processing chemicals industry. The report provides an all-inclusive and detailed competitive landscape prevalent in the rubber processing chemicals market.

The report utilizes established industry analysis tools and models such as Porter’s Five Forces framework to analyze and recognize critical business strategies adopted by various stakeholders involved in the entire value chain of the rubber processing chemicals industry. The rubber processing chemicals market report additionally employs SWOT analysis and PESTLE analysis models for further in-depth analysis. The report is equipped with a radar chart that will compare various categories of the segment on a given scale in order to give a scale for comparison.

The report study further includes an in-depth analysis of industry players' market shares and provides an overview of leading players' market position in the rubber processing chemicals sector. Key strategic developments in the rubber processing chemicals market competitive landscape such as acquisitions & mergers, inaugurations of different products and services, partnerships & joint ventures, MoU agreements, VC & funding activities, R&D activities, and geographic expansion among other noteworthy activities by key players of the rubber processing chemicals market are appropriately highlighted in the report.

Rubber processing chemicals enhance rubber properties in terms of heat resistance, water, and mechanical stress resistance. Therefore, rubber processing chemicals find applications in various industries such as in rubber and automobile industries which are expected to drive the market growth of rubber processing chemicals in the coming years. Rubber-based products such as tires, mats, hoses, floors, gloves, and belts are highly consumed across the globe.

This has led to the high growth of the rubber industry, in turn, exhibiting the growth of the rubber processing chemical market in the coming years. Stringent regulations imposed by the governing bodies on harmful emissions exhaled out during rubber processing may hinder the rubber processing chemical market growth in the forecast period. Nevertheless, increasing demand for bio-based rubber along with growing demand for rubber processing chemicals from emerging countries is likely to open a new avenue for the rubber processing chemicals market in the coming years.

The rubber processing chemicals market research report delivers an acute valuation and taxonomy of the rubber processing chemicals industry by practically splitting the market on the basis of different types, applications, and regions. Through the analysis of the historical and projected trends, all the segments and sub-segments were evaluated through the bottom-up approach, and different market sizes have been projected for FY 2020 to FY 2026.

logoReport Scope

Report Attribute

Details

Market Size in 2019

USD 4.6 Billion

Projected Market Size in 2026

USD 6.5 Billion

CAGR Growth Rate

5.2% CAGR

Base Year

2019

Forecast Years

2020-2026

Key Market Players

LANXESS Corporation, Solvay SA, Emerald Performance Materials, Chemtura Corporation, China Petroleum & Chemical Corporation, Behn Meyer Group, R.T. Vanderbilt Company, Eastman Chemical Company,AkzoNobel N.V, Emery OleochemicalsLlcand, and Others

Key Segment

By Type, Application, and Region

Major Regions Covered

North America, Europe, Asia Pacific, Latin America, and the Middle East & Africa

Purchase Options

Request customized purchase options to meet your research needs. Explore purchase options

The regional segmentation of the rubber processing chemicals industry includes the complete classification of all the major continents including North America, Latin America, Europe, Asia Pacific, and the Middle East & Africa. Further, country-wise data for the rubber processing chemicals industry is provided for the leading economies of the world.

The rubber processing chemicals market is segmented based on Type and Application. On the basis of type segmentation, the market is classified into Flame Retardants, Anti-Degradants, Processing Aids, and Accelerators. In terms of Application segmentation, the market is bifurcated into Non-Tire and Tire.

logoSome of the essential players operating in the rubber processing chemicals market, but not restricted include

  •  LANXESS Corporation
  •  Solvay SA
  •  Emerald Performance Materials
  •  Chemtura Corporation
  •  China Petroleum & Chemical Corporation
  •  Behn Meyer Group
  •  R.T. Vanderbilt Company
  •  Eastman Chemical Company
  •  Akzonobel N.V
  •  Emery OleochemicalsLlc

The taxonomy of the rubber processing chemicals industry by its scope and segmentation is as follows:

logo By Type Segmentation Analysis

  • Flame retardants
  • Anti-degradants
  • Processing aid
  • Accelerators

logo By Application Segmentation Analysis

  • Tire
  • Non-tire

logo Regional Segmentation Analysis

  • North America
    • The U.S.
    • Canada
  • Europe
    • Germany
    • The UK
    • France
    • Spain
    • Italy
    • Rest of Europe
  • Asia Pacific
    • China
    • Japan
    • India
    • South Korea
    • Southeast Asia
    • Rest of Asia Pacific
  • Latin America
    • Brazil
    • Mexico
    • Rest of Latin America
  • Middle East & Africa
    • GCC
    • South Africa
    • Rest of the Middle East & Africa

Table of Content

  1. CHAPTER 1. Executive Summary
  2. CHAPTER 2. Rubber Processing Chemicals market – Type Analysis
    1. 2.1. Global Rubber Processing Chemicals Market – Type Overview
    2. 2.2. Global Rubber Processing Chemicals Market Share, by Type, 2019 & 2026 (USD Billion)
    3. 2.3. Global Rubber Processing Chemicals Market share, by Type, 2019 & 2026 (Kilo Tons)
    4. 2.4. Flame retardants
      1. 2.4.1. Global Flame retardants Rubber Processing Chemicals Market, 2016-2026 (USD Billion)
      2. 2.4.2. Global Flame retardants Rubber Processing Chemicals Market, 2016-2026 (Kilo Tons)
    5. 2.5. Anti-degradants
      1. 2.5.1. Global Anti-degradants Rubber Processing Chemicals Market, 2016-2026 (USD Billion)
      2. 2.5.2. Global Anti-degradants Rubber Processing Chemicals Market, 2016-2026 (Kilo Tons)
    6. 2.6. Processing Aid
      1. 2.6.1. Global Processing Aid Rubber Processing Chemicals Market, 2016-2026 (USD Billion)
      2. 2.6.2. Global Processing Aid Rubber Processing Chemicals Market, 2016-2026 (Kilo Tons)
    7. 2.7. Accelerators
      1. 2.7.1. Global Accelerators Rubber Processing Chemicals Market, 2016-2026 (USD Billion)
      2. 2.7.2. Global Accelerators Rubber Processing Chemicals Market, 2016-2026 (Kilo Tons)
  3. CHAPTER 3. Rubber Processing Chemicals market – Application Analysis
    1. 3.1. Global Rubber Processing Chemicals Market – Application Overview
    2. 3.2. Global Rubber Processing Chemicals Market Share, by Application, 2019 & 2026 (USD Billion)
    3. 3.3. Global Rubber Processing Chemicals Market share, by Application, 2019 & 2026 (Kilo Tons)
    4. 3.4. Tire
      1. 3.4.1. Global Tire Rubber Processing Chemicals Market, 2016-2026 (USD Billion)
      2. 3.4.2. Global Tire Rubber Processing Chemicals Market, 2016-2026 (Kilo Tons)
    5. 3.5. Non-tire
      1. 3.5.1. Global Non-tire Rubber Processing Chemicals Market, 2016-2026 (USD Billion)
      2. 3.5.2. Global Non-tire Rubber Processing Chemicals Market, 2016-2026 (Kilo Tons)
  4. CHAPTER 4. Rubber Processing Chemicals market – Regional Analysis
    1. 4.1. Global Rubber Processing Chemicals Market Regional Overview
    2. 4.2. Global Rubber Processing Chemicals Market Share, by Region, 2019 & 2026 (Value)
    3. 4.3. Global Rubber Processing Chemicals Market Share, by Region, 2019 & 2026 (Volume)
    4. 4.4. North America
      1. 4.4.1. North America Rubber Processing Chemicals Market size and forecast, 2016-2026
      2. 4.4.2. North America Rubber Processing Chemicals Market, by Country, 2019 - 2026 (USD Billion)
      3. 4.4.3. North America Market size and forecast, 2016-2026 (Kilo Tons)
      4. 4.4.4. North America Rubber Processing Chemicals Market, by Country, 2019 - 2026 (Kilo Tons)
      5. 4.4.5. North America Rubber Processing Chemicals Market, by Type, 2016-2026
        1. 4.4.5.1. North America Rubber Processing Chemicals Market, by Type, 2016-2026 (USD Billion)
        2. 4.4.5.2. North America Rubber Processing Chemicals Market, by Type, 2016-2026 (Kilo Tons)
      6. 4.4.6. North America Rubber Processing Chemicals Market, by Application, 2016-2026
        1. 4.4.6.1. North America Rubber Processing Chemicals Market, by Application, 2016-2026 (USD Billion)
        2. 4.4.6.2. North America Rubber Processing Chemicals Market, by Application, 2016-2026 (Kilo Tons)
      7. 4.4.7. U.S.
        1. 4.4.7.1. U.S. Market size and forecast, 2016-2026 (USD Billion)
        2. 4.4.7.2. U.S. Market size and forecast, 2016-2026 (Kilo Tons)
      8. 4.4.8. Canada
        1. 4.4.8.1. Canada Market size and forecast, 2016-2026 (USD Billion)
        2. 4.4.8.2. Canada Market size and forecast, 2016-2026 (Kilo Tons)
    5. 4.5. Europe
      1. 4.5.1. Europe Rubber Processing Chemicals Market size and forecast, 2016-2026
      2. 4.5.2. Europe Rubber Processing Chemicals Market, by Country, 2019 - 2026 (USD Billion)
      3. 4.5.3. Europe Market size and forecast, 2016-2026 (Kilo Tons)
      4. 4.5.4. Europe Rubber Processing Chemicals Market, by Country, 2019 - 2026 (Kilo Tons)
      5. 4.5.5. Europe Rubber Processing Chemicals Market, by Type, 2016-2026
        1. 4.5.5.1. Europe Rubber Processing Chemicals Market, by Type, 2016-2026 (USD Billion)
        2. 4.5.5.2. Europe Rubber Processing Chemicals Market, by Type, 2016-2026 (Kilo Tons)
      6. 4.5.6. Europe Rubber Processing Chemicals Market, by Application, 2016-2026
        1. 4.5.6.1. Europe Rubber Processing Chemicals Market, by Application, 2016-2026 (USD Billion)
        2. 4.5.6.2. Europe Rubber Processing Chemicals Market, by Application, 2016-2026 (Kilo Tons)
      7. 4.5.7. Germany
        1. 4.5.7.1. Germany Market size and forecast, 2016-2026 (USD Billion)
        2. 4.5.7.2. Germany Market size and forecast, 2016-2026 (Kilo Tons)
      8. 4.5.8. France
        1. 4.5.8.1. France Market size and forecast, 2016-2026 (USD Billion)
        2. 4.5.8.2. France Market size and forecast, 2016-2026 (Kilo Tons)
      9. 4.5.9. U.K.
        1. 4.5.9.1. U.K. Market size and forecast, 2016-2026 (USD Billion)
        2. 4.5.9.2. U.K. Market size and forecast, 2016-2026 (Kilo Tons)
      10. 4.5.10. Italy
        1. 4.5.10.1. Italy Market size and forecast, 2016-2026 (USD Billion)
        2. 4.5.10.2. Italy Market size and forecast, 2016-2026 (Kilo Tons)
      11. 4.5.11. Spain
        1. 4.5.11.1. Spain Market size and forecast, 2016-2026 (USD Billion)
        2. 4.5.11.2. Spain Market size and forecast, 2016-2026 (Kilo Tons)
      12. 4.5.12. Rest of Europe
        1. 4.5.12.1. Rest of Europe Market size and forecast, 2016-2026 (USD Billion)
        2. 4.5.12.2. Rest of Europe Market size and forecast, 2016-2026 (Kilo Tons)
    6. 4.6. Asia Pacific
      1. 4.6.1. Asia Pacific Rubber Processing Chemicals Market size and forecast, 2016-2026
      2. 4.6.2. Asia Pacific Rubber Processing Chemicals Market, by Country, 2019 - 2026 (USD Billion)
      3. 4.6.3. Asia Pacific Market size and forecast, 2016-2026 (Kilo Tons)
      4. 4.6.4. Asia Pacific Rubber Processing Chemicals Market, by Country, 2019 - 2026 (Kilo Tons)
      5. 4.6.5. Asia Pacific Rubber Processing Chemicals Market, by Type, 2016-2026
        1. 4.6.5.1. Asia Pacific Rubber Processing Chemicals Market, by Type, 2016-2026 (USD Billion)
        2. 4.6.5.2. Asia Pacific Rubber Processing Chemicals Market, by Type, 2016-2026 (Kilo Tons)
      6. 4.6.6. Asia Pacific Rubber Processing Chemicals Market, by Application, 2016-2026
        1. 4.6.6.1. Asia Pacific Rubber Processing Chemicals Market, by Application, 2016-2026 (USD Billion)
        2. 4.6.6.2. Asia Pacific Rubber Processing Chemicals Market, by Application, 2016-2026 (Kilo Tons)
      7. 4.6.7. China
        1. 4.6.7.1. China Market size and forecast, 2016-2026 (USD Billion)
        2. 4.6.7.2. China Market size and forecast, 2016-2026 (Kilo Tons)
      8. 4.6.8. Japan
        1. 4.6.8.1. Japan Market size and forecast, 2016-2026 (USD Billion)
        2. 4.6.8.2. Japan Market size and forecast, 2016-2026 (Kilo Tons)
      9. 4.6.9. India
        1. 4.6.9.1. India Market size and forecast, 2016-2026 (USD Billion)
        2. 4.6.9.2. India Market size and forecast, 2016-2026 (Kilo Tons)
      10. 4.6.10. South Korea
        1. 4.6.10.1. South Korea Market size and forecast, 2016-2026 (USD Billion)
        2. 4.6.10.2. South Korea Market size and forecast, 2016-2026 (Kilo Tons)
      11. 4.6.11. South-East Asia
        1. 4.6.11.1. South-East Asia Market size and forecast, 2016-2026 (USD Billion)
        2. 4.6.11.2. South-East Asia Market size and forecast, 2016-2026 (Kilo Tons)
      12. 4.6.12. Rest of Asia Pacific
        1. 4.6.12.1. Rest of Asia Pacific Market size and forecast, 2016-2026 (USD Billion)
        2. 4.6.12.2. Rest of Asia Pacific Market size and forecast, 2016-2026 (Kilo Tons)
    7. 4.7. Latin America
      1. 4.7.1. Latin America Rubber Processing Chemicals Market size and forecast, 2016-2026
      2. 4.7.2. Latin America Rubber Processing Chemicals Market, by Country, 2019 - 2026 (USD Billion)
      3. 4.7.3. Latin America Market size and forecast, 2016-2026 (Kilo Tons)
      4. 4.7.4. Latin America Rubber Processing Chemicals Market, by Country, 2019 - 2026 (Kilo Tons)
      5. 4.7.5. Latin America Rubber Processing Chemicals Market, by Type, 2016-2026
        1. 4.7.5.1. Latin America Rubber Processing Chemicals Market, by Type, 2016-2026 (USD Billion)
        2. 4.7.5.2. Latin America Rubber Processing Chemicals Market, by Type, 2016-2026 (Kilo Tons)
      6. 4.7.6. Latin America Rubber Processing Chemicals Market, by Application, 2016-2026
        1. 4.7.6.1. Latin America Rubber Processing Chemicals Market, by Application, 2016-2026 (USD Billion)
        2. 4.7.6.2. Latin America Rubber Processing Chemicals Market, by Application, 2016-2026 (Kilo Tons)
      7. 4.7.7. Brazil
        1. 4.7.7.1. Brazil Market size and forecast, 2016-2026 (USD Billion)
        2. 4.7.7.2. Brazil Market size and forecast, 2016-2026 (Kilo Tons)
      8. 4.7.8. Mexico
        1. 4.7.8.1. Mexico Market size and forecast, 2016-2026 (USD Billion)
        2. 4.7.8.2. Mexico Market size and forecast, 2016-2026 (Kilo Tons)
      9. 4.7.9. Rest of Latin America
        1. 4.7.9.1. Rest of Latin America Market size and forecast, 2016-2026 (USD Billion)
        2. 4.7.9.2. Rest of Latin America Market size and forecast, 2016-2026 (Kilo Tons)
    8. 4.8. The Middle-East and Africa
      1. 4.8.1. The Middle-East and Africa Rubber Processing Chemicals Market size and forecast, 2016-2026
      2. 4.8.2. The Middle-East and Africa Rubber Processing Chemicals Market, by Country, 2019 - 2026 (USD Billion)
      3. 4.8.3. The Middle-East and Africa Market size and forecast, 2016-2026 (Kilo Tons)
      4. 4.8.4. The Middle-East and Africa Rubber Processing Chemicals Market, by Country, 2019 - 2026 (Kilo Tons)
      5. 4.8.5. The Middle-East and Africa Rubber Processing Chemicals Market, by Type, 2016-2026
        1. 4.8.5.1. The Middle-East and Africa Rubber Processing Chemicals Market, by Type, 2016-2026 (USD Billion)
        2. 4.8.5.2. The Middle-East and Africa Rubber Processing Chemicals Market, by Type, 2016-2026 (Kilo Tons)
      6. 4.8.6. The Middle-East and Africa Rubber Processing Chemicals Market, by Application, 2016-2026
        1. 4.8.6.1. The Middle-East and Africa Rubber Processing Chemicals Market, by Application, 2016-2026 (USD Billion)
        2. 4.8.6.2. The Middle-East and Africa Rubber Processing Chemicals Market, by Application, 2016-2026 (Kilo Tons)
      7. 4.8.7. GCC Countries
        1. 4.8.7.1. GCC Countries Market size and forecast, 2016-2026 (USD Billion)
        2. 4.8.7.2. GCC Countries Market size and forecast, 2016-2026 (Kilo Tons)
      8. 4.8.8. South Africa
        1. 4.8.8.1. South Africa Market size and forecast, 2016-2026 (USD Billion)
        2. 4.8.8.2. South Africa Market size and forecast, 2016-2026 (Kilo Tons)
      9. 4.8.9. Rest of Middle-East Africa
        1. 4.8.9.1. Rest of Middle-East Africa Market size and forecast, 2016-2026 (USD Billion)
        2. 4.8.9.2. Rest of Middle-East Africa Market size and forecast, 2016-2026 (Kilo Tons)
  5. CHAPTER 5. Rubber Processing Chemicals Production, Consumption, Export, Import by Regions
    1. 5.1. Global Rubber Processing Chemicals production and revenue, 2016-2026 (USD Billion) (Kilo Tons)
    2. 5.2. Global Import and Export Analysis, by Region
  6. CHAPTER 6. Rubber Processing Chemicals market – Competitive Landscape
    1. 6.1. Competitor Market Share – Revenue
    2. 6.2. Market Concentration Rate Analysis, Top 3 and Top 5 Players
    3. 6.3. Competitor Market Share – Volume
    4. 6.4. Strategic Development
      1. 6.4.1. Acquisitions and Mergers
      2. 6.4.2. New Products
      3. 6.4.3. Research & Development Activities
  7. CHAPTER 7. Company Profiles
    1. 7.1. LANXESS Corporation
      1. 7.1.1. Company Overview
      2. 7.1.2. LANXESS Corporation Sales, Revenue, Price, and Gross Margin
      3. 7.1.3. Product portfolio
      4. 7.1.4. Recent initiatives
    2. 7.2. Solvay SA
      1. 7.2.1. Company Overview
      2. 7.2.2. Solvay SA Sales, Revenue, Price, and Gross Margin
      3. 7.2.3. Product portfolio
      4. 7.2.4. Recent initiatives
    3. 7.3. Emerald Performance Materials
      1. 7.3.1. Company Overview
      2. 7.3.2. Emerald Performance Materials Sales, Revenue, Price, and Gross Margin
      3. 7.3.3. Product portfolio
      4. 7.3.4. Recent initiatives
    4. 7.4. Chemtura Corporation
      1. 7.4.1. Company Overview
      2. 7.4.2. Chemtura Corporation Sales, Revenue, Price, and Gross Margin
      3. 7.4.3. Product portfolio
      4. 7.4.4. Recent initiatives
    5. 7.5. China Petroleum & Chemical Corporation
      1. 7.5.1. Company Overview
      2. 7.5.2. China Petroleum & Chemical Corporation Sales, Revenue, Price, and Gross Margin
      3. 7.5.3. Product portfolio
      4. 7.5.4. Recent initiatives
    6. 7.6. Behn Meyer Group
      1. 7.6.1. Company Overview
      2. 7.6.2. Behn Meyer Group Sales, Revenue, Price, and Gross Margin
      3. 7.6.3. Product portfolio
      4. 7.6.4. Recent initiatives
    7. 7.7. R.T. Vanderbilt Company
      1. 7.7.1. Company Overview
      2. 7.7.2. R.T. Vanderbilt Company Sales, Revenue, Price, and Gross Margin
      3. 7.7.3. Product portfolio
      4. 7.7.4. Recent initiatives
    8. 7.8. Eastman Chemical Company
      1. 7.8.1. Company Overview
      2. 7.8.2. Eastman Chemical Company Sales, Revenue, Price, and Gross Margin
      3. 7.8.3. Product portfolio
      4. 7.8.4. Recent initiatives
    9. 7.9. Akzonobel N.V.
      1. 7.9.1. Company Overview
      2. 7.9.2. Akzonobel N.V. Sales, Revenue, Price, and Gross Margin
      3. 7.9.3. Product portfolio
      4. 7.9.4. Recent initiatives
    10. 7.10. Emery Oleochemicals Llc
      1. 7.10.1. Company Overview
      2. 7.10.2. Emery Oleochemicals Llc Sales, Revenue, Price, and Gross Margin
      3. 7.10.3. Product portfolio
      4. 7.10.4. Recent initiatives
  8. CHAPTER 8. Rubber Processing Chemicals — Industry Analysis
    1. 8.1. Introduction and Taxonomy
    2. 8.2. Rubber Processing Chemicals Market – Key Trends
      1. 8.2.1. Market Drivers
      2. 8.2.2. Market Restraints
      3. 8.2.3. Market Opportunities
    3. 8.3. Value Chain Analysis
    4. 8.4. Key Mandates and Regulations
    5. 8.5. Technology Roadmap and Timeline
    6. 8.6. Rubber Processing Chemicals market – Attractiveness Analysis
      1. 8.6.1. By Type
      2. 8.6.2. By Application
      3. 8.6.3. By Region
  9. CHAPTER 9. Raw Material analysis
    1. 9.1. Rubber Processing Chemicals Key Raw Material Analysis
      1. 9.1.1. Key Raw Materials
      2. 9.1.2. Price Trend of Key Raw Materials
    2. 9.2. Key Suppliers of Raw Materials
    3. 9.3. Proportion of Manufacturing Cost Structure
      1. 9.3.1. Raw Materials
      2. 9.3.2. Labor Cost
    4. 9.4. Manufacturing Expenses Analysis of Rubber Processing Chemicals
  10. CHAPTER 10. Industrial Chain, Sourcing Strategy and Downstream Buyers
    1. 10.1. Rubber Processing Chemicals Industrial Chain Analysis
    2. 10.2. Upstream Raw Materials Sourcing
      1. 10.2.1. Risk Mitigation:
      2. 10.2.2. Supplier Relationships:
      3. 10.2.3. Business Processes:
      4. 10.2.4. Securing the Product:
    3. 10.3. Raw Materials Sources of Rubber Processing Chemicals Major Manufacturers in 2016
    4. 10.4. Downstream Buyers
    5. 10.5. Distributors/Traders List
  11. CHAPTER 11. Marketing Strategy Analysis, Distributors
    1. 11.1. Marketing Channel
    2. 11.2. Direct Marketing
    3. 11.3. Indirect Marketing
    4. 11.4. Marketing Channel Development Trend
    5. 11.5. Economic/Political Environmental Change
  12. CHAPTER 12. Report Conclusion
  13. CHAPTER 13. Research Approach & Methodology
    1. 13.1. Report Description
    2. 13.2. Research Scope
    3. 13.3. Research Methodology
      1. 13.3.1. Secondary Research
      2. 13.3.2. Primary Research
      3. 13.3.3. Models
        1. 13.3.3.1. Company Share Analysis Model
        2. 13.3.3.2. Revenue Based Modeling
        3. 13.3.3.3. Research Limitations

  • List of Figures

    FIG. 1 Global Rubber Processing Chemicals Market, 2016-2026 (USD Billion)
    FIG. 2 Global Rubber Processing Chemicals Market Share, by Type, 2019 & 2026 (USD Billion)
    FIG. 3 Global Rubber Processing Chemicals Market share, by Type, 2019 & 2026 (Kilo Tons)
    FIG. 4 Global Flame retardants Rubber Processing Chemicals Market, 2016-2026 (USD Billion)
    FIG. 5 Global Flame retardants Rubber Processing Chemicals  Market, 2016-2026 (Kilo Tons)
    FIG. 6 Global Anti-degradants Rubber Processing Chemicals Market, 2016-2026 (USD Billion)
    FIG. 7 Global Anti-degradants Rubber Processing Chemicals  Market, 2016-2026 (Kilo Tons)
    FIG. 8 Global Processing Aid Rubber Processing Chemicals Market, 2016-2026 (USD Billion)
    FIG. 9 Global Processing Aid Rubber Processing Chemicals  Market, 2016-2026 (Kilo Tons)
    FIG. 10 Global Accelerators Rubber Processing Chemicals Market, 2016-2026 (USD Billion)
    FIG. 11 Global Accelerators Rubber Processing Chemicals  Market, 2016-2026 (Kilo Tons)
    FIG. 12 Global Rubber Processing Chemicals Market Share, by Application, 2019 & 2026 (USD Billion)
    FIG. 13 Global Rubber Processing Chemicals Market share, by Application, 2019 & 2026 (Kilo Tons)
    FIG. 14 Global Tire Rubber Processing Chemicals Market, 2016-2026 (USD Billion)
    FIG. 15 Global Tire Rubber Processing Chemicals  Market, 2016-2026 (Kilo Tons)
    FIG. 16 Global Non-tire Rubber Processing Chemicals Market, 2016-2026 (USD Billion)
    FIG. 17 Global Non-tire Rubber Processing Chemicals  Market, 2016-2026 (Kilo Tons)
    FIG. 18 Global Rubber Processing Chemicals Market Share, by Region, 2019 & 2026
    FIG. 19 Global Rubber Processing Chemicals Market Share, by Region, 2019 & 2026
    FIG. 20 North America Rubber Processing Chemicals Market, 2016-2026
    FIG. 21 North America Rubber Processing Chemicals  Market, 2016-2026 (Kilo Tons)
    FIG. 22 U.S. Rubber Processing Chemicals Market, 2016-2026
    FIG. 23 U.S. Rubber Processing Chemicals  Market, 2016-2026 (Kilo Tons)
    FIG. 24 Canada Rubber Processing Chemicals Market, 2016-2026
    FIG. 25 Canada Rubber Processing Chemicals  Market, 2016-2026 (Kilo Tons)
    FIG. 26 Europe Rubber Processing Chemicals Market, 2016-2026
    FIG. 27 Europe Rubber Processing Chemicals  Market, 2016-2026 (Kilo Tons)
    FIG. 28 Germany Rubber Processing Chemicals Market, 2016-2026
    FIG. 29 Germany Rubber Processing Chemicals  Market, 2016-2026 (Kilo Tons)
    FIG. 30 France Rubber Processing Chemicals Market, 2016-2026
    FIG. 31 France Rubber Processing Chemicals  Market, 2016-2026 (Kilo Tons)
    FIG. 32 U.K. Rubber Processing Chemicals Market, 2016-2026
    FIG. 33 U.K. Rubber Processing Chemicals  Market, 2016-2026 (Kilo Tons)
    FIG. 34 Italy Rubber Processing Chemicals Market, 2016-2026
    FIG. 35 Italy Rubber Processing Chemicals  Market, 2016-2026 (Kilo Tons)
    FIG. 36 Spain Rubber Processing Chemicals Market, 2016-2026
    FIG. 37 Spain Rubber Processing Chemicals  Market, 2016-2026 (Kilo Tons)
    FIG. 38 Rest of Europe Rubber Processing Chemicals Market, 2016-2026
    FIG. 39 Rest of Europe Rubber Processing Chemicals  Market, 2016-2026 (Kilo Tons)
    FIG. 40 Asia Pacific Rubber Processing Chemicals Market, 2016-2026
    FIG. 41 Asia Pacific Rubber Processing Chemicals  Market, 2016-2026 (Kilo Tons)
    FIG. 42 China Rubber Processing Chemicals Market, 2016-2026
    FIG. 43 China Rubber Processing Chemicals  Market, 2016-2026 (Kilo Tons)
    FIG. 44 Japan Rubber Processing Chemicals Market, 2016-2026
    FIG. 45 Japan Rubber Processing Chemicals  Market, 2016-2026 (Kilo Tons)
    FIG. 46 India Rubber Processing Chemicals Market, 2016-2026
    FIG. 47 India Rubber Processing Chemicals  Market, 2016-2026 (Kilo Tons)
    FIG. 48 South  Korea Rubber Processing Chemicals Market, 2016-2026
    FIG. 49 South  Korea Rubber Processing Chemicals  Market, 2016-2026 (Kilo Tons)
    FIG. 50 South-East Asia Rubber Processing Chemicals Market, 2016-2026
    FIG. 51 South-East Asia Rubber Processing Chemicals  Market, 2016-2026 (Kilo Tons)
    FIG. 52 Rest of Asia Pacific Rubber Processing Chemicals Market, 2016-2026
    FIG. 53 Rest of Asia Pacific Rubber Processing Chemicals  Market, 2016-2026 (Kilo Tons)
    FIG. 54 Latin America Rubber Processing Chemicals Market, 2016-2026
    FIG. 55 Latin America Rubber Processing Chemicals  Market, 2016-2026 (Kilo Tons)
    FIG. 56 Brazil Rubber Processing Chemicals Market, 2016-2026
    FIG. 57 Brazil Rubber Processing Chemicals  Market, 2016-2026 (Kilo Tons)
    FIG. 58 Mexico Rubber Processing Chemicals Market, 2016-2026
    FIG. 59 Mexico Rubber Processing Chemicals  Market, 2016-2026 (Kilo Tons)
    FIG. 60 Rest of Latin America Rubber Processing Chemicals Market, 2016-2026
    FIG. 61 Rest of Latin America Rubber Processing Chemicals  Market, 2016-2026 (Kilo Tons)
    FIG. 62 The Middle-East and Africa Rubber Processing Chemicals Market, 2016-2026
    FIG. 63 The Middle-East and Africa Rubber Processing Chemicals  Market, 2016-2026 (Kilo Tons)
    FIG. 64 GCC Countries Rubber Processing Chemicals Market, 2016-2026
    FIG. 65 GCC Countries Rubber Processing Chemicals  Market, 2016-2026 (Kilo Tons)
    FIG. 66 South Africa Rubber Processing Chemicals Market, 2016-2026
    FIG. 67 South Africa Rubber Processing Chemicals  Market, 2016-2026 (Kilo Tons)
    FIG. 68 Rest of Middle-East Africa Rubber Processing Chemicals Market, 2016-2026
    FIG. 69 Rest of Middle-East Africa Rubber Processing Chemicals  Market, 2016-2026 (Kilo Tons)
    FIG. 70 Global Rubber Processing Chemicals production and revenue, 2016-2026 (USD Billion) (Kilo Tons)
    FIG. 71 North America Rubber Processing Chemicals production and revenue, 2016-2026 (USD Billion) (Kilo Tons)
    FIG. 72 Europe Rubber Processing Chemicals production and revenue, 2016-2026 (USD Billion) (Kilo Tons)
    FIG. 73 Asia Pacific Rubber Processing Chemicals production and revenue, 2016-2026 (USD Billion) (Kilo Tons)
    FIG. 74 Latin America Rubber Processing Chemicals production and revenue, 2016-2026 (USD Billion) (Kilo Tons)
    FIG. 75 Middle East and Africa Rubber Processing Chemicals production and revenue, 2016-2026 (USD Billion) (Kilo Tons)
    FIG. 76 Competitor Market Share – Revenue
    FIG. 77 Competitor Market Share – Volume
    FIG. 78 LANXESS Corporation Revenue and Growth Rate
    FIG. 79 LANXESS Corporation Market Share
    FIG. 80 Solvay SA Revenue and Growth Rate
    FIG. 81 Solvay SA Market Share
    FIG. 82 Emerald Performance Materials Revenue and Growth Rate
    FIG. 83 Emerald Performance Materials Market Share
    FIG. 84 Chemtura Corporation Revenue and Growth Rate
    FIG. 85 Chemtura Corporation Market Share
    FIG. 86 China Petroleum & Chemical Corporation Revenue and Growth Rate
    FIG. 87 China Petroleum & Chemical Corporation Market Share
    FIG. 88 Behn Meyer Group Revenue and Growth Rate
    FIG. 89 Behn Meyer Group Market Share
    FIG. 90 R.T. Vanderbilt Company Revenue and Growth Rate
    FIG. 91 R.T. Vanderbilt Company Market Share
    FIG. 92 Eastman Chemical Company Revenue and Growth Rate
    FIG. 93 Eastman Chemical Company Market Share
    FIG. 94 Akzonobel N.V. Revenue and Growth Rate
    FIG. 95 Akzonobel N.V. Market Share
    FIG. 96 Emery Oleochemicals Llc Revenue and Growth Rate
    FIG. 97 Emery Oleochemicals Llc Market Share
    FIG. 98 Market Dynamics
    FIG. 99 Global Rubber Processing Chemicals – Value Chain Analysis
    FIG. 100 Key Mandates and Regulations
    FIG. 101 Technology Roadmap and Timeline
    FIG. 102 Market Attractiveness Analysis – By Type
    FIG. 103 Market Attractiveness Analysis – By Application
    FIG. 104 Market Attractiveness Analysis – By Region
    FIG. 105 Manufacturing Cost Structure of Rubber Processing Chemicals
    FIG. 106 Rubber Processing Chemicals Industrial Chain Analysis
    FIG. 107 Market Channel
    FIG. 108 Marketing Channel Development Trend
    FIG. 109 Growth in World Gross Product, 2008-2019

    List of Tables

    TABLE 1 Global Rubber Processing Chemicals market, 2019 & 2026 (USD Billion)
    TABLE 2 Global Rubber Processing Chemicals market, by Type, 2016-2026 (USD Billion)
    TABLE 3 Global Rubber Processing Chemicals market, by Type, 2016-2026 (Kilo Tons)
    TABLE 4 Global Rubber Processing Chemicals market, by Application, 2016-2026 (USD Billion)
    TABLE 5 Global Rubber Processing Chemicals market, by Application, 2016-2026 (Kilo Tons)
    TABLE 6 Global Rubber Processing Chemicals market, by region, 2016-2026 (USD Billion)
    TABLE 7 Global Rubber Processing Chemicals market, by region, 2016-2026 (Kilo Tons)
    TABLE 8 North America Rubber Processing Chemicals Market, by Type, 2016-2026 (USD Billion)
    TABLE 9 North America Rubber Processing Chemicals Market, by Type, 2016-2026 (Kilo Tons)
    TABLE 10 North America Rubber Processing Chemicals Market, by Application, 2016-2026 (USD Billion)
    TABLE 11 North America Rubber Processing Chemicals Market, by Application, 2016-2026 (Kilo Tons)
    TABLE 12 Europe Rubber Processing Chemicals Market, by Type, 2016-2026 (USD Billion)
    TABLE 13 Europe Rubber Processing Chemicals Market, by Type, 2016-2026 (Kilo Tons)
    TABLE 14 Europe Rubber Processing Chemicals Market, by Application, 2016-2026 (USD Billion)
    TABLE 15 Europe Rubber Processing Chemicals Market, by Application, 2016-2026 (Kilo Tons)
    TABLE 16 Asia Pacific Rubber Processing Chemicals Market, by Type, 2016-2026 (USD Billion)
    TABLE 17 Asia Pacific Rubber Processing Chemicals Market, by Type, 2016-2026 (Kilo Tons)
    TABLE 18 Asia Pacific Rubber Processing Chemicals Market, by Application, 2016-2026 (USD Billion)
    TABLE 19 Asia Pacific Rubber Processing Chemicals Market, by Application, 2016-2026 (Kilo Tons)
    TABLE 20 Latin America Rubber Processing Chemicals Market, by Type, 2016-2026 (USD Billion)
    TABLE 21 Latin America Rubber Processing Chemicals Market, by Type, 2016-2026 (Kilo Tons)
    TABLE 22 Latin America Rubber Processing Chemicals Market, by Application, 2016-2026 (USD Billion)
    TABLE 23 Latin America Rubber Processing Chemicals Market, by Application, 2016-2026 (Kilo Tons)
    TABLE 24 The Middle-East and Africa Rubber Processing Chemicals Market, by Type, 2016-2026 (USD Billion)
    TABLE 25 The Middle-East and Africa Rubber Processing Chemicals Market, by Type, 2016-2026 (Kilo Tons)
    TABLE 26 The Middle-East and Africa Rubber Processing Chemicals Market, by Application, 2016-2026 (USD Billion)
    TABLE 27 The Middle-East and Africa Rubber Processing Chemicals Market, by Application, 2016-2026 (Kilo Tons)
    TABLE 28 North America Rubber Processing Chemicals Production, Consumption, Export, Import, 2016-2019
    TABLE 29 Europe Rubber Processing Chemicals Production, Consumption, Export, Import, 2016-2019
    TABLE 30 Asia Pacific Rubber Processing Chemicals Production, Consumption, Export, Import, 2016-2019
    TABLE 31 Latin America Rubber Processing Chemicals Production, Consumption, Export, Import, 2016-2019
    TABLE 32 Middle East & Africa Rubber Processing Chemicals Production, Consumption, Export, Import, 2016-2019
    TABLE 33 Global Rubber Processing Chemicals Market - Company Revenue Analysis 2016-2019 (USD Billion)
    TABLE 34 Global Rubber Processing Chemicals Market - Company Revenue Share Analysis 2016-2019(%)
    TABLE 35 Global Rubber Processing Chemicals Market - Company Volume Analysis 2016-2019 (Kilo Tons)
    TABLE 36 Global Rubber Processing Chemicals Market - Company Volume Share Analysis 2016-2019(%)
    TABLE 37 Acquisitions and Mergers
    TABLE 38 New Product/Service Launch
    TABLE 39 Research & Development Activities
    TABLE 40 Market Drivers
    TABLE 41 Market Restraints
    TABLE 42 Market Opportunities
    TABLE 43 Production Base and Market Concentration Rate of Raw Material
    TABLE 44 Key Suppliers of Raw Materials
    TABLE 45 Raw Materials Sources of Rubber Processing Chemicals Major Manufacturers in 2016
    TABLE 46 Major Buyers of Rubber Processing Chemicals
    TABLE 47 Distributors/Traders of Rubber Processing Chemicals by Region
  •  

    Industry Major Market Players

    •  LANXESS Corporation
    •  Solvay SA
    •  Emerald Performance Materials
    •  Chemtura Corporation
    •  China Petroleum & Chemical Corporation
    •  Behn Meyer Group
    •  R.T. Vanderbilt Company
    •  Eastman Chemical Company
    •  Akzonobel N.V
    •  Emery OleochemicalsLlc