Search Market Research Report

Discover Our Latest Reports
Discover Our Featured Reports
Discover Top Selling Reports

Rolling Stock Market Size, Share Global Analysis Report, 2021 – 2026

report img

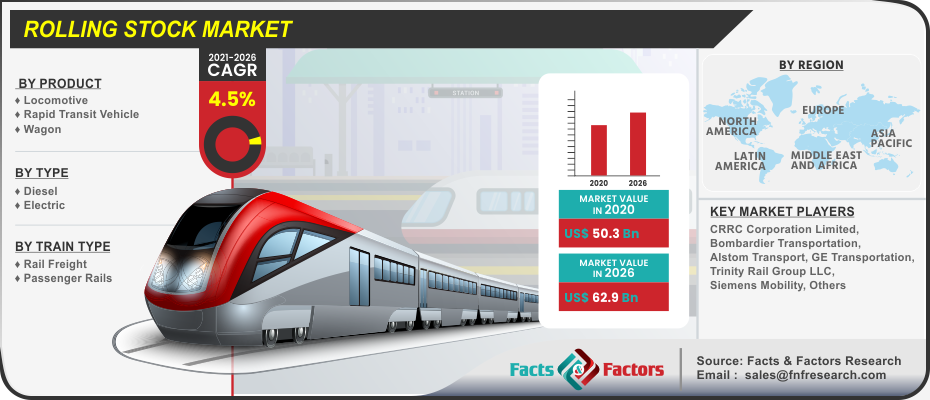
Rolling Stock Market By Product (Locomotive, Rapid Transit Vehicle, & Wagon), By Type (Diesel & Electric), By Train Type (Rail Freight & Passenger Rails), And By Regions - Global & Regional Industry Perspective, Comprehensive Analysis, and Forecast 2021 – 2026

Industry Insights

[189+ Pages Report] The latest finding surrounding the “Global Rolling Stock Market” published by Facts & Factors offers a neatly packaged and comprehensive read. In the current study, the global rolling stock market is estimated to reach a projected value of USD 62.9 Billion by 2026 with a growth rate of 4.5% CAGR from an initial value of USD 50.3 Billion in the year 2020.

logoMarket Overview

The term rolling stock in rail transport refers to both the powered and unpowered vehicles that include locomotives, freight and passenger cars, and non-revenue cars. Passengers cars are the most popular by far in this sector and are often powered and self-propelled and come in the form of single or multiple units. However, the term rolling stocks refer to wheeled vehicles that are often used by businesses on roadways as well as the previous definition to name a few.

logoIndustry Growth Factors

The global rolling stock market is expected to rise at an exceptional growth rate during the forecast period owing to increasing urbanization, rising demand for passenger transportation, increasing investment in rail infrastructure, and expansion of rail networks systems to name a few. Additionally, a rising number of metro-based projects coupled with a rapid rate of electrified network routes on a global purview is expected to increase the footprint of the global rolling stock market during the forecast period. Moreover, rising disposable income among consumers, insufficient lack of road networks in emerging countries, and rising road congestion measures will further boost the growth of the global rolling stock market during the advent of the forecast period.

The global rolling stock market is driven by increased integration of advanced maintenance coupled with rising usage of data analytics in rolling stock vehicles to name a few. Rising demand among users for assets availability measures coupled with increasing consolidation trends among the key market players will fuel the growth of the global rolling stock market during the advent of the forecast period. However, capital-intensive measures for raising infrastructure needs coupled with refurbishment and restoration of existing rolling stock projects will hamper the growth of the global rolling stock market during the advent of the forecast period.

Rolling Stock Market

To know more about this report | Request Free Sample Copy

logoSegmentation Analysis

The global rolling stock market is segmented into product, type, train type, and region.

On the basis of product, the global rolling stock market is divided into a locomotive, rapid transit vehicle, and wagon. The rapid transit vehicles segment is expected to witness the largest market share during the advent of the forecast period owing to higher speed transits routes coupled with enhanced comfortability measures to name a few. Additionally, the rising demand for automated trains and magnetic levitation trains among the extended users will further cement the growth of the latter segment during the forecast period. Based on type, the global rolling stock market is classified into diesel and electric. The segment pertaining to diesel vehicles is expected to occupy the largest market share during the advent of the forecast period owing to rising demand from oil and gas, mining, and manufacturing coupled with cost-effective measures to name a few. On the basis of train type, the global rolling stock market is bifurcated into rail freight and passenger rails. The segment pertaining to passenger rails is expected to witness the largest market share during the advent of the forecast period owing to rising demand from users in the form of trams, metros, and high-speed trains coupled with the implementation of GPS tracking systems and intelligent systems for improving the quality of the latter to name a few.

logo Report Scope

Report Attribute

Details

Market Size in 2020

USD 50.3 Billion

Projected Market Size in 2026

USD 62.9 Billion

CAGR Growth Rate

4.5% CAGR

Base Year

2020

Forecast Years

2021-2026

Key Market Players

CRRC Corporation Limited, Bombardier Transportation, Alstom Transport, GE Transportation, Trinity Rail Group LLC, Siemens Mobility,  Bombardier Transportation, Alstom Transport, GE Transportation, Trinity Rail Group LLC, Siemens Mobility, Stadler Rail AG, Hitachi Rail Systems, The Greenbrier Co., Hyundai Rotem, Kawasaki Heavy Industries, Wabtec Corporation, Transmashholding, and Trinity Industries Inc.,,  Others

Key Segments

Product, Type, Train Type, and Region

Major Regions Covered

North America, Europe, Asia Pacific, Latin America, and Middle East & Africa

Purchase Options

Request customized purchase options to meet your research needs. Explore purchase options

logo Regional Analysis

Asia-Pacific is expected to witness the largest market share during the advent of the forecast period owing to the large-scale adoption of rail vehicles in the region coupled with increasing investments in metro and electric trains to name a few. Additionally, a rising railway infrastructure-based network in the region coupled with an increasing innovative overview for the latter will increase the footprint of the rolling stock market during the forecast period.  Europe is expected to witness a substantial market share during the advent of the forecast period owing to capturing a larger portion of the market by Tier-1 suppliers in terms of rising collaborations coupled with rising R&D activities to name a few. Moreover, rising demand from the oil and gas industry and increasing instances of transporting oil from one place to another will boost the growth of the rolling stock market during the advent of the forecast period.

logo Competitive Players

The key market participants of the global rolling stock market are

  • CRRC Corporation Limited
  • Bombardier Transportation
  • Alstom Transport
  • GE Transportation
  • Trinity Rail Group LLC
  • Siemens Mobility
  • Stadler Rail AG
  • Hitachi Rail Systems
  • The Greenbrier Co.
  • Hyundai Rotem
  • Kawasaki Heavy Industries
  • Wabtec Corporation
  • Transmashholding
  • Trinity Industries Inc.

logo By Product Segment Analysis

  • Locomotive
  • Rapid Transit Vehicle
  • Wagon

logo By Type Segment Analysis

  • Diesel
  • Electric

logo By Train Type Segment Analysis

  • Rail Freight
  • Passenger Rails

logo By Regional Segment Analysis

  • North America
    • U.S.
    • Canada
  • Europe
    • UK
    • France
    • Germany
    • Italy
    • Spain
    • Rest of Europe
  • Asia Pacific
    • China
    • Japan
    • India
    • South Korea
    • Southeast Asia
    • Rest of Asia Pacific
  • Latin America
    • Brazil
    • Mexico
    • Rest of Latin America
  • Middle East and Africa
    • GCC Countries
    • South Africa
    • Rest of MEA

Table of Content

  1. Chapter 1 Executive Summary
    1. 1.1. Introduction of Rolling Stock
    2. 1.2. Global Rolling Stock Market, 2019 & 2026 (USD Billion)
    3. 1.3. Global Rolling Stock Market, 2016 – 2026 (USD Billion)
    4. 1.4. Global Rolling Stock Market Absolute Revenue Opportunity, 2016 – 2026 (USD Billion)
    5. 1.5. Global Rolling Stock Market Incremental Revenue Opportunity, 2020 – 2026 (USD Billion)
  2. Chapter 2 Rolling Stock Market – Product Analysis
    1. 2.1. Global Rolling Stock Market – Product Overview
    2. 2.2. Global Rolling Stock Market Share, by Product, 2019 & 2026 (USD Billion)
    3. 2.3. Locomotive
      1. 2.3.1. Global Locomotive Rolling Stock Market, 2016 – 2026 (USD Billion)
    4. 2.4. Rapid Transit Vehicle
      1. 2.4.1. Global Rapid Transit Vehicle Rolling Stock Market, 2016 – 2026 (USD Billion)
    5. 2.5. Wagon
      1. 2.5.1. Global Wagon Rolling Stock Market, 2016 – 2026 (USD Billion)
  3. Chapter 3 Rolling Stock Market – Type Analysis
    1. 3.1. Global Rolling Stock Market – Type Overview
    2. 3.2. Global Rolling Stock Market Share, by Type, 2019 & 2026 (USD Billion)
    3. 3.3. Diesel
      1. 3.3.1. Global Diesel Rolling Stock Market, 2016 – 2026 (USD Billion)
    4. 3.4. Electric
      1. 3.4.1. Global Electric Rolling Stock Market, 2016 – 2026 (USD Billion)
  4. Chapter 4 Rolling Stock Market – Train Type Analysis
    1. 4.1. Global Rolling Stock Market – Train Type Overview
    2. 4.2. Global Rolling Stock Market Share, by Train Type, 2019 & 2026 (USD Billion)
    3. 4.3. Rail Freight
      1. 4.3.1. Global Rail Freight Rolling Stock Market, 2016 – 2026 (USD Billion)
    4. 4.4. Passenger Rails
      1. 4.4.1. Global Passenger Rails Rolling Stock Market, 2016 – 2026 (USD Billion)
  5. Chapter 5 Rolling Stock Market – Regional Analysis
    1. 5.1. Global Rolling Stock Market Regional Overview
    2. 5.2. Global Rolling Stock Market Share, by Region, 2019 & 2026 (USD Billion)
    3. 5.3. North America
      1. 5.3.1. North America Rolling Stock Market, 2016 – 2026 (USD Billion)
        1. 5.3.1.1. North America Rolling Stock Market, by Country, 2016 - 2026 (USD Billion)
      2. 5.3.2. North America Rolling Stock Market, by Product, 2016 – 2026
        1. 5.3.2.1. North America Rolling Stock Market, by Product, 2016 – 2026 (USD Billion)
      3. 5.3.3. North America Rolling Stock Market, by Type, 2016 – 2026
        1. 5.3.3.1. North America Rolling Stock Market, by Type, 2016 – 2026 (USD Billion)
      4. 5.3.4. North America Rolling Stock Market, by Train Type, 2016 – 2026
        1. 5.3.4.1. North America Rolling Stock Market, by Train Type, 2016 – 2026 (USD Billion)
      5. 5.3.5. U.S.
        1. 5.3.5.1. U.S. Rolling Stock Market, 2016 – 2026 (USD Billion)
      6. 5.3.6. Canada
        1. 5.3.6.1. Canada Rolling Stock Market, 2016 – 2026 (USD Billion)
    4. 5.4. Europe
      1. 5.4.1. Europe Rolling Stock Market, 2016 – 2026 (USD Billion)
        1. 5.4.1.1. Europe Rolling Stock Market, by Country, 2016 - 2026 (USD Billion)
      2. 5.4.2. Europe Rolling Stock Market, by Product, 2016 – 2026
        1. 5.4.2.1. Europe Rolling Stock Market, by Product, 2016 – 2026 (USD Billion)
      3. 5.4.3. Europe Rolling Stock Market, by Type, 2016 – 2026
        1. 5.4.3.1. Europe Rolling Stock Market, by Type, 2016 – 2026 (USD Billion)
      4. 5.4.4. Europe Rolling Stock Market, by Train Type, 2016 – 2026
        1. 5.4.4.1. Europe Rolling Stock Market, by Train Type, 2016 – 2026 (USD Billion)
      5. 5.4.5. Germany
        1. 5.4.5.1. Germany Rolling Stock Market, 2016 – 2026 (USD Billion)
      6. 5.4.6. France
        1. 5.4.6.1. France Rolling Stock Market, 2016 – 2026 (USD Billion)
      7. 5.4.7. U.K.
        1. 5.4.7.1. U.K. Rolling Stock Market, 2016 – 2026 (USD Billion)
      8. 5.4.8. Italy
        1. 5.4.8.1. Italy Rolling Stock Market, 2016 – 2026 (USD Billion)
      9. 5.4.9. Spain
        1. 5.4.9.1. Spain Rolling Stock Market, 2016 – 2026 (USD Billion)
      10. 5.4.10. Rest of Europe
        1. 5.4.10.1. Rest of Europe Rolling Stock Market, 2016 – 2026 (USD Billion)
    5. 5.5. Asia Pacific
      1. 5.5.1. Asia Pacific Rolling Stock Market, 2016 – 2026 (USD Billion)
        1. 5.5.1.1. Asia Pacific Rolling Stock Market, by Country, 2016 - 2026 (USD Billion)
      2. 5.5.2. Asia Pacific Rolling Stock Market, by Product, 2016 – 2026
        1. 5.5.2.1. Asia Pacific Rolling Stock Market, by Product, 2016 – 2026 (USD Billion)
      3. 5.5.3. Asia Pacific Rolling Stock Market, by Type, 2016 – 2026
        1. 5.5.3.1. Asia Pacific Rolling Stock Market, by Type, 2016 – 2026 (USD Billion)
      4. 5.5.4. Asia Pacific Rolling Stock Market, by Train Type, 2016 – 2026
        1. 5.5.4.1. Asia Pacific Rolling Stock Market, by Train Type, 2016 – 2026 (USD Billion)
      5. 5.5.5. China
        1. 5.5.5.1. China Rolling Stock Market, 2016 – 2026 (USD Billion)
      6. 5.5.6. Japan
        1. 5.5.6.1. Japan Rolling Stock Market, 2016 – 2026 (USD Billion)
      7. 5.5.7. India
        1. 5.5.7.1. India Rolling Stock Market, 2016 – 2026 (USD Billion)
      8. 5.5.8. South Korea
        1. 5.5.8.1. South Korea Rolling Stock Market, 2016 – 2026 (USD Billion)
      9. 5.5.9. South-East Asia
        1. 5.5.9.1. South-East Asia Rolling Stock Market, 2016 – 2026 (USD Billion)
      10. 5.5.10. Rest of Asia Pacific
        1. 5.5.10.1. Rest of Asia Pacific Rolling Stock Market, 2016 – 2026 (USD Billion)
    6. 5.6. Latin America
      1. 5.6.1. Latin America Rolling Stock Market, 2016 – 2026 (USD Billion)
        1. 5.6.1.1. Latin America Rolling Stock Market, by Country, 2016 - 2026 (USD Billion)
      2. 5.6.2. Latin America Rolling Stock Market, by Product, 2016 – 2026
        1. 5.6.2.1. Latin America Rolling Stock Market, by Product, 2016 – 2026 (USD Billion)
      3. 5.6.3. Latin America Rolling Stock Market, by Type, 2016 – 2026
        1. 5.6.3.1. Latin America Rolling Stock Market, by Type, 2016 – 2026 (USD Billion)
      4. 5.6.4. Latin America Rolling Stock Market, by Train Type, 2016 – 2026
        1. 5.6.4.1. Latin America Rolling Stock Market, by Train Type, 2016 – 2026 (USD Billion)
      5. 5.6.5. Brazil
        1. 5.6.5.1. Brazil Rolling Stock Market, 2016 – 2026 (USD Billion)
      6. 5.6.6. Mexico
        1. 5.6.6.1. Mexico Rolling Stock Market, 2016 – 2026 (USD Billion)
      7. 5.6.7. Rest of Latin America
        1. 5.6.7.1. Rest of Latin America Rolling Stock Market, 2016 – 2026 (USD Billion)
    7. 5.7. The Middle-East and Africa
      1. 5.7.1. The Middle-East and Africa Rolling Stock Market, 2016 – 2026 (USD Billion)
        1. 5.7.1.1. The Middle-East and Africa Rolling Stock Market, by Country, 2016 - 2026 (USD Billion)
      2. 5.7.2. The Middle-East and Africa Rolling Stock Market, by Product, 2016 – 2026
        1. 5.7.2.1. The Middle-East and Africa Rolling Stock Market, by Product, 2016 – 2026 (USD Billion)
      3. 5.7.3. The Middle-East and Africa Rolling Stock Market, by Type, 2016 – 2026
        1. 5.7.3.1. The Middle-East and Africa Rolling Stock Market, by Type, 2016 – 2026 (USD Billion)
      4. 5.7.4. The Middle-East and Africa Rolling Stock Market, by Train Type, 2016 – 2026
        1. 5.7.4.1. The Middle-East and Africa Rolling Stock Market, by Train Type, 2016 – 2026 (USD Billion)
      5. 5.7.5. GCC Countries
        1. 5.7.5.1. GCC Countries Rolling Stock Market, 2016 – 2026 (USD Billion)
      6. 5.7.6. South Africa
        1. 5.7.6.1. South Africa Rolling Stock Market, 2016 – 2026 (USD Billion)
      7. 5.7.7. Rest of Middle-East Africa
        1. 5.7.7.1. Rest of Middle-East Africa Rolling Stock Market, 2016 – 2026 (USD Billion)
  6. Chapter 6 Rolling Stock Market – Competitive Landscape
    1. 6.1. Competitor Market Share – Revenue
    2. 6.2. Market Concentration Rate Analysis, Top 3 and Top 5 Players
    3. 6.3. Strategic Developments
      1. 6.3.1. Acquisitions and Mergers
      2. 6.3.2. New Products
      3. 6.3.3. Research & Development Activities
  7. Chapter 7 Company Profiles
    1. 7.1. CRRC Corporation Limited
      1. 7.1.1. Company Overview
      2. 7.1.2. Product/Service Portfolio
      3. 7.1.3. CRRC Corporation Limited Sales, Revenue, and Gross Margin
      4. 7.1.4. CRRC Corporation Limited Revenue and Growth Rate
      5. 7.1.5. CRRC Corporation Limited Market Share
      6. 7.1.6. Recent Initiatives, Funding/VC Activities, and Technological Innovations
    2. 7.2. Bombardier Transportation
      1. 7.2.1. Company Overview
      2. 7.2.2. Product/Service Portfolio
      3. 7.2.3. Bombardier Transportation Sales, Revenue, and Gross Margin
      4. 7.2.4. Bombardier Transportation Revenue and Growth Rate
      5. 7.2.5. Bombardier Transportation Market Share
      6. 7.2.6. Recent Initiatives, Funding/VC Activities, and Technological Innovations
    3. 7.3. Alstom Transport
      1. 7.3.1. Company Overview
      2. 7.3.2. Product/Service Portfolio
      3. 7.3.3. Alstom Transport Sales, Revenue, and Gross Margin
      4. 7.3.4. Alstom Transport Revenue and Growth Rate
      5. 7.3.5. Alstom Transport Market Share
      6. 7.3.6. Recent Initiatives, Funding/VC Activities, and Technological Innovations
    4. 7.4. GE Transportation
      1. 7.4.1. Company Overview
      2. 7.4.2. Product/Service Portfolio
      3. 7.4.3. GE Transportation Sales, Revenue, and Gross Margin
      4. 7.4.4. GE Transportation Revenue and Growth Rate
      5. 7.4.5. GE Transportation Market Share
      6. 7.4.6. Recent Initiatives, Funding/VC Activities, and Technological Innovations
    5. 7.5. Trinity Rail Group LLC
      1. 7.5.1. Company Overview
      2. 7.5.2. Product/Service Portfolio
      3. 7.5.3. Trinity Rail Group LLC Sales, Revenue, and Gross Margin
      4. 7.5.4. Trinity Rail Group LLC Revenue and Growth Rate
      5. 7.5.5. Trinity Rail Group LLC Market Share
      6. 7.5.6. Recent Initiatives, Funding/VC Activities, and Technological Innovations
    6. 7.6. Siemens Mobility
      1. 7.6.1. Company Overview
      2. 7.6.2. Product/Service Portfolio
      3. 7.6.3. Siemens Mobility Sales, Revenue, and Gross Margin
      4. 7.6.4. Siemens Mobility Revenue and Growth Rate
      5. 7.6.5. Siemens Mobility Market Share
      6. 7.6.6. Recent Initiatives, Funding/VC Activities, and Technological Innovations
    7. 7.7. Stadler Rail AG
      1. 7.7.1. Company Overview
      2. 7.7.2. Product/Service Portfolio
      3. 7.7.3. Stadler Rail AG Sales, Revenue, and Gross Margin
      4. 7.7.4. Stadler Rail AG Revenue and Growth Rate
      5. 7.7.5. Stadler Rail AG Market Share
      6. 7.7.6. Recent Initiatives, Funding/VC Activities, and Technological Innovations
    8. 7.8. Hitachi Rail Systems
      1. 7.8.1. Company Overview
      2. 7.8.2. Product/Service Portfolio
      3. 7.8.3. Hitachi Rail Systems Sales, Revenue, and Gross Margin
      4. 7.8.4. Hitachi Rail Systems Revenue and Growth Rate
      5. 7.8.5. Hitachi Rail Systems Market Share
      6. 7.8.6. Recent Initiatives, Funding/VC Activities, and Technological Innovations
    9. 7.9. The Greenbrier Co
      1. 7.9.1. Company Overview
      2. 7.9.2. Product/Service Portfolio
      3. 7.9.3. The Greenbrier Co Sales, Revenue, and Gross Margin
      4. 7.9.4. The Greenbrier Co Revenue and Growth Rate
      5. 7.9.5. The Greenbrier Co Market Share
      6. 7.9.6. Recent Initiatives, Funding/VC Activities, and Technological Innovations
    10. 7.10. Hyundai Rotem
      1. 7.10.1. Company Overview
      2. 7.10.2. Product/Service Portfolio
      3. 7.10.3. Hyundai Rotem Sales, Revenue, and Gross Margin
      4. 7.10.4. Hyundai Rotem Revenue and Growth Rate
      5. 7.10.5. Hyundai Rotem Market Share
      6. 7.10.6. Recent Initiatives, Funding/VC Activities, and Technological Innovations
    11. 7.11. Kawasaki Heavy Industries
      1. 7.11.1. Company Overview
      2. 7.11.2. Product/Service Portfolio
      3. 7.11.3. Kawasaki Heavy Industries Sales, Revenue, and Gross Margin
      4. 7.11.4. Kawasaki Heavy Industries Revenue and Growth Rate
      5. 7.11.5. Kawasaki Heavy Industries Market Share
      6. 7.11.6. Recent Initiatives, Funding/VC Activities, and Technological Innovations
    12. 7.12. Wabtec Corporation
      1. 7.12.1. Company Overview
      2. 7.12.2. Product/Service Portfolio
      3. 7.12.3. Wabtec Corporation Sales, Revenue, and Gross Margin
      4. 7.12.4. Wabtec Corporation Revenue and Growth Rate
      5. 7.12.5. Wabtec Corporation Market Share
      6. 7.12.6. Recent Initiatives, Funding/VC Activities, and Technological Innovations
    13. 7.13. Transmashholding
      1. 7.13.1. Company Overview
      2. 7.13.2. Product/Service Portfolio
      3. 7.13.3. Transmashholding Sales, Revenue, and Gross Margin
      4. 7.13.4. Transmashholding Revenue and Growth Rate
      5. 7.13.5. Transmashholding Market Share
      6. 7.13.6. Recent Initiatives, Funding/VC Activities, and Technological Innovations
    14. 7.14. Trinity Industries Inc
      1. 7.14.1. Company Overview
      2. 7.14.2. Product/Service Portfolio
      3. 7.14.3. Trinity Industries Inc Sales, Revenue, and Gross Margin
      4. 7.14.4. Trinity Industries Inc Revenue and Growth Rate
      5. 7.14.5. Trinity Industries Inc Market Share
      6. 7.14.6. Recent Initiatives, Funding/VC Activities, and Technological Innovations
  8. Chapter 8 Rolling Stock — Industry Analysis
    1. 8.1. Introduction and Taxonomy
    2. 8.2. Rolling Stock Market – Key Trends
      1. 8.2.1. Market Drivers
      2. 8.2.2. Market Restraints
      3. 8.2.3. Market Opportunities
    3. 8.3. Value Chain Analysis
    4. 8.4. Key Mandates and Regulations
    5. 8.5. Technology Roadmap and Timeline
    6. 8.6. Rolling Stock Market – Attractiveness Analysis
      1. 8.6.1. By Product
      2. 8.6.2. By Type
      3. 8.6.3. By Train Type
      4. 8.6.4. By Region
  9. Chapter 9 Industrial Chain, Sourcing Strategy, and Downstream Buyers
    1. 9.1. Rolling Stock Industrial Chain Analysis
    2. 9.2. Downstream Buyers
    3. 9.3. Distributors/Traders List
  10. Chapter 10 Marketing Strategy Analysis
    1. 10.1. Marketing Channel
    2. 10.2. Direct Marketing
    3. 10.3. Indirect Marketing
    4. 10.4. Marketing Channel Development Trends
    5. 10.5. Economic/Political Environmental Change
  11. Chapter 11 Report Conclusion & Key Insights
    1. 11.1. Key Insights from Primary Interviews & Surveys Respondents
    2. 11.2. Key Takeaways from Analysts, Consultants, and Industry Leaders
  12. Chapter 12 Research Approach & Methodology
    1. 12.1. Report Description
    2. 12.2. Research Scope
    3. 12.3. Research Methodology
      1. 12.3.1. Secondary Research
      2. 12.3.2. Primary Research
      3. 12.3.3. Statistical Models
        1. 12.3.3.1. Company Share Analysis Model
        2. 12.3.3.2. Revenue Based Modeling
      4. 12.3.4. Research Limitations

      List of Figures

      Fig.1	Product Picture of Rolling Stock
      Fig.2	Global Rolling Stock Market, 2016 – 2026 (USD Billion)
      Fig.3	Global Rolling Stock Market Absolute Revenue Opportunity, 2016 – 2026 (USD Billion)
      Fig.4	Global Rolling Stock Market Incremental Revenue Opportunity, 2020 – 2026 (USD Billion)
      Fig.5	Global Rolling Stock Market Share, by Product, 2019 & 2026 (USD Billion)
      Fig.6	Global Locomotive Rolling Stock Market, 2016 – 2026 (USD Billion)
      Fig.7	Global Rapid Transit Vehicle Rolling Stock Market, 2016 – 2026 (USD Billion)
      Fig.8	Global Wagon Rolling Stock Market, 2016 – 2026 (USD Billion)
      Fig.9	Global Rolling Stock Market Share, by Type, 2019 & 2026 (USD Billion)
      Fig.10	Global Diesel  Rolling Stock Market, 2016 – 2026 (USD Billion)
      Fig.11	Global Electric Rolling Stock Market, 2016 – 2026 (USD Billion)
      Fig.12	Global Rolling Stock Market Share, by Train Type, 2019 & 2026 (USD Billion)
      Fig.13	Global Rail Freight  Rolling Stock Market, 2016 – 2026 (USD Billion)
      Fig.14	Global Passenger Rails Rolling Stock Market, 2016 – 2026 (USD Billion)
      Fig.15	Global Rolling Stock Market Share, by Region, 2019 & 2026 (USD Billion)
      Fig.16	North America Rolling Stock Market, 2016 – 2026 (USD Billion)
      Fig.17	U.S. Rolling Stock Market, 2016 – 2026 (USD Billion)
      Fig.18	Canada Rolling Stock Market, 2016 – 2026 (USD Billion)
      Fig.19	Europe Rolling Stock Market, 2016 – 2026 (USD Billion)
      Fig.20	Germany Rolling Stock Market, 2016 – 2026 (USD Billion)
      Fig.21	France Rolling Stock Market, 2016 – 2026 (USD Billion)
      Fig.22	U.K. Rolling Stock Market, 2016 – 2026 (USD Billion)
      Fig.23	Italy Rolling Stock Market, 2016 – 2026 (USD Billion)
      Fig.24	Spain Rolling Stock Market, 2016 – 2026 (USD Billion)
      Fig.25	Rest of Europe Rolling Stock Market, 2016 – 2026 (USD Billion)
      Fig.26	Asia Pacific Rolling Stock Market, 2016 – 2026 (USD Billion)
      Fig.27	China Rolling Stock Market, 2016 – 2026 (USD Billion)
      Fig.28	Japan Rolling Stock Market, 2016 – 2026 (USD Billion)
      Fig.29	India Rolling Stock Market, 2016 – 2026 (USD Billion)
      Fig.30	South  Korea Rolling Stock Market, 2016 – 2026 (USD Billion)
      Fig.31	South-East Asia Rolling Stock Market, 2016 – 2026 (USD Billion)
      Fig.32	Rest of Asia Pacific Rolling Stock Market, 2016 – 2026 (USD Billion)
      Fig.33	Latin America Rolling Stock Market, 2016 – 2026 (USD Billion)
      Fig.34	Brazil Rolling Stock Market, 2016 – 2026 (USD Billion)
      Fig.35	Mexico Rolling Stock Market, 2016 – 2026 (USD Billion)
      Fig.36	Rest of Latin America Rolling Stock Market, 2016 – 2026 (USD Billion)
      Fig.37	The Middle-East and Africa Rolling Stock Market, 2016 – 2026 (USD Billion)
      Fig.38	GCC Countries Rolling Stock Market, 2016 – 2026 (USD Billion)
      Fig.39	South Africa Rolling Stock Market, 2016 – 2026 (USD Billion)
      Fig.40	Rest of Middle-East Africa Rolling Stock Market, 2016 – 2026 (USD Billion)
      Fig.41	Competitor Market Share – Revenue
      Fig.42	CRRC Corporation Limited Revenue and Growth Rate
      Fig.43	CRRC Corporation Limited Market Share
      Fig.44	Bombardier Transportation Revenue and Growth Rate
      Fig.45	Bombardier Transportation Market Share
      Fig.46	Alstom Transport Revenue and Growth Rate
      Fig.47	Alstom Transport Market Share
      Fig.48	GE Transportation Revenue and Growth Rate
      Fig.49	GE Transportation Market Share
      Fig.50	Trinity Rail Group LLC Revenue and Growth Rate
      Fig.51	Trinity Rail Group LLC Market Share
      Fig.52	Siemens Mobility Revenue and Growth Rate
      Fig.53	Siemens Mobility Market Share
      Fig.54	Stadler Rail AG Revenue and Growth Rate
      Fig.55	Stadler Rail AG Market Share
      Fig.56	Hitachi Rail Systems Revenue and Growth Rate
      Fig.57	Hitachi Rail Systems Market Share
      Fig.58	The Greenbrier Co Revenue and Growth Rate
      Fig.59	The Greenbrier Co Market Share
      Fig.60	Hyundai Rotem Revenue and Growth Rate
      Fig.61	Hyundai Rotem Market Share
      Fig.62	Kawasaki Heavy Industries Revenue and Growth Rate
      Fig.63	Kawasaki Heavy Industries Market Share
      Fig.64	Wabtec Corporation Revenue and Growth Rate
      Fig.65	Wabtec Corporation Market Share
      Fig.66	Transmashholding Revenue and Growth Rate
      Fig.67	Transmashholding Market Share
      Fig.68	Trinity Industries Inc Revenue and Growth Rate
      Fig.69	Trinity Industries Inc Market Share
      Fig.70	Market Dynamics
      Fig.71	Global Rolling Stock – Value Chain Analysis
      Fig.72	Key Mandates and Regulations
      Fig.73	Technology Roadmap and Timeline
      Fig.74	Market Attractiveness Analysis – By Product
      Fig.75	Market Attractiveness Analysis – By Type
      Fig.76	Market Attractiveness Analysis – By Train Type
      Fig.77	Market Attractiveness Analysis – By Region
      Fig.78	Rolling Stock Industrial Chain Analysis
      Fig.79	Market Channels
      Fig.80	Marketing Channel Development Trend
      Fig.81	Growth in World Gross Product, 2008-2018
      

      List of Tables

      Table 1	Global Rolling Stock Market, 2019 & 2026 (USD Billion)
      Table 2	Global Rolling Stock Market, by Product, 2016 – 2026 (USD Billion)
      Table 3	Global Rolling Stock Market, by Type, 2016 – 2026 (USD Billion)
      Table 4	Global Rolling Stock Market, by Train Type, 2016 – 2026 (USD Billion)
      Table 5	Global Rolling Stock Market, by Region, 2016 – 2026 (USD Billion)
      Table 6	North America Rolling Stock Market, by Country, 2016 – 2026 (USD Billion)
      Table 7	North America Rolling Stock Market, by Product, 2016 – 2026 (USD Billion)
      Table 8	North America Rolling Stock Market, by Type, 2016 – 2026 (USD Billion)
      Table 9	North America Rolling Stock Market, by Train Type, 2016 – 2026 (USD Billion)
      Table 10 Europe Rolling Stock Market, by Country, 2016 – 2026 (USD Billion)
      Table 11 Europe Rolling Stock Market, by Product, 2016 – 2026 (USD Billion)
      Table 12 Europe Rolling Stock Market, by Type, 2016 – 2026 (USD Billion)
      Table 13 Europe Rolling Stock Market, by Train Type, 2016 – 2026 (USD Billion)
      Table 14 Asia Pacific Rolling Stock Market, by Country, 2016 – 2026 (USD Billion)
      Table 15 Asia Pacific Rolling Stock Market, by Product, 2016 – 2026 (USD Billion)
      Table 16 Asia Pacific Rolling Stock Market, by Type, 2016 – 2026 (USD Billion)
      Table 17 Asia Pacific Rolling Stock Market, by Train Type, 2016 – 2026 (USD Billion)
      Table 18 Latin America Rolling Stock Market, by Country, 2016 – 2026 (USD Billion)
      Table 19 Latin America Rolling Stock Market, by Product, 2016 – 2026 (USD Billion)
      Table 20 Latin America Rolling Stock Market, by Type, 2016 – 2026 (USD Billion)
      Table 21 Latin America Rolling Stock Market, by Train Type, 2016 – 2026 (USD Billion)
      Table 22 The Middle-East and Africa Rolling Stock Market, by Country, 2016 – 2026 (USD Billion)
      Table 23 The Middle-East and Africa Rolling Stock Market, by Product, 2016 – 2026 (USD Billion)
      Table 24 The Middle-East and Africa Rolling Stock Market, by Type, 2016 – 2026 (USD Billion)
      Table 25 The Middle-East and Africa Rolling Stock Market, by Train Type, 2016 – 2026 (USD Billion)
      Table 26 Global Rolling Stock Market - Company Revenue Analysis, 2016 – 2019 (USD Billion)
      Table 27 Global Rolling Stock Market - Company Revenue Share Analysis, 2016 – 2019 (%)
      Table 28 Acquisitions and Mergers
      Table 29 Market Drivers – Impact Analysis
      Table 30 Market Restraints
      Table 31 Market Opportunities
      Table 32 Major Buyers of Rolling Stock
      Table 33 Distributors/Traders of Rolling Stock by Region
      

Industry Major Market Players

  • CRRC Corporation Limited
  • Bombardier Transportation
  • Alstom Transport
  • GE Transportation
  • Trinity Rail Group LLC
  • Siemens Mobility
  • Stadler Rail AG
  • Hitachi Rail Systems
  • The Greenbrier Co.
  • Hyundai Rotem
  • Kawasaki Heavy Industries
  • Wabtec Corporation
  • Transmashholding
  • Trinity Industries Inc.