Search Market Research Report

Discover Our Latest Reports
Discover Our Featured Reports
Discover Top Selling Reports

RNAi for the Therapeutics Market Size, Share Global Analysis Report, 2019 – 2026

report img

RNAi for the Therapeutics Market by Type (siRNA, miRNA, and shRNA), and By Sales Channel (Direct & Distributor) for Cancer, Ocular Disorder, HBV and Others: Global Industry Perspective, Comprehensive Analysis and Forecast 2019 – 2026

Industry Insights

The report encompasses the forecast as well as an analysis of the RNAi for the Therapeutics market on the global and regional levels. The study displays historical data from 2016 to 2019 along with a forecast from 2020 to 2026 based on revenue (USD Million). Additionally, the market growth drivers, opportunities, limitations, and trends are also included in the RNAi for Therapeutic market report. 

We have included industry analysis models in our report and extensively demonstrated the key business strategies and competitive landscape of the RNAi for the Therapeutics market in our study.

RNAi for the Therapeutics Market Size

To know more about this report | Request Free Sample Copy


logoKey Insights from Primary Research

  • As per our primary respondents, the China RNAi for the Therapeutic market is around USD 27Million in 2018
  • It was established through primary research that the EuropeRNAi for Therapeutics market was valued at more than USD 70million in 2019
  • The siRNA, on the basis of product type, was the leading revenue-generating category accounting for more than two-thirds of the total market, in 2019.

logoKey Recommendations from Analysts

  • As per our analysis, siRNA for Therapeutic is an attractive segment for the RNAi Therapeutics market. The product has a high demand for Cancer Therapy
  • Growing at a CAGR of around 18.91%, Asia PacificRNAi for Therapeutic market accounts for numerous opportunities for all of the investors
  • Our analysts have identified, maximum patients of Cancers are being treated by using RNAi techniques.

logoGlobal Bone Void Filler Market Analysis: By Region

RNAi for the Therapeutics Market

To know more about this report | Request Free Sample Copy


Our study also includes an analysis of Porter’s Five Forces framework for understanding the competitive strategies used by market competitors. It also encompasses PESTLE analysis and SWOT analysis.

The report also offers an in-depth analysis of the market share of each industry player and gives an outline of the market position of key players in the RNAi for the Therapeutics market. Moreover, the study offers wide coverage of key strategic improvements witnessed in the market such as acquisitions & mergers, new product launches, agreements, partnerships, collaborations & joint ventures, R&D activities, and geographical expansion of key players of the RNAi for the Therapeutics market.

The study provides a decisive view of the RNAi for the Therapeutics market by segmenting the RNAi for the Therapeutics market based on type, sales channel, application, and region. All the segments have been analyzed based on present and future trends and the market is estimated from 2020 to 2026. The regional segmentation includes the current and forecast demand for North America, Europe, Asia Pacific, Latin America, and the Middle East and Africa.

The global RNAi for the Therapeutics market is experiencing vibrant growth that is expected to continue over the upcoming years. Cancer associated with the Geriatric population across the world is likely to act as a key driver of the global RNAi for the Therapeutics market.

The RNAi for the Therapeutics market is segmented based on type, application, and region. Type-wise, the market is classified into siRNA, miRNA, and shRNA. In terms of application, the market segment is sectored into Cancer, Ocular Disorders, HBV, and Others.

logoReport Scope

Report Attribute

Details

Market Size in 2019

USD 27 Million

Projected Market Size in 2026

USD 70 million

CAGR Growth Rate

18.91% CAGR

Base Year

2019

Forecast Years

2020-2026

Key Market Players

Alnylam Pharmaceuticals, Arrowhead, Dicerna Pharmaceuticals, Quark Pharmaceuticals, RXi Pharmaceuticals, miRagen Therapeutics, Gradalis, Sirnaomics, and Others

Key Segment

By Type, By Application, By Distribution, By Region

Major Regions Covered

North America, Europe, Asia Pacific, Latin America, and the Middle East & Africa

Purchase Options

Request customized purchase options to meet your research needs. Explore purchase options

This report segments the global RNAi for the Therapeutics market as follows:

logoMajor Key market players are

  • Alnylam Pharmaceuticals
  • Arrowhead
  • Dicerna Pharmaceuticals
  • Quark Pharmaceuticals
  • RXi Pharmaceuticals
  • miRagen Therapeutics
  • Gradalis
  • Sirnaomics 

logo Type Analysis

  • siRNA
  • miRNA
  • shRNA

logo Application Analysis

  • Cancer
  • Ocular Disorder
  • HBV
  • Others

logo Distribution Analysis

  • Direct Channel
  • Distributor Channel

logo Regional Analysis

  • North America
    • U.S
    • Canada
  • Europe
    • Germany
    • France
    • The U.K.
    • Italy
    • Spain
    • Rest of Europe
  • Asia Pacific
    • China
    • Japan
    • India
    • South Korea
    • South-East Asia
    • Rest of Asia pacific
  • Latin America
    • Brazil
    • Mexico
    • Rest of Latin America
  • The Middle East and Africa
    • GCC Countries
    • South Africa
    • Rest of the Middle East & Africa

logoKey Pointers Addressed by the Report

  • Historical data and forecast analysis of the market
  • Drivers and Restraints affecting market dynamics
  • Exhaustive analysis of the future market trends
  • Comprehensive information about the leading market segments and region
  • Strategic developments made by the competitive players and in-depth analysis of its impact on market growth

Table of Content

  1. CHAPTER 1. Executive Summary
  2. CHAPTER 2. RNAi for Therapeutic market – Product Analysis
    1. 2.1. Global RNAi for Therapeutic Market – Product Overview
    2. 2.2. Global RNAi for Therapeutic Market Share, by Product , 2016 & 2026 (USD Million)
    3. 2.3. Global RNAi for Therapeutic Market share, by Product , 2016 & 2026 (K Unit)
    4. 2.4. siRNA
      1. 2.4.1. Global siRNA RNAi for Therapeutic Market, 2016-2026 (USD Million)
      2. 2.4.2. Global siRNA RNAi for Therapeutic Market, 2016-2026 (K Unit)
    5. 2.5. miRNA
      1. 2.5.1. Global miRNA RNAi for Therapeutic Market, 2016-2026 (USD Million)
      2. 2.5.2. Global miRNA RNAi for Therapeutic Market, 2016-2026 (K Unit)
    6. 2.6. shRNA
      1. 2.6.1. Global shRNA RNAi for Therapeutic Market, 2016-2026 (USD Million)
      2. 2.6.2. Global shRNA RNAi for Therapeutic Market, 2016-2026 (K Unit)
  3. CHAPTER 3. RNAi for Therapeutic market – Application Analysis
    1. 3.1. Global RNAi for Therapeutic Market – Application Overview
    2. 3.2. Global RNAi for Therapeutic Market Share, by Application, 2016 & 2026 (USD Million)
    3. 3.3. Global RNAi for Therapeutic Market share, by Application, 2016 & 2026 (K Unit)
    4. 3.4. Cancer
      1. 3.4.1. Global Cancer RNAi for Therapeutic Market, 2016-2026 (USD Million)
      2. 3.4.2. Global Cancer RNAi for Therapeutic Market, 2016-2026 (K Unit)
    5. 3.5. Ocular Disorder
      1. 3.5.1. Global Ocular Disorder RNAi for Therapeutic Market, 2016-2026 (USD Million)
      2. 3.5.2. Global Ocular Disorder RNAi for Therapeutic Market, 2016-2026 (K Unit)
    6. 3.6. HBV
      1. 3.6.1. Global HBV RNAi for Therapeutic Market, 2016-2026 (USD Million)
      2. 3.6.2. Global HBV RNAi for Therapeutic Market, 2016-2026 (K Unit)
    7. 3.7. Others
      1. 3.7.1. Global Others RNAi for Therapeutic Market, 2016-2026 (USD Million)
      2. 3.7.2. Global Others RNAi for Therapeutic Market, 2016-2026 (K Unit)
  4. CHAPTER 4. RNAi for Therapeutic market – Sales Channel Analysis
    1. 4.1. Global RNAi for Therapeutic Market – Sales Channel Overview
    2. 4.2. Global RNAi for Therapeutic Market Share, by Sales Channel, 2016 & 2026 (USD Million)
    3. 4.3. Global RNAi for Therapeutic Market share, by Sales Channel, 2016 & 2026 (K Unit)
    4. 4.4. Direct Channel
      1. 4.4.1. Global Direct Channel RNAi for Therapeutic Market, 2016-2026 (USD Million)
      2. 4.4.2. Global Direct Channel RNAi for Therapeutic Market, 2016-2026 (K Unit)
    5. 4.5. Distribution Channel
      1. 4.5.1. Global Distribution Channel RNAi for Therapeutic Market, 2016-2026 (USD Million)
      2. 4.5.2. Global Distribution Channel RNAi for Therapeutic Market, 2016-2026 (K Unit)
  5. CHAPTER 5. RNAi for Therapeutic market – Regional Analysis
    1. 5.1. Global RNAi for Therapeutic Market Regional Overview
    2. 5.2. Global RNAi for Therapeutic Market Share, by Region, 2016 & 2026 (Value)
    3. 5.3. Global RNAi for Therapeutic Market Share, by Region, 2016 & 2026 (Volume)
    4. 5.4. North America
      1. 5.4.1. North America RNAi for Therapeutic Market size and forecast, 2016-2026
      2. 5.4.2. North America RNAi for Therapeutic Market, by Country, 2018 - 2025 (USD Million)
      3. 5.4.3. North America Market size and forecast, 2016-2026 (K Unit)
      4. 5.4.4. North America RNAi for Therapeutic Market, by Country, 2018 - 2025 (K Unit)
      5. 5.4.5. North America RNAi for Therapeutic Market, by Product , 2016-2026
        1. 5.4.5.1. North America RNAi for Therapeutic Market, by Product , 2016-2026 (USD Million)
        2. 5.4.5.2. North America RNAi for Therapeutic Market, by Product , 2016-2026 (K Unit)
      6. 5.4.6. North America RNAi for Therapeutic Market, by Application, 2016-2026
        1. 5.4.6.1. North America RNAi for Therapeutic Market, by Application, 2016-2026 (USD Million)
        2. 5.4.6.2. North America RNAi for Therapeutic Market, by Application, 2016-2026 (K Unit)
      7. 5.4.7. North America RNAi for Therapeutic Market, by Sales Channel, 2016-2026
        1. 5.4.7.1. North America RNAi for Therapeutic Market, by Sales Channel, 2016-2026 (USD Million)
        2. 5.4.7.2. North America RNAi for Therapeutic Market, by Sales Channel, 2016-2026 (K Unit)
      8. 5.4.8. U.S.
        1. 5.4.8.1. U.S. Market size and forecast, 2016-2026 (USD Million)
        2. 5.4.8.2. U.S. Market size and forecast, 2016-2026 (K Unit)
      9. 5.4.9. Canada
        1. 5.4.9.1. Canada Market size and forecast, 2016-2026 (USD Million)
        2. 5.4.9.2. Canada Market size and forecast, 2016-2026 (K Unit)
    5. 5.5. Europe
      1. 5.5.1. Europe RNAi for Therapeutic Market size and forecast, 2016-2026
      2. 5.5.2. Europe RNAi for Therapeutic Market, by Country, 2018 - 2025 (USD Million)
      3. 5.5.3. Europe Market size and forecast, 2016-2026 (K Unit)
      4. 5.5.4. Europe RNAi for Therapeutic Market, by Country, 2018 - 2025 (K Unit)
      5. 5.5.5. Europe RNAi for Therapeutic Market, by Product , 2016-2026
        1. 5.5.5.1. Europe RNAi for Therapeutic Market, by Product , 2016-2026 (USD Million)
        2. 5.5.5.2. Europe RNAi for Therapeutic Market, by Product , 2016-2026 (K Unit)
      6. 5.5.6. Europe RNAi for Therapeutic Market, by Application, 2016-2026
        1. 5.5.6.1. Europe RNAi for Therapeutic Market, by Application, 2016-2026 (USD Million)
        2. 5.5.6.2. Europe RNAi for Therapeutic Market, by Application, 2016-2026 (K Unit)
      7. 5.5.7. Europe RNAi for Therapeutic Market, by Sales Channel, 2016-2026
        1. 5.5.7.1. Europe RNAi for Therapeutic Market, by Sales Channel, 2016-2026 (USD Million)
        2. 5.5.7.2. Europe RNAi for Therapeutic Market, by Sales Channel, 2016-2026 (K Unit)
      8. 5.5.8. Germany
        1. 5.5.8.1. Germany Market size and forecast, 2016-2026 (USD Million)
        2. 5.5.8.2. Germany Market size and forecast, 2016-2026 (K Unit)
      9. 5.5.9. France
        1. 5.5.9.1. France Market size and forecast, 2016-2026 (USD Million)
        2. 5.5.9.2. France Market size and forecast, 2016-2026 (K Unit)
      10. 5.5.10. U.K.
        1. 5.5.10.1. U.K. Market size and forecast, 2016-2026 (USD Million)
        2. 5.5.10.2. U.K. Market size and forecast, 2016-2026 (K Unit)
      11. 5.5.11. Italy
        1. 5.5.11.1. Italy Market size and forecast, 2016-2026 (USD Million)
        2. 5.5.11.2. Italy Market size and forecast, 2016-2026 (K Unit)
      12. 5.5.12. Spain
        1. 5.5.12.1. Spain Market size and forecast, 2016-2026 (USD Million)
        2. 5.5.12.2. Spain Market size and forecast, 2016-2026 (K Unit)
      13. 5.5.13. Rest of Europe
        1. 5.5.13.1. Rest of Europe Market size and forecast, 2016-2026 (USD Million)
        2. 5.5.13.2. Rest of Europe Market size and forecast, 2016-2026 (K Unit)
    6. 5.6. Asia Pacific
      1. 5.6.1. Asia Pacific RNAi for Therapeutic Market size and forecast, 2016-2026
      2. 5.6.2. Asia Pacific RNAi for Therapeutic Market, by Country, 2018 - 2025 (USD Million)
      3. 5.6.3. Asia Pacific Market size and forecast, 2016-2026 (K Unit)
      4. 5.6.4. Asia Pacific RNAi for Therapeutic Market, by Country, 2018 - 2025 (K Unit)
      5. 5.6.5. Asia Pacific RNAi for Therapeutic Market, by Product , 2016-2026
        1. 5.6.5.1. Asia Pacific RNAi for Therapeutic Market, by Product , 2016-2026 (USD Million)
        2. 5.6.5.2. Asia Pacific RNAi for Therapeutic Market, by Product , 2016-2026 (K Unit)
      6. 5.6.6. Asia Pacific RNAi for Therapeutic Market, by Application, 2016-2026
        1. 5.6.6.1. Asia Pacific RNAi for Therapeutic Market, by Application, 2016-2026 (USD Million)
        2. 5.6.6.2. Asia Pacific RNAi for Therapeutic Market, by Application, 2016-2026 (K Unit)
      7. 5.6.7. Asia Pacific RNAi for Therapeutic Market, by Sales Channel, 2016-2026
        1. 5.6.7.1. Asia Pacific RNAi for Therapeutic Market, by Sales Channel, 2016-2026 (USD Million)
        2. 5.6.7.2. Asia Pacific RNAi for Therapeutic Market, by Sales Channel, 2016-2026 (K Unit)
      8. 5.6.8. China
        1. 5.6.8.1. China Market size and forecast, 2016-2026 (USD Million)
        2. 5.6.8.2. China Market size and forecast, 2016-2026 (K Unit)
      9. 5.6.9. Japan
        1. 5.6.9.1. Japan Market size and forecast, 2016-2026 (USD Million)
        2. 5.6.9.2. Japan Market size and forecast, 2016-2026 (K Unit)
      10. 5.6.10. India
        1. 5.6.10.1. India Market size and forecast, 2016-2026 (USD Million)
        2. 5.6.10.2. India Market size and forecast, 2016-2026 (K Unit)
      11. 5.6.11. South Korea
        1. 5.6.11.1. South Korea Market size and forecast, 2016-2026 (USD Million)
        2. 5.6.11.2. South Korea Market size and forecast, 2016-2026 (K Unit)
      12. 5.6.12. South-East Asia
        1. 5.6.12.1. South-East Asia Market size and forecast, 2016-2026 (USD Million)
        2. 5.6.12.2. South-East Asia Market size and forecast, 2016-2026 (K Unit)
      13. 5.6.13. Rest of Asia Pacific
        1. 5.6.13.1. Rest of Asia Pacific Market size and forecast, 2016-2026 (USD Million)
        2. 5.6.13.2. Rest of Asia Pacific Market size and forecast, 2016-2026 (K Unit)
    7. 5.7. Latin America
      1. 5.7.1. Latin America RNAi for Therapeutic Market size and forecast, 2016-2026
      2. 5.7.2. Latin America RNAi for Therapeutic Market, by Country, 2018 - 2025 (USD Million)
      3. 5.7.3. Latin America Market size and forecast, 2016-2026 (K Unit)
      4. 5.7.4. Latin America RNAi for Therapeutic Market, by Country, 2018 - 2025 (K Unit)
      5. 5.7.5. Latin America RNAi for Therapeutic Market, by Product , 2016-2026
        1. 5.7.5.1. Latin America RNAi for Therapeutic Market, by Product , 2016-2026 (USD Million)
        2. 5.7.5.2. Latin America RNAi for Therapeutic Market, by Product , 2016-2026 (K Unit)
      6. 5.7.6. Latin America RNAi for Therapeutic Market, by Application, 2016-2026
        1. 5.7.6.1. Latin America RNAi for Therapeutic Market, by Application, 2016-2026 (USD Million)
        2. 5.7.6.2. Latin America RNAi for Therapeutic Market, by Application, 2016-2026 (K Unit)
      7. 5.7.7. Latin America RNAi for Therapeutic Market, by Sales Channel, 2016-2026
        1. 5.7.7.1. Latin America RNAi for Therapeutic Market, by Sales Channel, 2016-2026 (USD Million)
        2. 5.7.7.2. Latin America RNAi for Therapeutic Market, by Sales Channel, 2016-2026 (K Unit)
      8. 5.7.8. Brazil
        1. 5.7.8.1. Brazil Market size and forecast, 2016-2026 (USD Million)
        2. 5.7.8.2. Brazil Market size and forecast, 2016-2026 (K Unit)
      9. 5.7.9. Mexico
        1. 5.7.9.1. Mexico Market size and forecast, 2016-2026 (USD Million)
        2. 5.7.9.2. Mexico Market size and forecast, 2016-2026 (K Unit)
      10. 5.7.10. Rest of Latin America
        1. 5.7.10.1. Rest of Latin America Market size and forecast, 2016-2026 (USD Million)
        2. 5.7.10.2. Rest of Latin America Market size and forecast, 2016-2026 (K Unit)
    8. 5.8. The Middle-East and Africa
      1. 5.8.1. The Middle-East and Africa RNAi for Therapeutic Market size and forecast, 2016-2026
      2. 5.8.2. The Middle-East and Africa RNAi for Therapeutic Market, by Country, 2018 - 2025 (USD Million)
      3. 5.8.3. The Middle-East and Africa Market size and forecast, 2016-2026 (K Unit)
      4. 5.8.4. The Middle-East and Africa RNAi for Therapeutic Market, by Country, 2018 - 2025 (K Unit)
      5. 5.8.5. The Middle-East and Africa RNAi for Therapeutic Market, by Product , 2016-2026
        1. 5.8.5.1. The Middle-East and Africa RNAi for Therapeutic Market, by Product , 2016-2026 (USD Million)
        2. 5.8.5.2. The Middle-East and Africa RNAi for Therapeutic Market, by Product , 2016-2026 (K Unit)
      6. 5.8.6. The Middle-East and Africa RNAi for Therapeutic Market, by Application, 2016-2026
        1. 5.8.6.1. The Middle-East and Africa RNAi for Therapeutic Market, by Application, 2016-2026 (USD Million)
        2. 5.8.6.2. The Middle-East and Africa RNAi for Therapeutic Market, by Application, 2016-2026 (K Unit)
      7. 5.8.7. The Middle-East and Africa RNAi for Therapeutic Market, by Sales Channel, 2016-2026
        1. 5.8.7.1. The Middle-East and Africa RNAi for Therapeutic Market, by Sales Channel, 2016-2026 (USD Million)
        2. 5.8.7.2. The Middle-East and Africa RNAi for Therapeutic Market, by Sales Channel, 2016-2026 (K Unit)
      8. 5.8.8. GCC Countries
        1. 5.8.8.1. GCC Countries Market size and forecast, 2016-2026 (USD Million)
        2. 5.8.8.2. GCC Countries Market size and forecast, 2016-2026 (K Unit)
      9. 5.8.9. South Africa
        1. 5.8.9.1. South Africa Market size and forecast, 2016-2026 (USD Million)
        2. 5.8.9.2. South Africa Market size and forecast, 2016-2026 (K Unit)
      10. 5.8.10. Rest of Middle-East Africa
        1. 5.8.10.1. Rest of Middle-East Africa Market size and forecast, 2016-2026 (USD Million)
        2. 5.8.10.2. Rest of Middle-East Africa Market size and forecast, 2016-2026 (K Unit)
  6. CHAPTER 6. RNAi for Therapeutic Production, Consumption, Export, Import by Regions
    1. 6.1. Global RNAi for Therapeutic production and revenue, 2016-2026 (USD Million) (K Unit)
    2. 6.2. Global Import and Export Analysis, by Region
  7. CHAPTER 7. RNAi for Therapeutic market – Competitive Landscape
    1. 7.1. Competitor Market Share – Revenue
    2. 7.2. Market Concentration Rate Analysis, Top 3 and Top 5 Players
    3. 7.3. Competitor Market Share – Volume
    4. 7.4. Strategic Development
      1. 7.4.1. Acquisitions and Mergers
      2. 7.4.2. New Products
      3. 7.4.3. Research & Development Activities
  8. CHAPTER 8. Company Profiles
    1. 8.1. Alnylam Pharmaceuticals
      1. 8.1.1. Company Overview
      2. 8.1.2. Alnylam Pharmaceuticals Sales, Revenue, Price, and Gross Margin
      3. 8.1.3. Product portfolio
      4. 8.1.4. Recent initiatives
    2. 8.2. Arrowhead Pharmaceuticals, Inc
      1. 8.2.1. Company Overview
      2. 8.2.2. Arrowhead Pharmaceuticals, Inc Sales, Revenue, Price, and Gross Margin
      3. 8.2.3. Product portfolio
      4. 8.2.4. Recent initiatives
    3. 8.3. Dicerna Pharmaceuticals, Inc
      1. 8.3.1. Company Overview
      2. 8.3.2. Dicerna Pharmaceuticals, Inc Sales, Revenue, Price, and Gross Margin
      3. 8.3.3. Product portfolio
      4. 8.3.4. Recent initiatives
    4. 8.4. Quark Pharmaceuticals
      1. 8.4.1. Company Overview
      2. 8.4.2. Quark Pharmaceuticals Sales, Revenue, Price, and Gross Margin
      3. 8.4.3. Product portfolio
      4. 8.4.4. Recent initiatives
    5. 8.5. RXi Pharmaceuticals
      1. 8.5.1. Company Overview
      2. 8.5.2. RXi Pharmaceuticals Sales, Revenue, Price, and Gross Margin
      3. 8.5.3. Product portfolio
      4. 8.5.4. Recent initiatives
    6. 8.6. miRagen Therapeutics, Inc.
      1. 8.6.1. Company Overview
      2. 8.6.2. miRagen Therapeutics, Inc. Sales, Revenue, Price, and Gross Margin
      3. 8.6.3. Product portfolio
      4. 8.6.4. Recent initiatives
    7. 8.7. Gradalis, Inc
      1. 8.7.1. Company Overview
      2. 8.7.2. Gradalis, Inc Sales, Revenue, Price, and Gross Margin
      3. 8.7.3. Product portfolio
      4. 8.7.4. Recent initiatives
    8. 8.8. Sirnaomics, Inc
      1. 8.8.1. Company Overview
      2. 8.8.2. Sirnaomics, Inc Sales, Revenue, Price, and Gross Margin
      3. 8.8.3. Product portfolio
      4. 8.8.4. Recent initiatives
    9. 8.9. Arbutus Biopharma (Tekmira)
      1. 8.9.1. Company Overview
      2. 8.9.2. Arbutus Biopharma (Tekmira) Sales, Revenue, Price, and Gross Margin
      3. 8.9.3. Product portfolio
      4. 8.9.4. Recent initiatives
    10. 8.10. Silence Therapeutics
      1. 8.10.1. Company Overview
      2. 8.10.2. Silence Therapeutics Sales, Revenue, Price, and Gross Margin
      3. 8.10.3. Product portfolio
      4. 8.10.4. Recent initiatives
    11. 8.11. Benitec Biopharma
      1. 8.11.1. Company Overview
      2. 8.11.2. Benitec Biopharma Sales, Revenue, Price, and Gross Margin
      3. 8.11.3. Product portfolio
      4. 8.11.4. Recent initiatives
    12. 8.12. Sylentis
      1. 8.12.1. Company Overview
      2. 8.12.2. Sylentis Sales, Revenue, Price, and Gross Margin
      3. 8.12.3. Product portfolio
      4. 8.12.4. Recent initiatives
    13. 8.13. Silenseed LTD
      1. 8.13.1. Company Overview
      2. 8.13.2. Silenseed LTD Sales, Revenue, Price, and Gross Margin
      3. 8.13.3. Product portfolio
      4. 8.13.4. Recent initiatives
  9. CHAPTER 9. RNAi for Therapeutic — Industry Analysis
    1. 9.1. Introduction and Taxonomy
    2. 9.2. RNAi for Therapeutic Market – Key Trends
      1. 9.2.1. Market Drivers
      2. 9.2.2. Market Restraints
      3. 9.2.3. Market Opportunities
    3. 9.3. Value Chain Analysis
    4. 9.4. Key Mandates and Regulations
    5. 9.5. Technology Roadmap and Timeline
    6. 9.6. RNAi for Therapeutic market – Attractiveness Analysis
      1. 9.6.1. By Product
      2. 9.6.2. By Application
      3. 9.6.3. By Sales Channel
      4. 9.6.4. By Region
  10. CHAPTER 10. Raw Material analysis
    1. 10.1. RNAi for Therapeutic Key Raw Material Analysis
      1. 10.1.1. Key Raw Materials
      2. 10.1.2. Price Trend of Key Raw Materials
    2. 10.2. Key Suppliers of Raw Materials
    3. 10.3. Proportion of Manufacturing Cost Structure
      1. 10.3.1. Raw Materials
      2. 10.3.2. Labor Cost
    4. 10.4. Manufacturing Expenses Analysis of RNAi for Therapeutic
  11. CHAPTER 11. Industrial Chain, Sourcing Strategy and Downstream Buyers
    1. 11.1. RNAi for Therapeutic Industrial Chain Analysis
    2. 11.2. Upstream Raw Materials Sourcing
      1. 11.2.1. Risk Mitigation:
      2. 11.2.2. Supplier Relationships:
      3. 11.2.3. Business Processes:
      4. 11.2.4. Securing the Product:
    3. 11.3. Raw Materials Sources of RNAi for Therapeutic Major Manufacturers in 2016
    4. 11.4. Downstream Buyers
    5. 11.5. Distributors/Traders List
  12. CHAPTER 12. Marketing Strategy Analysis, Distributors
    1. 12.1. Marketing Channel
    2. 12.2. Direct Marketing
    3. 12.3. Indirect Marketing
    4. 12.4. Marketing Channel Development Trend
    5. 12.5. Economic/Political Environmental Change
  13. CHAPTER 13. Report Conclusion
  14. CHAPTER 14. Research Approach & Methodology
    1. 14.1. Report Description
    2. 14.2. Research Scope
    3. 14.3. Research Methodology
      1. 14.3.1. Secondary Research
      2. 14.3.2. Primary Research
      3. 14.3.3. Models
        1. 14.3.3.1. Company Share Analysis Model
        2. 14.3.3.2. Revenue Based Modeling
        3. 14.3.3.3. Research Limitations

        List of Figures

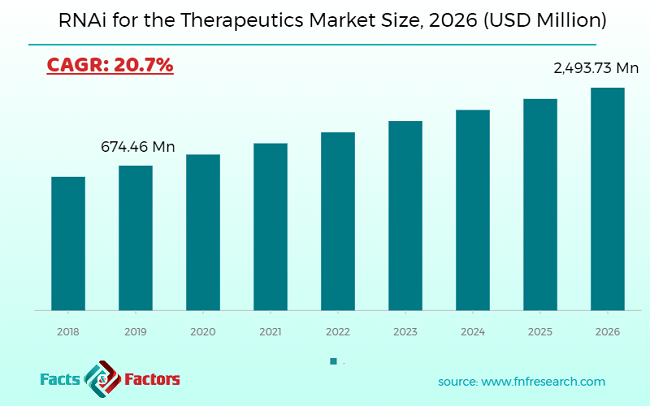
        FIG. 1 Global RNAi for Therapeutic Market, 2016-2026 (USD Million)
        FIG. 2 Global RNAi for Therapeutic Market Share, by Product , 2016 & 2026 (USD Million)
        FIG. 3 Global RNAi for Therapeutic Market share, by Product , 2016 & 2026 (K Unit)
        FIG. 4 Global siRNA RNAi for Therapeutic Market, 2016-2026 (USD Million)
        FIG. 5 Global siRNA RNAi for Therapeutic  Market, 2016-2026 (K Unit)
        FIG. 6 Global miRNA RNAi for Therapeutic Market, 2016-2026 (USD Million)
        FIG. 7 Global miRNA RNAi for Therapeutic  Market, 2016-2026 (K Unit)
        FIG. 8 Global shRNA RNAi for Therapeutic Market, 2016-2026 (USD Million)
        FIG. 9 Global shRNA RNAi for Therapeutic  Market, 2016-2026 (K Unit)
        FIG. 10 Global RNAi for Therapeutic Market Share, by Application, 2016 & 2026 (USD Million)
        FIG. 11 Global RNAi for Therapeutic Market share, by Application, 2016 & 2026 (K Unit)
        FIG. 12 Global Cancer RNAi for Therapeutic Market, 2016-2026 (USD Million)
        FIG. 13 Global Cancer RNAi for Therapeutic  Market, 2016-2026 (K Unit)
        FIG. 14 Global Ocular Disorder RNAi for Therapeutic Market, 2016-2026 (USD Million)
        FIG. 15 Global Ocular Disorder RNAi for Therapeutic  Market, 2016-2026 (K Unit)
        FIG. 16 Global HBV RNAi for Therapeutic Market, 2016-2026 (USD Million)
        FIG. 17 Global HBV RNAi for Therapeutic  Market, 2016-2026 (K Unit)
        FIG. 18 Global Others RNAi for Therapeutic Market, 2016-2026 (USD Million)
        FIG. 19 Global Others RNAi for Therapeutic  Market, 2016-2026 (K Unit)
        FIG. 20 Global RNAi for Therapeutic Market Share, by Sales Channel, 2016 & 2026 (USD Million)
        FIG. 21 Global RNAi for Therapeutic Market share, by Sales Channel, 2016 & 2026 (K Unit)
        FIG. 22 Global Direct Channel RNAi for Therapeutic Market, 2016-2026 (USD Million)
        FIG. 23 Global Direct Channel RNAi for Therapeutic  Market, 2016-2026 (K Unit)
        FIG. 24 Global Distribution Channel RNAi for Therapeutic Market, 2016-2026 (USD Million)
        FIG. 25 Global Distribution Channel RNAi for Therapeutic  Market, 2016-2026 (K Unit)
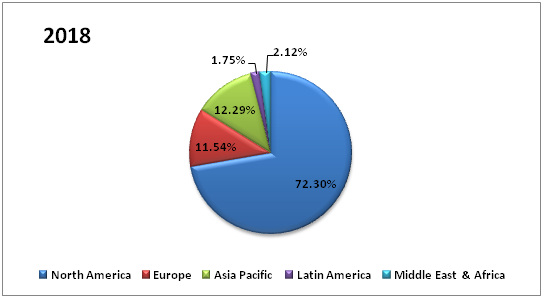
        FIG. 26 Global RNAi for Therapeutic Market Share, by Region, 2016 & 2026
        FIG. 27 Global RNAi for Therapeutic Market Share, by Region, 2016 & 2026
        FIG. 28 North America RNAi for Therapeutic Market, 2016-2026
        FIG. 29 North America RNAi for Therapeutic  Market, 2016-2026 (K Unit)
        FIG. 30 U.S. RNAi for Therapeutic Market, 2016-2026
        FIG. 31 U.S. RNAi for Therapeutic  Market, 2016-2026 (K Unit)
        FIG. 32 Canada RNAi for Therapeutic Market, 2016-2026
        FIG. 33 Canada RNAi for Therapeutic  Market, 2016-2026 (K Unit)
        FIG. 34 Europe RNAi for Therapeutic Market, 2016-2026
        FIG. 35 Europe RNAi for Therapeutic  Market, 2016-2026 (K Unit)
        FIG. 36 Germany RNAi for Therapeutic Market, 2016-2026
        FIG. 37 Germany RNAi for Therapeutic  Market, 2016-2026 (K Unit)
        FIG. 38 France RNAi for Therapeutic Market, 2016-2026
        FIG. 39 France RNAi for Therapeutic  Market, 2016-2026 (K Unit)
        FIG. 40 U.K. RNAi for Therapeutic Market, 2016-2026
        FIG. 41 U.K. RNAi for Therapeutic  Market, 2016-2026 (K Unit)
        FIG. 42 Italy RNAi for Therapeutic Market, 2016-2026
        FIG. 43 Italy RNAi for Therapeutic  Market, 2016-2026 (K Unit)
        FIG. 44 Spain RNAi for Therapeutic Market, 2016-2026
        FIG. 45 Spain RNAi for Therapeutic  Market, 2016-2026 (K Unit)
        FIG. 46 Rest of Europe RNAi for Therapeutic Market, 2016-2026
        FIG. 47 Rest of Europe RNAi for Therapeutic  Market, 2016-2026 (K Unit)
        FIG. 48 Asia Pacific RNAi for Therapeutic Market, 2016-2026
        FIG. 49 Asia Pacific RNAi for Therapeutic  Market, 2016-2026 (K Unit)
        FIG. 50 China RNAi for Therapeutic Market, 2016-2026
        FIG. 51 China RNAi for Therapeutic  Market, 2016-2026 (K Unit)
        FIG. 52 Japan RNAi for Therapeutic Market, 2016-2026
        FIG. 53 Japan RNAi for Therapeutic  Market, 2016-2026 (K Unit)
        FIG. 54 India RNAi for Therapeutic Market, 2016-2026
        FIG. 55 India RNAi for Therapeutic  Market, 2016-2026 (K Unit)
        FIG. 56 South  Korea RNAi for Therapeutic Market, 2016-2026
        FIG. 57 South  Korea RNAi for Therapeutic  Market, 2016-2026 (K Unit)
        FIG. 58 South-East Asia RNAi for Therapeutic Market, 2016-2026
        FIG. 59 South-East Asia RNAi for Therapeutic  Market, 2016-2026 (K Unit)
        FIG. 60 Rest of Asia Pacific RNAi for Therapeutic Market, 2016-2026
        FIG. 61 Rest of Asia Pacific RNAi for Therapeutic  Market, 2016-2026 (K Unit)
        FIG. 62 Latin America RNAi for Therapeutic Market, 2016-2026
        FIG. 63 Latin America RNAi for Therapeutic  Market, 2016-2026 (K Unit)
        FIG. 64 Brazil RNAi for Therapeutic Market, 2016-2026
        FIG. 65 Brazil RNAi for Therapeutic  Market, 2016-2026 (K Unit)
        FIG. 66 Mexico RNAi for Therapeutic Market, 2016-2026
        FIG. 67 Mexico RNAi for Therapeutic  Market, 2016-2026 (K Unit)
        FIG. 68 Rest of Latin America RNAi for Therapeutic Market, 2016-2026
        FIG. 69 Rest of Latin America RNAi for Therapeutic  Market, 2016-2026 (K Unit)
        FIG. 70 The Middle-East and Africa RNAi for Therapeutic Market, 2016-2026
        FIG. 71 The Middle-East and Africa RNAi for Therapeutic  Market, 2016-2026 (K Unit)
        FIG. 72 GCC Countries RNAi for Therapeutic Market, 2016-2026
        FIG. 73 GCC Countries RNAi for Therapeutic  Market, 2016-2026 (K Unit)
        FIG. 74 South Africa RNAi for Therapeutic Market, 2016-2026
        FIG. 75 South Africa RNAi for Therapeutic  Market, 2016-2026 (K Unit)
        FIG. 76 Rest of Middle-East Africa RNAi for Therapeutic Market, 2016-2026
        FIG. 77 Rest of Middle-East Africa RNAi for Therapeutic  Market, 2016-2026 (K Unit)
        FIG. 78 Global RNAi for Therapeutic production and revenue, 2016-2026 (USD Million) (K Unit)
        FIG. 79 North America RNAi for Therapeutic production and revenue, 2016-2026 (USD Million) (K Unit)
        FIG. 80 Europe RNAi for Therapeutic production and revenue, 2016-2026 (USD Million) (K Unit)
        FIG. 81 Asia Pacific RNAi for Therapeutic production and revenue, 2016-2026 (USD Million) (K Unit)
        FIG. 82 Latin America RNAi for Therapeutic production and revenue, 2016-2026 (USD Million) (K Unit)
        FIG. 83 Middle East and Africa RNAi for Therapeutic production and revenue, 2016-2026 (USD Million) (K Unit)
        FIG. 84 Competitor Market Share – Revenue
        FIG. 85 Competitor Market Share – Volume
        FIG. 86 Alnylam Pharmaceuticals Revenue and Growth Rate
        FIG. 87 Alnylam Pharmaceuticals Market Share
        FIG. 88 Arrowhead Pharmaceuticals, Inc Revenue and Growth Rate
        FIG. 89 Arrowhead Pharmaceuticals, Inc Market Share
        FIG. 90 Dicerna Pharmaceuticals, Inc Revenue and Growth Rate
        FIG. 91 Dicerna Pharmaceuticals, Inc Market Share
        FIG. 92 Quark Pharmaceuticals Revenue and Growth Rate
        FIG. 93 Quark Pharmaceuticals Market Share
        FIG. 94 RXi Pharmaceuticals Revenue and Growth Rate
        FIG. 95 RXi Pharmaceuticals Market Share
        FIG. 96 miRagen Therapeutics, Inc. Revenue and Growth Rate
        FIG. 97 miRagen Therapeutics, Inc. Market Share
        FIG. 98 Gradalis, Inc Revenue and Growth Rate
        FIG. 99 Gradalis, Inc Market Share
        FIG. 100 Sirnaomics, Inc Revenue and Growth Rate
        FIG. 101 Sirnaomics, Inc Market Share
        FIG. 102 Arbutus Biopharma (Tekmira) Revenue and Growth Rate
        FIG. 103 Arbutus Biopharma (Tekmira) Market Share
        FIG. 104 Silence Therapeutics Revenue and Growth Rate
        FIG. 105 Silence Therapeutics Market Share
        FIG. 106 Benitec Biopharma Revenue and Growth Rate
        FIG. 107 Benitec Biopharma Market Share
        FIG. 108 Sylentis Revenue and Growth Rate
        FIG. 109 Sylentis Market Share
        FIG. 110 Silenseed LTD Revenue and Growth Rate
        FIG. 111 Silenseed LTD Market Share
        FIG. 112 Market Dynamics
        FIG. 113 Global RNAi for Therapeutic – Value Chain Analysis
        FIG. 114 Key Mandates and Regulations
        FIG. 115 Technology Roadmap and Timeline
        FIG. 116 Market Attractiveness Analysis – By Product
        FIG. 117 Market Attractiveness Analysis – By Application
        FIG. 118 Market Attractiveness Analysis – By Sales Channel
        FIG. 119 Market Attractiveness Analysis – By Region
        FIG. 120 Manufacturing Cost Structure of RNAi for Therapeutic
        FIG. 121 RNAi for Therapeutic Industrial Chain Analysis
        FIG. 122 Market Channel
        FIG. 123 Marketing Channel Development Trend
        FIG. 124 Growth in World Gross Product, 2008-2018


        List of Tables

        TABLE 1 Global RNAi for Therapeutic market, 2016 & 2026 (USD Million)
        TABLE 2 Global RNAi for Therapeutic market, by Product , 2016-2026 (USD Million)
        TABLE 3 Global RNAi for Therapeutic market, by Product , 2016-2026 (K Unit)
        TABLE 4 Global RNAi for Therapeutic market, by Application, 2016-2026 (USD Million)
        TABLE 5 Global RNAi for Therapeutic market, by Application, 2016-2026 (K Unit)
        TABLE 6 Global RNAi for Therapeutic market, by Sales Channel, 2016-2026 (USD Million)
        TABLE 7 Global RNAi for Therapeutic market, by Sales Channel, 2016-2026 (K Unit)
        TABLE 8 Global RNAi for Therapeutic market, by region, 2016-2026 (USD Million)
        TABLE 9 Global RNAi for Therapeutic market, by region, 2016-2026 (K Unit)
        TABLE 10 North America RNAi for Therapeutic Market, by Product , 2016-2026 (USD Million)
        TABLE 11 North America RNAi for Therapeutic Market, by Product , 2016-2026 (K Unit)
        TABLE 12 North America RNAi for Therapeutic Market, by Application, 2016-2026 (USD Million)
        TABLE 13 North America RNAi for Therapeutic Market, by Application, 2016-2026 (K Unit)
        TABLE 14 North America RNAi for Therapeutic Market, by Sales Channel, 2016-2026 (USD Million)
        TABLE 15 North America RNAi for Therapeutic Market, by Sales Channel, 2016-2026 (K Unit)
        TABLE 16 Europe RNAi for Therapeutic Market, by Product , 2016-2026 (USD Million)
        TABLE 17 Europe RNAi for Therapeutic Market, by Product , 2016-2026 (K Unit)
        TABLE 18 Europe RNAi for Therapeutic Market, by Application, 2016-2026 (USD Million)
        TABLE 19 Europe RNAi for Therapeutic Market, by Application, 2016-2026 (K Unit)
        TABLE 20 Europe RNAi for Therapeutic Market, by Sales Channel, 2016-2026 (USD Million)
        TABLE 21 Europe RNAi for Therapeutic Market, by Sales Channel, 2016-2026 (K Unit)
        TABLE 22 Asia Pacific RNAi for Therapeutic Market, by Product , 2016-2026 (USD Million)
        TABLE 23 Asia Pacific RNAi for Therapeutic Market, by Product , 2016-2026 (K Unit)
        TABLE 24 Asia Pacific RNAi for Therapeutic Market, by Application, 2016-2026 (USD Million)
        TABLE 25 Asia Pacific RNAi for Therapeutic Market, by Application, 2016-2026 (K Unit)
        TABLE 26 Asia Pacific RNAi for Therapeutic Market, by Sales Channel, 2016-2026 (USD Million)
        TABLE 27 Asia Pacific RNAi for Therapeutic Market, by Sales Channel, 2016-2026 (K Unit)
        TABLE 28 Latin America RNAi for Therapeutic Market, by Product , 2016-2026 (USD Million)
        TABLE 29 Latin America RNAi for Therapeutic Market, by Product , 2016-2026 (K Unit)
        TABLE 30 Latin America RNAi for Therapeutic Market, by Application, 2016-2026 (USD Million)
        TABLE 31 Latin America RNAi for Therapeutic Market, by Application, 2016-2026 (K Unit)
        TABLE 32 Latin America RNAi for Therapeutic Market, by Sales Channel, 2016-2026 (USD Million)
        TABLE 33 Latin America RNAi for Therapeutic Market, by Sales Channel, 2016-2026 (K Unit)
        TABLE 34 The Middle-East and Africa RNAi for Therapeutic Market, by Product , 2016-2026 (USD Million)
        TABLE 35 The Middle-East and Africa RNAi for Therapeutic Market, by Product , 2016-2026 (K Unit)
        TABLE 36 The Middle-East and Africa RNAi for Therapeutic Market, by Application, 2016-2026 (USD Million)
        TABLE 37 The Middle-East and Africa RNAi for Therapeutic Market, by Application, 2016-2026 (K Unit)
        TABLE 38 The Middle-East and Africa RNAi for Therapeutic Market, by Sales Channel, 2016-2026 (USD Million)
        TABLE 39 The Middle-East and Africa RNAi for Therapeutic Market, by Sales Channel, 2016-2026 (K Unit)
        TABLE 40 North America RNAi for Therapeutic Production, Consumption, Export, Import, 2015-2019
        TABLE 41 Europe RNAi for Therapeutic Production, Consumption, Export, Import, 2015-2019
        TABLE 42 Asia Pacific RNAi for Therapeutic Production, Consumption, Export, Import, 2015-2019
        TABLE 43 Latin America RNAi for Therapeutic Production, Consumption, Export, Import, 2015-2019
        TABLE 44 Middle East & Africa RNAi for Therapeutic Production, Consumption, Export, Import, 2015-2019
        TABLE 45 Global RNAi for Therapeutic Market - Company Revenue Analysis 2015-2019 (USD Million)
        TABLE 46 Global RNAi for Therapeutic Market - Company Revenue Share Analysis 2015-2019(%)
        TABLE 47 Global RNAi for Therapeutic Market - Company Volume Analysis 2015-2019 (K Unit)
        TABLE 48 Global RNAi for Therapeutic Market - Company Volume Share Analysis 2015-2019(%)
        TABLE 49 Acquisitions and Mergers
        TABLE 50 New Product/Service Launch
        TABLE 51 Research & Development Activities
        TABLE 52 Market Drivers
        TABLE 53 Market Restraints
        TABLE 54 Market Opportunities
        TABLE 55 Production Base and Market Concentration Rate of Raw Material
        TABLE 56 Key Suppliers of Raw Materials
        TABLE 57 Raw Materials Sources of RNAi for Therapeutic Major Manufacturers in 2016
        TABLE 58 Major Buyers of RNAi for Therapeutic
        TABLE 59 Distributors/Traders of RNAi for Therapeutic by Region
         

Industry Major Market Players

  • Alnylam Pharmaceuticals
  • Arrowhead
  • Dicerna Pharmaceuticals
  • Quark Pharmaceuticals
  • RXi Pharmaceuticals
  • miRagen Therapeutics
  • Gradalis
  • Sirnaomics