Search Market Research Report

Discover Our Latest Reports
Discover Our Featured Reports
Discover Top Selling Reports

Refinery Catalyst Market Size, Share Global Analysis Report, 2020–2026

report img

Refinery Catalyst Market By Type (FCC Catalysts, Hydrotreating Catalysts, Hydrocracking Catalysts, Catalytic Reforming Catalysts, and Others), Material (Zeolites, Metals, and Chemical Compounds) and By Application (Oil Refinery, Chemical Synthesis,Polymer Manufacturing, and Others): Global Industry Outlook, Market Size, Business Intelligence, Consumer Preferences, Statistical Surveys, Comprehensive Analysis, Historical Developments, Current Trends, and Forecast 2020–2026

Industry Insights

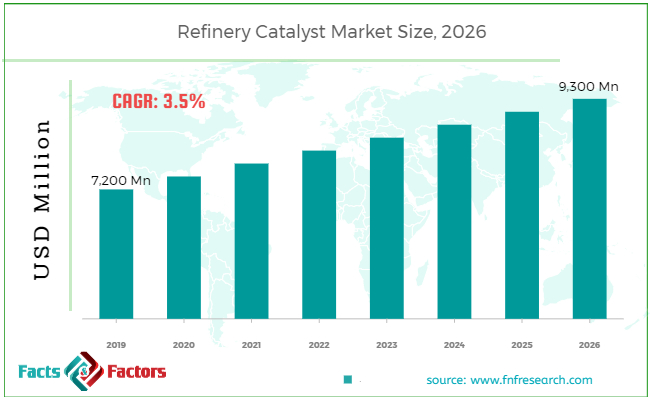
[210+ Pages Report] According to the report published by Facts Factors, the global refinery catalyst market size was worth around USD 7,200 million in 2019 and is predicted to grow to around USD 9,300 million by 2026 with a compound annual growth rate (CAGR) of roughly 3.5% between 2020 and 2026. The report analyzes the global refinery catalyst market drivers, restraints/challenges, and the effect they have on the demands during the projection period. In addition, the report explores emerging opportunities in the refinery catalyst market.

Refinery Catalyst Market Size

To know more about this report | Request Free Sample Copy

This specialized and expertise oriented industry research report scrutinizes the technical and commercial business outlook of the refinery catalyst industry. The report analyzes and declares the historical and current trends analysis of the refinery catalyst industry and subsequently recommends the projected trends anticipated to be observed in the refinery catalyst market during the upcoming years.

The refinery catalyst market report analyzes and notifies the industry statistics at the global as well as regional and country levels in order to acquire a thorough perspective of the entire refinery catalyst market. The historical and past insights are provided for FY 2016 to FY 2019 whereas projected trends are delivered for FY 2020 to FY 2026. The quantitative and numerical data is represented in terms of both volume (Kilo Tons) and value (USD Million) from FY 2016 – 2026.


logoKey Insights from Primary Research

  • According to the primary respondents, the global refinery catalyst market is set to grow annually at a rate of around 3.5%
  • The market was valued at around USD7,200million, in 2019 and is projected to reach around USD 9,300million, in 2026.
  • In 2019, the “FCC catalysts” category dominated the type segmentation of the market and is projected to continue its dominance throughout the forecast period.
  • “Zeolites” category of the material segment is expected to grow significantly during the forecast period owing to its increasing usage in the refining and petrochemical industries.
  • Based on the application segmentation, the “oil refinery” category held a significant share, in 2019.
  • The Asia Pacific accounted for the largest market share of the global refinery catalyst market, in 2019.

logoKey Recommendations from Analysts

  • As per our analysts, the global refinery catalyst market is anticipated to grow significantly during the upcoming years. The growing adoption of refinery catalysts in the oil refineries is increasing market growth.
  • The rise in the transportation industry has increased the consumption of petroleum fuels. Therefore, this, in turn, is expected to boost the application of refinery catalysts.
  • The Asia Pacific is the potential region for the global refinery catalysts market. The presence of a large number of crude oil refining plants in countries like China, India, Japan, and South Korea is increasing the demand for refinery catalysts.
  • Growing at a CAGR around 3.5%, the global refinery catalysts market provides several opportunities for suppliers and manufacturers.
  • Our analysts have identified the “oil refinery” category is the major consumer of the refinery catalysts across the globe.
  • The major players of the global refinery catalysts market are focusing on product development and innovation. For instance, BASF has recently introduced the Fortress NXT FCC catalyst. This will help refineries with heavy feed especially to improve their production of liquid products.

The quantitative data is further underlined and reinforced by comprehensive qualitative data which comprises various across-the-board market dynamics. The rationales which directly or indirectly impact the refinery catalyst industry are exemplified through parameters such as growth drivers, restraints, challenges, and opportunities among other impacting factors.

Throughout our research report, we have encompassed all the proven models and tools of industry analysis and extensively illustrated all the key business strategies and business models adopted in the refinery catalyst industry. The report provides an all-inclusive and detailed competitive landscape prevalent in the refinery catalyst market.

The report utilizes established industry analysis tools and models such as Porter’s Five Forces framework to analyze and recognize critical business strategies adopted by various stakeholders involved in the entire value chain of the refinery catalyst industry. The refinery catalyst market report additionally employs SWOT analysis and PESTLE analysis models for further in-depth analysis.

The report study further includes an in-depth analysis of industry players' market shares and provides an overview of leading players' market position in the refinery catalyst sector. Key strategic developments in the refinery catalyst market competitive landscape such as acquisitions & mergers, inaugurations of different products and services, partnerships & joint ventures, MoU agreements, VC & funding activities, R&D activities, and geographic expansion among other noteworthy activities by key players of the refinery catalyst market are appropriately highlighted in the report.

The rising application of refinery catalystsin the petroleum industryis expected to boost the global refinery catalyst market.The increasing energy demand across the globe is one of the major factors driving the market growth. With the growing population, the number of vehicles is also increasing which is further projected to accelerate the demand for petroleum fuels, thereby, propelling the global refinery catalyst market.

The refinery catalyst market research report delivers an acute valuation and taxonomy of the refinery catalyst industry by practically splitting the market on the basis of different types, materials, applications, and regions. Through the analysis of the historical and projected trends, all the segments and sub-segments were evaluated through the bottom-up approach, and different market sizes have been projected for FY 2020 to FY 2026.

The regional segmentation of the refinery catalyst industry includes the complete classification of all the major continents including North America, Latin America, Europe, Asia Pacific, and Middle East & Africa. Further, country-wise data for the refinery catalyst industry is provided for the leading economies of the world.

The refinery catalyst market is segmented based on Type, Material, and Application. On the basis of type segmentation, the market is classified into FC catalysts, hydrotreating catalysts, hydrocracking catalysts, catalytic reforming catalysts, and others. Based on the material, the market is segregated into zeolites, metals, and chemical compounds. In terms of application segmentation, the market is bifurcated into an oil refinery, chemical synthesis, polymer manufacturing, and others.

logoReport Scope

Report Attribute

Details

Market Size in 2019

 USD 7,200 Million

Projected Market Size in 2026

 USD 9,300 Million

CAGR Growth Rate

3.5% CAGR

Base Year

2021

Forecast Years

2022-2028

Key Market Players

Arkema Group, W. R. Grace & Co., Honeywell, Criterion Catalysts & Technologies, Axens SA, HaldorTopsoe A/S, BASF SE, China Petroleum & Chemical Corporation, Albemarle Corporation, Clariant International Ltd., Chempack, Exxon Mobil Corporation, and KNT Group, and Others

Key Segment

By Type, Material, Applications, and By Region

Major Regions Covered

North America, Europe, Asia Pacific, Latin America, and the Middle East & Africa

Purchase Options

Request customized purchase options to meet your research needs. Explore purchase options

logoSome of the leading players in the global market include

  • Arkema Group
  •  W. R. Grace & Co.
  •  Honeywell
  •  Criterion Catalysts & Technologies
  •  Axens SA
  •  HaldorTopsoe A/S
  • BASF SE
  • China Petroleum & Chemical Corporation
  • Albemarle Corporation
  • Clariant International Ltd
  • Chempack
  • Exxon Mobil Corporation
  • KNT Group

The taxonomy of the refinery catalyst market by its scope and segmentation is as follows:

logoBy Type Segmentation Analysis

  • FCC Catalysts
  • Hydrotreating Catalysts
  • Hydrocracking Catalysts
  • Catalytic Reforming Catalysts
  • Others

logoBy Material Segmentation Analysis

  • Zeolites
  • Metals
  • Chemical Compounds

logoBy Application Segmentation Analysis

  • Oil Refinery
  • Chemical Synthesis
  • Polymer Manufacturing
  • Others

logoBy Regional Segmentation Analysis

  • North America
    • The U.S.
    • Canada
  • Europe
    • Germany
    • The UK
    • France
    • Spain
    • Italy
    • Rest of Europe
  • Asia Pacific
    • China
    • Japan
    • India
    • South Korea
    • Southeast Asia
    • Rest of Asia Pacific
  • Latin America
    • Brazil
    • Mexico
    • Rest of Latin America
  • Middle East & Africa
    • GCC
    • South Africa
    • Rest of Middle East & Africa

Table of Content

  1. CHAPTER 1. Executive Summary
  2. CHAPTER 2. Refinery Catalyst market – Type Analysis
    1. 2.1. Global Refinery Catalyst Market – Type Overview
    2. 2.2. Global Refinery Catalyst Market Share, by Type, 2019 & 2026 (USD Million)
    3. 2.3. Global Refinery Catalyst Market share, by Type, 2019 & 2026 (Kilo Tons)
    4. 2.4. FCC Catalysts
      1. 2.4.1. Global FCC Catalysts Market, 2016-2026 (USD Million)
      2. 2.4.2. Global FCC Catalysts Market, 2016-2026 (Kilo Tons)
    5. 2.5. Hydrotreating Catalysts
      1. 2.5.1. Global Hydrotreating Catalysts Market, 2016-2026 (USD Million)
      2. 2.5.2. Global Hydrotreating Catalysts Market, 2016-2026 (Kilo Tons)
    6. 2.6. Hydrocracking Catalysts
      1. 2.6.1. Global Hydrocracking Catalysts Market, 2016-2026 (USD Million)
      2. 2.6.2. Global Hydrocracking Catalysts Market, 2016-2026 (Kilo Tons)
    7. 2.7. Catalytic Reforming Catalysts
      1. 2.7.1. Global Catalytic Reforming Catalysts Market, 2016-2026 (USD Million)
      2. 2.7.2. Global Catalytic Reforming Catalysts Market, 2016-2026 (Kilo Tons)
    8. 2.8. Others
      1. 2.8.1. Global Others Refinery Catalyst Market, 2016-2026 (USD Million)
      2. 2.8.2. Global Others Refinery Catalyst Market, 2016-2026 (Kilo Tons)
  3. CHAPTER 3. Refinery Catalyst market – Material Analysis
    1. 3.1. Global Refinery Catalyst Market – Material Overview
    2. 3.2. Global Refinery Catalyst Market Share, by Material, 2019 & 2026 (USD Million)
    3. 3.3. Global Refinery Catalyst Market share, by Material, 2019 & 2026 (Kilo Tons)
    4. 3.4. Zeolites
      1. 3.4.1. Global Zeolites Refinery Catalyst Market, 2016-2026 (USD Million)
      2. 3.4.2. Global Zeolites Refinery Catalyst Market, 2016-2026 (Kilo Tons)
    5. 3.5. Metals
      1. 3.5.1. Global Metals Refinery Catalyst Market, 2016-2026 (USD Million)
      2. 3.5.2. Global Metals Refinery Catalyst Market, 2016-2026 (Kilo Tons)
    6. 3.6. Chemical Compounds
      1. 3.6.1. Global Chemical Compounds Refinery Catalyst Market, 2016-2026 (USD Million)
      2. 3.6.2. Global Chemical Compounds Refinery Catalyst Market, 2016-2026 (Kilo Tons)
  4. CHAPTER 4. Refinery Catalyst market – Application Analysis
    1. 4.1. Global Refinery Catalyst Market – Application Overview
    2. 4.2. Global Refinery Catalyst Market Share, by Application, 2019 & 2026 (USD Million)
    3. 4.3. Global Refinery Catalyst Market share, by Application, 2019 & 2026 (Kilo Tons)
    4. 4.4. Oil Refinery
      1. 4.4.1. Global Oil Refinery Refinery Catalyst Market, 2016-2026 (USD Million)
      2. 4.4.2. Global Oil Refinery Refinery Catalyst Market, 2016-2026 (Kilo Tons)
    5. 4.5. Chemical Synthesis
      1. 4.5.1. Global Chemical Synthesis Refinery Catalyst Market, 2016-2026 (USD Million)
      2. 4.5.2. Global Chemical Synthesis Refinery Catalyst Market, 2016-2026 (Kilo Tons)
    6. 4.6. Polymer Manufacturing
      1. 4.6.1. Global Polymer Manufacturing Refinery Catalyst Market, 2016-2026 (USD Million)
      2. 4.6.2. Global Polymer Manufacturing Refinery Catalyst Market, 2016-2026 (Kilo Tons)
    7. 4.7. Others
      1. 4.7.1. Global Others Refinery Catalyst Market, 2016-2026 (USD Million)
      2. 4.7.2. Global Others Refinery Catalyst Market, 2016-2026 (Kilo Tons)
  5. CHAPTER 5. Refinery Catalyst market – Regional Analysis
    1. 5.1. Global Refinery Catalyst Market Regional Overview
    2. 5.2. Global Refinery Catalyst Market Share, by Region, 2019 & 2026 (Value)
    3. 5.3. Global Refinery Catalyst Market Share, by Region, 2019 & 2026 (Volume)
    4. 5.4. North America
      1. 5.4.1. North America Refinery Catalyst Market size and forecast, 2016-2026
      2. 5.4.2. North America Refinery Catalyst Market, by Country, 2016 - 2026 (USD Million)
      3. 5.4.3. North America Market size and forecast, 2016-2026 (Kilo Tons)
      4. 5.4.4. North America Refinery Catalyst Market, by Country, 2016 - 2026 (Kilo Tons)
      5. 5.4.5. North America Refinery Catalyst Market, by Type, 2016-2026
        1. 5.4.5.1. North America Refinery Catalyst Market, by Type, 2016-2026 (USD Million)
        2. 5.4.5.2. North America Refinery Catalyst Market, by Type, 2016-2026 (Kilo Tons)
      6. 5.4.6. North America Refinery Catalyst Market, by Material, 2016-2026
        1. 5.4.6.1. North America Refinery Catalyst Market, by Material, 2016-2026 (USD Million)
        2. 5.4.6.2. North America Refinery Catalyst Market, by Material, 2016-2026 (Kilo Tons)
      7. 5.4.7. North America Refinery Catalyst Market, by Application, 2016-2026
        1. 5.4.7.1. North America Refinery Catalyst Market, by Application, 2016-2026 (USD Million)
        2. 5.4.7.2. North America Refinery Catalyst Market, by Application, 2016-2026 (Kilo Tons)
      8. 5.4.8. U.S.
        1. 5.4.8.1. U.S. Market size and forecast, 2016-2026 (USD Million)
        2. 5.4.8.2. U.S. Market size and forecast, 2016-2026 (Kilo Tons)
      9. 5.4.9. Canada
        1. 5.4.9.1. Canada Market size and forecast, 2016-2026 (USD Million)
        2. 5.4.9.2. Canada Market size and forecast, 2016-2026 (Kilo Tons)
    5. 5.5. Europe
      1. 5.5.1. Europe Refinery Catalyst Market size and forecast, 2016-2026
      2. 5.5.2. Europe Refinery Catalyst Market, by Country, 2016 - 2026 (USD Million)
      3. 5.5.3. Europe Market size and forecast, 2016-2026 (Kilo Tons)
      4. 5.5.4. Europe Refinery Catalyst Market, by Country, 2016 - 2026 (Kilo Tons)
      5. 5.5.5. Europe Refinery Catalyst Market, by Type, 2016-2026
        1. 5.5.5.1. Europe Refinery Catalyst Market, by Type, 2016-2026 (USD Million)
        2. 5.5.5.2. Europe Refinery Catalyst Market, by Type, 2016-2026 (Kilo Tons)
      6. 5.5.6. Europe Refinery Catalyst Market, by Material, 2016-2026
        1. 5.5.6.1. Europe Refinery Catalyst Market, by Material, 2016-2026 (USD Million)
        2. 5.5.6.2. Europe Refinery Catalyst Market, by Material, 2016-2026 (Kilo Tons)
      7. 5.5.7. Europe Refinery Catalyst Market, by Application, 2016-2026
        1. 5.5.7.1. Europe Refinery Catalyst Market, by Application, 2016-2026 (USD Million)
        2. 5.5.7.2. Europe Refinery Catalyst Market, by Application, 2016-2026 (Kilo Tons)
      8. 5.5.8. Germany
        1. 5.5.8.1. Germany Market size and forecast, 2016-2026 (USD Million)
        2. 5.5.8.2. Germany Market size and forecast, 2016-2026 (Kilo Tons)
      9. 5.5.9. France
        1. 5.5.9.1. France Market size and forecast, 2016-2026 (USD Million)
        2. 5.5.9.2. France Market size and forecast, 2016-2026 (Kilo Tons)
      10. 5.5.10. U.K.
        1. 5.5.10.1. U.K. Market size and forecast, 2016-2026 (USD Million)
        2. 5.5.10.2. U.K. Market size and forecast, 2016-2026 (Kilo Tons)
      11. 5.5.11. Italy
        1. 5.5.11.1. Italy Market size and forecast, 2016-2026 (USD Million)
        2. 5.5.11.2. Italy Market size and forecast, 2016-2026 (Kilo Tons)
      12. 5.5.12. Spain
        1. 5.5.12.1. Spain Market size and forecast, 2016-2026 (USD Million)
        2. 5.5.12.2. Spain Market size and forecast, 2016-2026 (Kilo Tons)
      13. 5.5.13. Rest of Europe
        1. 5.5.13.1. Rest of Europe Market size and forecast, 2016-2026 (USD Million)
        2. 5.5.13.2. Rest of Europe Market size and forecast, 2016-2026 (Kilo Tons)
    6. 5.6. Asia Pacific
      1. 5.6.1. Asia Pacific Refinery Catalyst Market size and forecast, 2016-2026
      2. 5.6.2. Asia Pacific Refinery Catalyst Market, by Country, 2016 - 2026 (USD Million)
      3. 5.6.3. Asia Pacific Market size and forecast, 2016-2026 (Kilo Tons)
      4. 5.6.4. Asia Pacific Refinery Catalyst Market, by Country, 2016 - 2026 (Kilo Tons)
      5. 5.6.5. Asia Pacific Refinery Catalyst Market, by Type, 2016-2026
        1. 5.6.5.1. Asia Pacific Refinery Catalyst Market, by Type, 2016-2026 (USD Million)
        2. 5.6.5.2. Asia Pacific Refinery Catalyst Market, by Type, 2016-2026 (Kilo Tons)
      6. 5.6.6. Asia Pacific Refinery Catalyst Market, by Material, 2016-2026
        1. 5.6.6.1. Asia Pacific Refinery Catalyst Market, by Material, 2016-2026 (USD Million)
        2. 5.6.6.2. Asia Pacific Refinery Catalyst Market, by Material, 2016-2026 (Kilo Tons)
      7. 5.6.7. Asia Pacific Refinery Catalyst Market, by Application, 2016-2026
        1. 5.6.7.1. Asia Pacific Refinery Catalyst Market, by Application, 2016-2026 (USD Million)
        2. 5.6.7.2. Asia Pacific Refinery Catalyst Market, by Application, 2016-2026 (Kilo Tons)
      8. 5.6.8. China
        1. 5.6.8.1. China Market size and forecast, 2016-2026 (USD Million)
        2. 5.6.8.2. China Market size and forecast, 2016-2026 (Kilo Tons)
      9. 5.6.9. Japan
        1. 5.6.9.1. Japan Market size and forecast, 2016-2026 (USD Million)
        2. 5.6.9.2. Japan Market size and forecast, 2016-2026 (Kilo Tons)
      10. 5.6.10. India
        1. 5.6.10.1. India Market size and forecast, 2016-2026 (USD Million)
        2. 5.6.10.2. India Market size and forecast, 2016-2026 (Kilo Tons)
      11. 5.6.11. South Korea
        1. 5.6.11.1. South Korea Market size and forecast, 2016-2026 (USD Million)
        2. 5.6.11.2. South Korea Market size and forecast, 2016-2026 (Kilo Tons)
      12. 5.6.12. South-East Asia
        1. 5.6.12.1. South-East Asia Market size and forecast, 2016-2026 (USD Million)
        2. 5.6.12.2. South-East Asia Market size and forecast, 2016-2026 (Kilo Tons)
      13. 5.6.13. Rest of Asia Pacific
        1. 5.6.13.1. Rest of Asia Pacific Market size and forecast, 2016-2026 (USD Million)
        2. 5.6.13.2. Rest of Asia Pacific Market size and forecast, 2016-2026 (Kilo Tons)
    7. 5.7. Latin America
      1. 5.7.1. Latin America Refinery Catalyst Market size and forecast, 2016-2026
      2. 5.7.2. Latin America Refinery Catalyst Market, by Country, 2016 - 2026 (USD Million)
      3. 5.7.3. Latin America Market size and forecast, 2016-2026 (Kilo Tons)
      4. 5.7.4. Latin America Refinery Catalyst Market, by Country, 2016 - 2026 (Kilo Tons)
      5. 5.7.5. Latin America Refinery Catalyst Market, by Type, 2016-2026
        1. 5.7.5.1. Latin America Refinery Catalyst Market, by Type, 2016-2026 (USD Million)
        2. 5.7.5.2. Latin America Refinery Catalyst Market, by Type, 2016-2026 (Kilo Tons)
      6. 5.7.6. Latin America Refinery Catalyst Market, by Material, 2016-2026
        1. 5.7.6.1. Latin America Refinery Catalyst Market, by Material, 2016-2026 (USD Million)
        2. 5.7.6.2. Latin America Refinery Catalyst Market, by Material, 2016-2026 (Kilo Tons)
      7. 5.7.7. Latin America Refinery Catalyst Market, by Application, 2016-2026
        1. 5.7.7.1. Latin America Refinery Catalyst Market, by Application, 2016-2026 (USD Million)
        2. 5.7.7.2. Latin America Refinery Catalyst Market, by Application, 2016-2026 (Kilo Tons)
      8. 5.7.8. Brazil
        1. 5.7.8.1. Brazil Market size and forecast, 2016-2026 (USD Million)
        2. 5.7.8.2. Brazil Market size and forecast, 2016-2026 (Kilo Tons)
      9. 5.7.9. Mexico
        1. 5.7.9.1. Mexico Market size and forecast, 2016-2026 (USD Million)
        2. 5.7.9.2. Mexico Market size and forecast, 2016-2026 (Kilo Tons)
      10. 5.7.10. Rest of Latin America
        1. 5.7.10.1. Rest of Latin America Market size and forecast, 2016-2026 (USD Million)
        2. 5.7.10.2. Rest of Latin America Market size and forecast, 2016-2026 (Kilo Tons)
    8. 5.8. The Middle-East and Africa
      1. 5.8.1. The Middle-East and Africa Refinery Catalyst Market size and forecast, 2016-2026
      2. 5.8.2. The Middle-East and Africa Refinery Catalyst Market, by Country, 2016 - 2026 (USD Million)
      3. 5.8.3. The Middle-East and Africa Market size and forecast, 2016-2026 (Kilo Tons)
      4. 5.8.4. The Middle-East and Africa Refinery Catalyst Market, by Country, 2016 - 2026 (Kilo Tons)
      5. 5.8.5. The Middle-East and Africa Refinery Catalyst Market, by Type, 2016-2026
        1. 5.8.5.1. The Middle-East and Africa Refinery Catalyst Market, by Type, 2016-2026 (USD Million)
        2. 5.8.5.2. The Middle-East and Africa Refinery Catalyst Market, by Type, 2016-2026 (Kilo Tons)
      6. 5.8.6. The Middle-East and Africa Refinery Catalyst Market, by Material, 2016-2026
        1. 5.8.6.1. The Middle-East and Africa Refinery Catalyst Market, by Material, 2016-2026 (USD Million)
        2. 5.8.6.2. The Middle-East and Africa Refinery Catalyst Market, by Material, 2016-2026 (Kilo Tons)
      7. 5.8.7. The Middle-East and Africa Refinery Catalyst Market, by Application, 2016-2026
        1. 5.8.7.1. The Middle-East and Africa Refinery Catalyst Market, by Application, 2016-2026 (USD Million)
        2. 5.8.7.2. The Middle-East and Africa Refinery Catalyst Market, by Application, 2016-2026 (Kilo Tons)
      8. 5.8.8. GCC Countries
        1. 5.8.8.1. GCC Countries Market size and forecast, 2016-2026 (USD Million)
        2. 5.8.8.2. GCC Countries Market size and forecast, 2016-2026 (Kilo Tons)
      9. 5.8.9. South Africa
        1. 5.8.9.1. South Africa Market size and forecast, 2016-2026 (USD Million)
        2. 5.8.9.2. South Africa Market size and forecast, 2016-2026 (Kilo Tons)
      10. 5.8.10. Rest of Middle-East Africa
        1. 5.8.10.1. Rest of Middle-East Africa Market size and forecast, 2016-2026 (USD Million)
        2. 5.8.10.2. Rest of Middle-East Africa Market size and forecast, 2016-2026 (Kilo Tons)
  6. CHAPTER 6. Refinery Catalyst Production, Consumption, Export, Import by Regions
    1. 6.1. Global Refinery Catalyst production and revenue, 2016-2026 (USD Million) (Kilo Tons)
    2. 6.2. Global Import and Export Analysis, by Region
  7. CHAPTER 7. Refinery Catalyst market – Competitive Landscape
    1. 7.1. Competitor Market Share – Revenue
    2. 7.2. Market Concentration Rate Analysis, Top 3 and Top 5 Players
    3. 7.3. Competitor Market Share – Volume
    4. 7.4. Strategic Development
      1. 7.4.1. Acquisitions and Mergers
      2. 7.4.2. New Products
      3. 7.4.3. Research & Development Activities
  8. CHAPTER 8. Company Profiles
    1. 8.1. Arkema Group
      1. 8.1.1. Company Overview
      2. 8.1.2. Arkema Group Sales, Revenue, Price, and Gross Margin
      3. 8.1.3. Product portfolio
      4. 8.1.4. Recent initiatives
    2. 8.2. W. R. Grace & Co.
      1. 8.2.1. Company Overview
      2. 8.2.2. W. R. Grace & Co. Sales, Revenue, Price, and Gross Margin
      3. 8.2.3. Product portfolio
      4. 8.2.4. Recent initiatives
    3. 8.3. Honeywell
      1. 8.3.1. Company Overview
      2. 8.3.2. Honeywell Sales, Revenue, Price, and Gross Margin
      3. 8.3.3. Product portfolio
      4. 8.3.4. Recent initiatives
    4. 8.4. Criterion Catalysts & Technologies
      1. 8.4.1. Company Overview
      2. 8.4.2. Criterion Catalysts & Technologies Sales, Revenue, Price, and Gross Margin
      3. 8.4.3. Product portfolio
      4. 8.4.4. Recent initiatives
    5. 8.5. Axens SA
      1. 8.5.1. Company Overview
      2. 8.5.2. Axens SA Sales, Revenue, Price, and Gross Margin
      3. 8.5.3. Product portfolio
      4. 8.5.4. Recent initiatives
    6. 8.6. Haldor Topsoe A/S
      1. 8.6.1. Company Overview
      2. 8.6.2. Haldor Topsoe A/S Sales, Revenue, Price, and Gross Margin
      3. 8.6.3. Product portfolio
      4. 8.6.4. Recent initiatives
    7. 8.7. BASF SE
      1. 8.7.1. Company Overview
      2. 8.7.2. BASF SE Sales, Revenue, Price, and Gross Margin
      3. 8.7.3. Product portfolio
      4. 8.7.4. Recent initiatives
    8. 8.8. China Petroleum & Chemical Corporation
      1. 8.8.1. Company Overview
      2. 8.8.2. China Petroleum & Chemical Corporation Sales, Revenue, Price, and Gross Margin
      3. 8.8.3. Product portfolio
      4. 8.8.4. Recent initiatives
    9. 8.9. Albemarle Corporation
      1. 8.9.1. Company Overview
      2. 8.9.2. Albemarle Corporation Sales, Revenue, Price, and Gross Margin
      3. 8.9.3. Product portfolio
      4. 8.9.4. Recent initiatives
    10. 8.10. Clariant International Ltd.
      1. 8.10.1. Company Overview
      2. 8.10.2. Clariant International Ltd. Sales, Revenue, Price, and Gross Margin
      3. 8.10.3. Product portfolio
      4. 8.10.4. Recent initiatives
    11. 8.11. Chempack
      1. 8.11.1. Company Overview
      2. 8.11.2. Chempack Sales, Revenue, Price, and Gross Margin
      3. 8.11.3. Product portfolio
      4. 8.11.4. Recent initiatives
    12. 8.12. Exxon Mobil Corporation
      1. 8.12.1. Company Overview
      2. 8.12.2. Exxon Mobil Corporation Sales, Revenue, Price, and Gross Margin
      3. 8.12.3. Product portfolio
      4. 8.12.4. Recent initiatives
    13. 8.13. KNT Group
      1. 8.13.1. Company Overview
      2. 8.13.2. KNT Group Sales, Revenue, Price, and Gross Margin
      3. 8.13.3. Product portfolio
      4. 8.13.4. Recent initiatives
    14. 8.14. Others
      1. 8.14.1. Company Overview
      2. 8.14.2. Others Sales, Revenue, Price, and Gross Margin
      3. 8.14.3. Product portfolio
      4. 8.14.4. Recent initiatives
  9. CHAPTER 9. Refinery Catalyst — Industry Analysis
    1. 9.1. Introduction and Taxonomy
    2. 9.2. Refinery Catalyst Market – Key Trends
      1. 9.2.1. Market Drivers
      2. 9.2.2. Market Restraints
      3. 9.2.3. Market Opportunities
    3. 9.3. Value Chain Analysis
    4. 9.4. Key Mandates and Regulations
    5. 9.5. Technology Roadmap and Timeline
    6. 9.6. Refinery Catalyst market – Attractiveness Analysis
      1. 9.6.1. By Type
      2. 9.6.2. By Material
      3. 9.6.3. By Application
      4. 9.6.4. By Region
  10. CHAPTER 10. Raw Material analysis
    1. 10.1. Refinery Catalyst Key Raw Material Analysis
      1. 10.1.1. Key Raw Materials
      2. 10.1.2. Price Trend of Key Raw Materials
    2. 10.2. Key Suppliers of Raw Materials
    3. 10.3. Proportion of Manufacturing Cost Structure
      1. 10.3.1. Raw Materials
      2. 10.3.2. Labor Cost
    4. 10.4. Manufacturing Expenses Analysis of Refinery Catalyst
  11. CHAPTER 11. Industrial Chain, Sourcing Strategy and Downstream Buyers
    1. 11.1. Refinery Catalyst Industrial Chain Analysis
    2. 11.2. Upstream Raw Materials Sourcing
      1. 11.2.1. Risk Mitigation:
      2. 11.2.2. Supplier Relationships:
      3. 11.2.3. Business Processes:
      4. 11.2.4. Securing the Product:
    3. 11.3. Raw Materials Sources of Refinery Catalyst Major Manufacturers in 2016
    4. 11.4. Downstream Buyers
    5. 11.5. Distributors/Traders List
  12. CHAPTER 12. Marketing Strategy Analysis, Distributors
    1. 12.1. Marketing Channel
    2. 12.2. Direct Marketing
    3. 12.3. Indirect Marketing
    4. 12.4. Marketing Channel Development Trend
    5. 12.5. Economic/Political Environmental Change
  13. CHAPTER 13. Report Conclusion
  14. CHAPTER 14. Research Approach & Methodology
    1. 14.1. Report Description
    2. 14.2. Research Scope
    3. 14.3. Research Methodology
      1. 14.3.1. Secondary Research
      2. 14.3.2. Primary Research
      3. 14.3.3. Models
        1. 14.3.3.1. Company Share Analysis Model
        2. 14.3.3.2. Revenue Based Modeling
        3. 14.3.3.3. Research Limitations

        List of Figures

        FIG. 1 Global Refinery Catalyst Market, 2016-2026 (USD Million)
        FIG. 2 Global Refinery Catalyst Market Share, by Type, 2019 & 2026 (USD Million)
        FIG. 3 Global Refinery Catalyst Market share, by Type, 2019 & 2026 (Kilo Tons)
        FIG. 4 Global FCC Catalysts Market, 2016-2026 (USD Million)
        FIG. 5 Global FCC Catalysts  Market, 2016-2026 (Kilo Tons)
        FIG. 6 Global Hydrotreating Catalysts Market, 2016-2026 (USD Million)
        FIG. 7 Global Hydrotreating Catalysts  Market, 2016-2026 (Kilo Tons)
        FIG. 8 Global Hydrocracking Catalysts Market, 2016-2026 (USD Million)
        FIG. 9 Global Hydrocracking Catalysts  Market, 2016-2026 (Kilo Tons)
        FIG. 10 Global Catalytic Reforming Catalysts Market, 2016-2026 (USD Million)
        FIG. 11 Global Catalytic Reforming Catalysts  Market, 2016-2026 (Kilo Tons)
        FIG. 12 Global Others Refinery Catalyst Market, 2016-2026 (USD Million)
        FIG. 13 Global Others Refinery Catalyst  Market, 2016-2026 (Kilo Tons)
        FIG. 14 Global Refinery Catalyst Market Share, by Material, 2019 & 2026 (USD Million)
        FIG. 15 Global Refinery Catalyst Market share, by Material, 2019 & 2026 (Kilo Tons)
        FIG. 16 Global Zeolites Refinery Catalyst Market, 2016-2026 (USD Million)
        FIG. 17 Global Zeolites Refinery Catalyst  Market, 2016-2026 (Kilo Tons)
        FIG. 18 Global Metals Refinery Catalyst Market, 2016-2026 (USD Million)
        FIG. 19 Global Metals Refinery Catalyst  Market, 2016-2026 (Kilo Tons)
        FIG. 20 Global Chemical Compounds Refinery Catalyst Market, 2016-2026 (USD Million)
        FIG. 21 Global Chemical Compounds Refinery Catalyst  Market, 2016-2026 (Kilo Tons)
        FIG. 22 Global Refinery Catalyst Market Share, by Application, 2019 & 2026 (USD Million)
        FIG. 23 Global Refinery Catalyst Market share, by Application, 2019 & 2026 (Kilo Tons)
        FIG. 24 Global Oil Refinery Refinery Catalyst Market, 2016-2026 (USD Million)
        FIG. 25 Global Oil Refinery Refinery Catalyst  Market, 2016-2026 (Kilo Tons)
        FIG. 26 Global Chemical Synthesis Refinery Catalyst Market, 2016-2026 (USD Million)
        FIG. 27 Global Chemical Synthesis Refinery Catalyst  Market, 2016-2026 (Kilo Tons)
        FIG. 28 Global Polymer Manufacturing Refinery Catalyst Market, 2016-2026 (USD Million)
        FIG. 29 Global Polymer Manufacturing Refinery Catalyst  Market, 2016-2026 (Kilo Tons)
        FIG. 30 Global Others Refinery Catalyst Market, 2016-2026 (USD Million)
        FIG. 31 Global Others Refinery Catalyst  Market, 2016-2026 (Kilo Tons)
        FIG. 32 Global Refinery Catalyst Market Share, by Region, 2019 & 2026
        FIG. 33 Global Refinery Catalyst Market Share, by Region, 2019 & 2026
        FIG. 34 North America Refinery Catalyst Market, 2016-2026
        FIG. 35 North America Refinery Catalyst  Market, 2016-2026 (Kilo Tons)
        FIG. 36 U.S. Refinery Catalyst Market, 2016-2026
        FIG. 37 U.S. Refinery Catalyst  Market, 2016-2026 (Kilo Tons)
        FIG. 38 Canada Refinery Catalyst Market, 2016-2026
        FIG. 39 Canada Refinery Catalyst  Market, 2016-2026 (Kilo Tons)
        FIG. 40 Europe Refinery Catalyst Market, 2016-2026
        FIG. 41 Europe Refinery Catalyst  Market, 2016-2026 (Kilo Tons)
        FIG. 42 Germany Refinery Catalyst Market, 2016-2026
        FIG. 43 Germany Refinery Catalyst  Market, 2016-2026 (Kilo Tons)
        FIG. 44 France Refinery Catalyst Market, 2016-2026
        FIG. 45 France Refinery Catalyst  Market, 2016-2026 (Kilo Tons)
        FIG. 46 U.K. Refinery Catalyst Market, 2016-2026
        FIG. 47 U.K. Refinery Catalyst  Market, 2016-2026 (Kilo Tons)
        FIG. 48 Italy Refinery Catalyst Market, 2016-2026
        FIG. 49 Italy Refinery Catalyst  Market, 2016-2026 (Kilo Tons)
        FIG. 50 Spain Refinery Catalyst Market, 2016-2026
        FIG. 51 Spain Refinery Catalyst  Market, 2016-2026 (Kilo Tons)
        FIG. 52 Rest of Europe Refinery Catalyst Market, 2016-2026
        FIG. 53 Rest of Europe Refinery Catalyst  Market, 2016-2026 (Kilo Tons)
        FIG. 54 Asia Pacific Refinery Catalyst Market, 2016-2026
        FIG. 55 Asia Pacific Refinery Catalyst  Market, 2016-2026 (Kilo Tons)
        FIG. 56 China Refinery Catalyst Market, 2016-2026
        FIG. 57 China Refinery Catalyst  Market, 2016-2026 (Kilo Tons)
        FIG. 58 Japan Refinery Catalyst Market, 2016-2026
        FIG. 59 Japan Refinery Catalyst  Market, 2016-2026 (Kilo Tons)
        FIG. 60 India Refinery Catalyst Market, 2016-2026
        FIG. 61 India Refinery Catalyst  Market, 2016-2026 (Kilo Tons)
        FIG. 62 South  Korea Refinery Catalyst Market, 2016-2026
        FIG. 63 South  Korea Refinery Catalyst  Market, 2016-2026 (Kilo Tons)
        FIG. 64 South-East Asia Refinery Catalyst Market, 2016-2026
        FIG. 65 South-East Asia Refinery Catalyst  Market, 2016-2026 (Kilo Tons)
        FIG. 66 Rest of Asia Pacific Refinery Catalyst Market, 2016-2026
        FIG. 67 Rest of Asia Pacific Refinery Catalyst  Market, 2016-2026 (Kilo Tons)
        FIG. 68 Latin America Refinery Catalyst Market, 2016-2026
        FIG. 69 Latin America Refinery Catalyst  Market, 2016-2026 (Kilo Tons)
        FIG. 70 Brazil Refinery Catalyst Market, 2016-2026
        FIG. 71 Brazil Refinery Catalyst  Market, 2016-2026 (Kilo Tons)
        FIG. 72 Mexico Refinery Catalyst Market, 2016-2026
        FIG. 73 Mexico Refinery Catalyst  Market, 2016-2026 (Kilo Tons)
        FIG. 74 Rest of Latin America Refinery Catalyst Market, 2016-2026
        FIG. 75 Rest of Latin America Refinery Catalyst  Market, 2016-2026 (Kilo Tons)
        FIG. 76 The Middle-East and Africa Refinery Catalyst Market, 2016-2026
        FIG. 77 The Middle-East and Africa Refinery Catalyst  Market, 2016-2026 (Kilo Tons)
        FIG. 78 GCC Countries Refinery Catalyst Market, 2016-2026
        FIG. 79 GCC Countries Refinery Catalyst  Market, 2016-2026 (Kilo Tons)
        FIG. 80 South Africa Refinery Catalyst Market, 2016-2026
        FIG. 81 South Africa Refinery Catalyst  Market, 2016-2026 (Kilo Tons)
        FIG. 82 Rest of Middle-East Africa Refinery Catalyst Market, 2016-2026
        FIG. 83 Rest of Middle-East Africa Refinery Catalyst  Market, 2016-2026 (Kilo Tons)
        FIG. 84 Global Refinery Catalyst production and revenue, 2016-2026 (USD Million) (Kilo Tons)
        FIG. 85 North America Refinery Catalyst production and revenue, 2016-2026 (USD Million) (Kilo Tons)
        FIG. 86 Europe Refinery Catalyst production and revenue, 2016-2026 (USD Million) (Kilo Tons)
        FIG. 87 Asia Pacific Refinery Catalyst production and revenue, 2016-2026 (USD Million) (Kilo Tons)
        FIG. 88 Latin America Refinery Catalyst production and revenue, 2016-2026 (USD Million) (Kilo Tons)
        FIG. 89 Middle East and Africa Refinery Catalyst production and revenue, 2016-2026 (USD Million) (Kilo Tons)
        FIG. 90 Competitor Market Share – Revenue
        FIG. 91 Competitor Market Share – Volume
        FIG. 92 Arkema Group Revenue and Growth Rate
        FIG. 93 Arkema Group Market Share
        FIG. 94 W. R. Grace & Co. Revenue and Growth Rate
        FIG. 95 W. R. Grace & Co. Market Share
        FIG. 96 Honeywell Revenue and Growth Rate
        FIG. 97 Honeywell Market Share
        FIG. 98 Criterion Catalysts & Technologies Revenue and Growth Rate
        FIG. 99 Criterion Catalysts & Technologies Market Share
        FIG. 100 Axens SA Revenue and Growth Rate
        FIG. 101 Axens SA Market Share
        FIG. 102 Haldor Topsoe A/S Revenue and Growth Rate
        FIG. 103 Haldor Topsoe A/S Market Share
        FIG. 104 BASF SE Revenue and Growth Rate
        FIG. 105 BASF SE Market Share
        FIG. 106 China Petroleum & Chemical Corporation Revenue and Growth Rate
        FIG. 107 China Petroleum & Chemical Corporation Market Share
        FIG. 108 Albemarle Corporation Revenue and Growth Rate
        FIG. 109 Albemarle Corporation Market Share
        FIG. 110 Clariant International Ltd. Revenue and Growth Rate
        FIG. 111 Clariant International Ltd. Market Share
        FIG. 112 Chempack Revenue and Growth Rate
        FIG. 113 Chempack Market Share
        FIG. 114 Exxon Mobil Corporation Revenue and Growth Rate
        FIG. 115 Exxon Mobil Corporation Market Share
        FIG. 116 KNT Group Revenue and Growth Rate
        FIG. 117 KNT Group Market Share
        FIG. 118 Others Revenue and Growth Rate
        FIG. 119 Others Market Share
        FIG. 120 Market Dynamics
        FIG. 121 Global Refinery Catalyst – Value Chain Analysis
        FIG. 122 Key Mandates and Regulations
        FIG. 123 Technology Roadmap and Timeline
        FIG. 124 Market Attractiveness Analysis – By Type
        FIG. 125 Market Attractiveness Analysis – By Material
        FIG. 126 Market Attractiveness Analysis – By Application
        FIG. 127 Market Attractiveness Analysis – By Region
        FIG. 128 Manufacturing Cost Structure of Refinery Catalyst
        FIG. 129 Refinery Catalyst Industrial Chain Analysis
        FIG. 130 Market Channel
        FIG. 131 Marketing Channel Development Trend
        FIG. 132 Growth in World Gross Product, 2008-2018

        List of Tables

        TABLE 1 Global Refinery Catalyst market, 2019 & 2026 (USD Million)
        TABLE 2 Global Refinery Catalyst market, by Type, 2016-2026 (USD Million)
        TABLE 3 Global Refinery Catalyst market, by Type, 2016-2026 (Kilo Tons)
        TABLE 4 Global Refinery Catalyst market, by Material, 2016-2026 (USD Million)
        TABLE 5 Global Refinery Catalyst market, by Material, 2016-2026 (Kilo Tons)
        TABLE 6 Global Refinery Catalyst market, by Application, 2016-2026 (USD Million)
        TABLE 7 Global Refinery Catalyst market, by Application, 2016-2026 (Kilo Tons)
        TABLE 8 Global Refinery Catalyst market, by region, 2016-2026 (USD Million)
        TABLE 9 Global Refinery Catalyst market, by region, 2016-2026 (Kilo Tons)
        TABLE 10 North America Refinery Catalyst Market, by Type, 2016-2026 (USD Million)
        TABLE 11 North America Refinery Catalyst Market, by Type, 2016-2026 (Kilo Tons)
        TABLE 12 North America Refinery Catalyst Market, by Material, 2016-2026 (USD Million)
        TABLE 13 North America Refinery Catalyst Market, by Material, 2016-2026 (Kilo Tons)
        TABLE 14 North America Refinery Catalyst Market, by Application, 2016-2026 (USD Million)
        TABLE 15 North America Refinery Catalyst Market, by Application, 2016-2026 (Kilo Tons)
        TABLE 16 Europe Refinery Catalyst Market, by Type, 2016-2026 (USD Million)
        TABLE 17 Europe Refinery Catalyst Market, by Type, 2016-2026 (Kilo Tons)
        TABLE 18 Europe Refinery Catalyst Market, by Material, 2016-2026 (USD Million)
        TABLE 19 Europe Refinery Catalyst Market, by Material, 2016-2026 (Kilo Tons)
        TABLE 20 Europe Refinery Catalyst Market, by Application, 2016-2026 (USD Million)
        TABLE 21 Europe Refinery Catalyst Market, by Application, 2016-2026 (Kilo Tons)
        TABLE 22 Asia Pacific Refinery Catalyst Market, by Type, 2016-2026 (USD Million)
        TABLE 23 Asia Pacific Refinery Catalyst Market, by Type, 2016-2026 (Kilo Tons)
        TABLE 24 Asia Pacific Refinery Catalyst Market, by Material, 2016-2026 (USD Million)
        TABLE 25 Asia Pacific Refinery Catalyst Market, by Material, 2016-2026 (Kilo Tons)
        TABLE 26 Asia Pacific Refinery Catalyst Market, by Application, 2016-2026 (USD Million)
        TABLE 27 Asia Pacific Refinery Catalyst Market, by Application, 2016-2026 (Kilo Tons)
        TABLE 28 Latin America Refinery Catalyst Market, by Type, 2016-2026 (USD Million)
        TABLE 29 Latin America Refinery Catalyst Market, by Type, 2016-2026 (Kilo Tons)
        TABLE 30 Latin America Refinery Catalyst Market, by Material, 2016-2026 (USD Million)
        TABLE 31 Latin America Refinery Catalyst Market, by Material, 2016-2026 (Kilo Tons)
        TABLE 32 Latin America Refinery Catalyst Market, by Application, 2016-2026 (USD Million)
        TABLE 33 Latin America Refinery Catalyst Market, by Application, 2016-2026 (Kilo Tons)
        TABLE 34 The Middle-East and Africa Refinery Catalyst Market, by Type, 2016-2026 (USD Million)
        TABLE 35 The Middle-East and Africa Refinery Catalyst Market, by Type, 2016-2026 (Kilo Tons)
        TABLE 36 The Middle-East and Africa Refinery Catalyst Market, by Material, 2016-2026 (USD Million)
        TABLE 37 The Middle-East and Africa Refinery Catalyst Market, by Material, 2016-2026 (Kilo Tons)
        TABLE 38 The Middle-East and Africa Refinery Catalyst Market, by Application, 2016-2026 (USD Million)
        TABLE 39 The Middle-East and Africa Refinery Catalyst Market, by Application, 2016-2026 (Kilo Tons)
        TABLE 40 North America Refinery Catalyst Production, Consumption, Export, Import, 2016-2019
        TABLE 41 Europe Refinery Catalyst Production, Consumption, Export, Import, 2016-2019
        TABLE 42 Asia Pacific Refinery Catalyst Production, Consumption, Export, Import, 2016-2019
        TABLE 43 Latin America Refinery Catalyst Production, Consumption, Export, Import, 2016-2019
        TABLE 44 The Middle East & Africa Refinery Catalyst Production, Consumption, Export, Import, 2016-2019
        TABLE 45 Global Refinery Catalyst Market - Company Revenue Analysis 2016-2019 (USD Million)
        TABLE 46 Global Refinery Catalyst Market - Company Revenue Share Analysis 2016-2019(%)
        TABLE 47 Global Refinery Catalyst Market - Company Volume Analysis 2016-2019 (Kilo Tons)
        TABLE 48 Global Refinery Catalyst Market - Company Volume Share Analysis 2016-2019(%)
        TABLE 49 Acquisitions and Mergers
        TABLE 50 New Product/Service Launch
        TABLE 51 Research & Development Activities
        TABLE 52 Market Drivers
        TABLE 53 Market Restraints
        TABLE 54 Market Opportunities
        TABLE 55 Production Base and Market Concentration Rate of Raw Material
        TABLE 56 Key Suppliers of Raw Materials
        TABLE 57 Raw Materials Sources of Refinery Catalyst Major Manufacturers in 2016
        TABLE 58 Major Buyers of Refinery Catalyst
        TABLE 59 Distributors/Traders of Refinery Catalyst by Region

Industry Major Market Players

  • Arkema Group
  •  W. R. Grace & Co.
  •  Honeywell
  •  Criterion Catalysts & Technologies
  •  Axens SA
  •  HaldorTopsoe A/S
  • China Petroleum & Chemical Corporation
  • Albemarle Corporation
  • Clariant International Ltd
  • Chempack
  • Exxon Mobil Corporation
  • KNT Group
  • BASF SE