Search Market Research Report

Discover Our Latest Reports
Discover Our Featured Reports
Discover Top Selling Reports

Recycled Glass Market Size, Share Global Analysis Report, 2020–2026

report img

Recycled Glass Market By Source (Deposit program, Drop off/buy back centers, Curbside pickups) By Product (Glass Cullet, Glass Fines) and By Application (Bottles & Containers, Fiberglass Insulation, Abrasives, Others): Global Industry Outlook, Market Size, Business Intelligence, Consumer Preferences, Statistical Surveys, Comprehensive Analysis, Historical Developments, Current Trends, and Forecast 2020–2026

Industry Insights

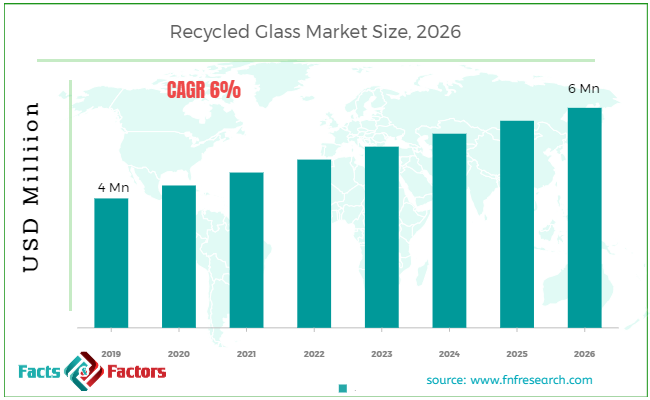
[162+ Pages Report] According to the report published by Facts Factors, the global recycled glass market size was worth around USD 4 million in 2019 and is predicted to grow to around USD 6 million by 2026 with a compound annual growth rate (CAGR) of roughly 6% between 2020 and 2026. The report analyzes the global recycled glass market drivers, restraints/challenges, and the effect they have on the demands during the projection period. In addition, the report explores emerging opportunities in the recycled glass market.

Recycled Glass Market Size

To know more about this report | Request Free Sample Copy

This specialized and expertise-oriented industry research report scrutinizes the technical and commercial business outlook of the Recycled Glass industry. The report analyzes and declares the historical and current trends analysis of the Recycled Glass industry and subsequently recommends the projected trends anticipated to be observed in the Recycled Glass market during the upcoming years.

The Recycled Glass market report analyzes and notifies the industry statistics at the global as well as regional and country levels in order to acquire a thorough perspective of the entire Recycled Glass market. The historical and past insights are provided for FY 2016 to FY 2019 whereas projected trends are delivered for FY 2020 to FY 2026. The quantitative and numerical data is represented in terms of both volume (Kilo Tons) and value (USD Million) from FY 2016 – 2026.


logoKey Insights from Primary Research

  • As per the details shared by our primary respondents, the recycled glass market is set to grow at a CAGR of around 6%
  • Through these details shared, it was established that the recycled glass market was valued at around USD 4 Million in 2019.
  • The “Drop off/buy back centers” category, on the basis of source segmentation, is expected to be the leading revenue-generating category.
  • On the basis of product segmentation, the “Glass cullet” is expected to share the maximum revenue.
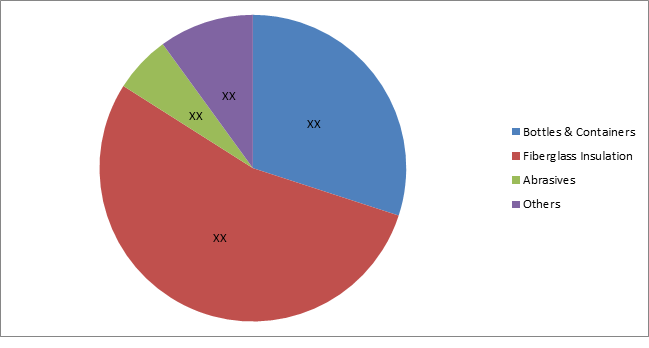
  • On the basis of application segmentation, the “fiberglass insulation” category is expected to have the maximum revenue share.

logoKey Recommendations from Analysts

  • As per our analysts, the recycled glass industry is a growing industry owing to the rising awareness among the people related to the benefits of using recycled glass which costs less as compared with a new glass and also owing to its recycling properties.
  • As the recycling process is considered to be complicated, the recycling units must come up with easy recycling techniques that would save time and energy and lead to more recycling of glass.
  • Growing at a CAGR around 6%, the recycled glass market provides various opportunities for all of the involved investors across the entire value chain.
  • As recycled glass can be used for multiple applications, it gives immense opportunities for the manufacturers in designing more innovative products in order to encourage the consumers in buying recycled glass products and recycle the waste glass products that they have.
  • Our analysts have identified “Bottles and Containers” categories as the leading investment pockets for recycled glass market in terms of application segment owing to the rise in the food & beverage industry across the globe.

logoMarket Attractiveness – By Application

Recycled Glass Market

To know more about this report | Request Free Sample Copy


The quantitative data is further underlined and reinforced by comprehensive qualitative data which comprises various across-the-board market dynamics. The rationales which directly or indirectly impact the Recycled Glass industry are exemplified through parameters such as growth drivers, restraints, challenges, and opportunities among other impacting factors.

Throughout our research report, we have encompassed all the proven models and tools of industry analysis and extensively illustrated all the key business strategies and business models adopted in the Recycled Glass industry. The report provides an all-inclusive and detailed competitive landscape prevalent in the Recycled Glass market.

The report utilizes established industry analysis tools and models such as Porter’s Five Forces framework to analyze and recognize critical business strategies adopted by various stakeholders involved in the entire value chain of the Recycled Glass industry. The Recycled Glass market report additionally employs SWOT analysis and PESTLE analysis models for further in-depth analysis.

The report study further includes an in-depth analysis of industry players' market shares and provides an overview of leading players' market position in the Recycled Glass sector. Key strategic developments in the Recycled Glass market competitive landscape such as acquisitions & mergers, inaugurations of different products and services, partnerships & joint ventures, MoU agreements, VC & funding activities, R&D activities, and geographic expansion among other noteworthy activities by key players of the Recycled Glass market are appropriately highlighted in the report.

Rising awareness among people about global warming and climate change is the key reason why the recycled glass industry is motivated with the growing amount of glass waste in landfill sites, which, in effect, adds to the production of greenhouse gasses and other environmental contaminants that are detrimental for all living things. Consumers across the globe are getting gradually aware of the benefits of using recycled products and are motivated towards using products that are eco friendly such as recycled glass. Recycled glass can be used for multiple applications such as abrasives, filtrations, insulations, bottles, piping, kitchen tiles.

The Recycled Glass market research report delivers an acute valuation and taxonomy of the Recycled Glass industry by practically splitting the market on the basis of different types, applications, and regions. Through the analysis of the historical and projected trends, all the segments and sub-segments were evaluated through the bottom-up approach, and different market sizes have been projected for FY 2020 to FY 2026.

logoReport Scope

Report Attribute

Details

Market Size in 2019

USD 4 Million

Projected Market Size in 2026

USD 6 Million

CAGR Growth Rate

6% CAGR

Base Year

2019

Forecast Years

2020-2026

Key Market Players

Strategic Materials Inc, ACE Glass Recycling, Balcones Resources, Gallo Glass Company, Ripple Glass, Pace Glass Inc, Momentum Recycling LLC, 2M Ressources Inc, CAP Glass, Bradish Glass Inc, Dlubak Glass Company, and Others

Key Segment

By Source, Product, Application, and Region

Major Regions Covered

North America, Europe, Asia Pacific, Latin America, and the Middle East & Africa

Purchase Options

Request customized purchase options to meet your research needs. Explore purchase options

The regional segmentation of the Recycled Glass industry includes the complete classification of all the major continents including North America, Latin America, Europe, Asia Pacific, and the Middle East & Africa. Further, country-wise data for the Recycled Glass industry is provided for the leading economies of the world.

The Recycled Glass market is segmented based on Source, Product, and Application. On the basis of Source segmentation, the market is classified into Deposit program Drop off/buyback centers and Curbside pickups. On the basis of product segmentation, the market is divided into Glass Cullet and Glass Fines. In terms of Application segmentation, the market is bifurcated into Bottles & Containers, Fiberglass Insulation, Abrasives, and Others.

logoSome of the essential players operating in the Recycled Glass market, but not restricted to include

  •  Strategic Materials Inc
  •  ACE Glass Recycling
  •  Balcones Resources
  •  Gallo Glass Company
  •  Ripple Glass
  •  Pace Glass Inc
  •  Momentum Recycling LLC
  •  2M Ressources Inc
  •  CAP Glass
  •  Bradish Glass Inc
  •  Dlubak Glass Company.

The taxonomy of the Recycled Glass industry by its scope and segmentation is as follows:

logo By Source Segmentation Analysis (Customizable)

  • Deposit program
  • Drop off/buy back centers
  • Curbside pickups

logo By Product Segmentation Analysis (Customizable)

  • Glass Cullet
  • Glass Fines

logo By Application Segmentation Analysis (Customizable)

  • Bottles & Containers
  • Fiberglass Insulation
  • Abrasives
  • Others

logo Regional Segmentation Analysis (Customizable)

  • North America
    • The U.S.
    • Canada
  • Europe
    • Germany
    • The UK
    • France
    • Spain
    • Italy
    • Rest of Europe
  • Asia Pacific
    • China
    • Japan
    • India
    • South Korea
    • Southeast Asia
    • Rest of Asia Pacific
  • Latin America
    • Brazil
    • Mexico
    • Rest of Latin America
  • Middle East & Africa
    • GCC
    • South Africa
    • Rest of Middle East & Africa

Table of Content

  1. CHAPTER 1. Executive Summary
  2. CHAPTER 2. Recycled Glass market – Source Analysis
    1. 2.1. Global Recycled Glass Market – Source Overview
    2. 2.2. Global Recycled Glass Market Share, by Source, 2018 & 2025 (USD Million)
    3. 2.3. Global Recycled Glass Market share, by Source, 2018 & 2025 (Kilo Tons)
    4. 2.4. Deposit program
      1. 2.4.1. Global Deposit program Recycled Glass Market, 2016-2026 (USD Million)
      2. 2.4.2. Global Deposit program Recycled Glass Market, 2016-2026 (Kilo Tons)
    5. 2.5. Drop off/buy back centers
      1. 2.5.1. Global Drop off/buy back centers Recycled Glass Market, 2016-2026 (USD Million)
      2. 2.5.2. Global Drop off/buy back centers Recycled Glass Market, 2016-2026 (Kilo Tons)
    6. 2.6. Curbside pickups
      1. 2.6.1. Global Curbside pickups Recycled Glass Market, 2016-2026 (USD Million)
      2. 2.6.2. Global Curbside pickups Recycled Glass Market, 2016-2026 (Kilo Tons)
  3. CHAPTER 3. Recycled Glass market – Product Analysis
    1. 3.1. Global Recycled Glass Market – Product Overview
    2. 3.2. Global Recycled Glass Market Share, by Product, 2018 & 2025 (USD Million)
    3. 3.3. Global Recycled Glass Market share, by Product, 2018 & 2025 (Kilo Tons)
    4. 3.4. Glass Cullet
      1. 3.4.1. Global Glass Cullet Recycled Glass Market, 2016-2026 (USD Million)
      2. 3.4.2. Global Glass Cullet Recycled Glass Market, 2016-2026 (Kilo Tons)
    5. 3.5. Glass Fines
      1. 3.5.1. Global Glass Fines Recycled Glass Market, 2016-2026 (USD Million)
      2. 3.5.2. Global Glass Fines Recycled Glass Market, 2016-2026 (Kilo Tons)
  4. CHAPTER 4. Recycled Glass market – Application Analysis
    1. 4.1. Global Recycled Glass Market – Application Overview
    2. 4.2. Global Recycled Glass Market Share, by Application, 2018 & 2025 (USD Million)
    3. 4.3. Global Recycled Glass Market share, by Application, 2018 & 2025 (Kilo Tons)
    4. 4.4. Bottles & Containers
      1. 4.4.1. Global Bottles & Containers Recycled Glass Market, 2016-2026 (USD Million)
      2. 4.4.2. Global Bottles & Containers Recycled Glass Market, 2016-2026 (Kilo Tons)
    5. 4.5. Fiberglass Insulation
      1. 4.5.1. Global Fiberglass Insulation Recycled Glass Market, 2016-2026 (USD Million)
      2. 4.5.2. Global Fiberglass Insulation Recycled Glass Market, 2016-2026 (Kilo Tons)
    6. 4.6. Abrasives
      1. 4.6.1. Global Abrasives Recycled Glass Market, 2016-2026 (USD Million)
      2. 4.6.2. Global Abrasives Recycled Glass Market, 2016-2026 (Kilo Tons)
    7. 4.7. Others
      1. 4.7.1. Global Others Recycled Glass Market, 2016-2026 (USD Million)
      2. 4.7.2. Global Others Recycled Glass Market, 2016-2026 (Kilo Tons)
  5. CHAPTER 5. Recycled Glass market – Regional Analysis
    1. 5.1. Global Recycled Glass Market Regional Overview
    2. 5.2. Global Recycled Glass Market Share, by Region, 2018 & 2025 (Value)
    3. 5.3. Global Recycled Glass Market Share, by Region, 2018 & 2025 (Volume)
    4. 5.4. North America
      1. 5.4.1. North America Recycled Glass Market size and forecast, 2016-2026
      2. 5.4.2. North America Recycled Glass Market, by Country, 2018 - 2025 (USD Million)
      3. 5.4.3. North America Market size and forecast, 2016-2026 (Kilo Tons)
      4. 5.4.4. North America Recycled Glass Market, by Country, 2018 - 2025 (Kilo Tons)
      5. 5.4.5. North America Recycled Glass Market, by Source, 2016-2026
      6. 5.4.6. North America Recycled Glass Market, by Product, 2016-2026
      7. 5.4.7. North America Recycled Glass Market, by Application, 2016-2026
      8. 5.4.8. U.S.
      9. 5.4.9. Canada
    5. 5.5. Europe
      1. 5.5.1. Europe Recycled Glass Market size and forecast, 2016-2026
      2. 5.5.2. Europe Recycled Glass Market, by Country, 2018 - 2025 (USD Million)
      3. 5.5.3. Europe Market size and forecast, 2016-2026 (Kilo Tons)
      4. 5.5.4. Europe Recycled Glass Market, by Country, 2018 - 2025 (Kilo Tons)
      5. 5.5.5. Europe Recycled Glass Market, by Source, 2016-2026
      6. 5.5.6. Europe Recycled Glass Market, by Product, 2016-2026
      7. 5.5.7. Europe Recycled Glass Market, by Application, 2016-2026
      8. 5.5.8. Germany
      9. 5.5.9. France
      10. 5.5.10. U.K.
      11. 5.5.11. Italy
      12. 5.5.12. Spain
      13. 5.5.13. Rest of Europe
    6. 5.6. Asia Pacific
      1. 5.6.1. Asia Pacific Recycled Glass Market size and forecast, 2016-2026
      2. 5.6.2. Asia Pacific Recycled Glass Market, by Country, 2018 - 2025 (USD Million)
      3. 5.6.3. Asia Pacific Market size and forecast, 2016-2026 (Kilo Tons)
      4. 5.6.4. Asia Pacific Recycled Glass Market, by Country, 2018 - 2025 (Kilo Tons)
      5. 5.6.5. Asia Pacific Recycled Glass Market, by Source, 2016-2026
      6. 5.6.6. Asia Pacific Recycled Glass Market, by Product, 2016-2026
      7. 5.6.7. Asia Pacific Recycled Glass Market, by Application, 2016-2026
      8. 5.6.8. China
      9. 5.6.9. Japan
      10. 5.6.10. India
      11. 5.6.11. South Korea
      12. 5.6.12. South-East Asia
      13. 5.6.13. Rest of Asia Pacific
    7. 5.7. Latin America
      1. 5.7.1. Latin America Recycled Glass Market size and forecast, 2016-2026
      2. 5.7.2. Latin America Recycled Glass Market, by Country, 2018 - 2025 (USD Million)
      3. 5.7.3. Latin America Market size and forecast, 2016-2026 (Kilo Tons)
      4. 5.7.4. Latin America Recycled Glass Market, by Country, 2018 - 2025 (Kilo Tons)
      5. 5.7.5. Latin America Recycled Glass Market, by Source, 2016-2026
      6. 5.7.6. Latin America Recycled Glass Market, by Product, 2016-2026
      7. 5.7.7. Latin America Recycled Glass Market, by Application, 2016-2026
      8. 5.7.8. Brazil
      9. 5.7.9. Mexico
      10. 5.7.10. Rest of Latin America
    8. 5.8. The Middle-East and Africa
      1. 5.8.1. The Middle-East and Africa Recycled Glass Market size and forecast, 2016-2026
      2. 5.8.2. The Middle-East and Africa Recycled Glass Market, by Country, 2018 - 2025 (USD Million)
      3. 5.8.3. The Middle-East and Africa Market size and forecast, 2016-2026 (Kilo Tons)
      4. 5.8.4. The Middle-East and Africa Recycled Glass Market, by Country, 2018 - 2025 (Kilo Tons)
      5. 5.8.5. The Middle-East and Africa Recycled Glass Market, by Source, 2016-2026
      6. 5.8.6. The Middle-East and Africa Recycled Glass Market, by Product, 2016-2026
      7. 5.8.7. The Middle-East and Africa Recycled Glass Market, by Application, 2016-2026
      8. 5.8.8. GCC Countries
      9. 5.8.9. South Africa
      10. 5.8.10. Rest of Middle-East Africa
  6. CHAPTER 6. Recycled Glass Production, Consumption, Export, Import by Regions
    1. 6.1. Global Recycled Glass production and revenue, 2015-2025 (USD Million) (Kilo Tons)
    2. 6.2. Global Import and Export Analysis, by Region
  7. CHAPTER 7. Recycled Glass market – Competitive Landscape
    1. 7.1. Competitor Market Share – Revenue
    2. 7.2. Market Concentration Rate Analysis, Top 3 and Top 5 Players
    3. 7.3. Competitor Market Share – Volume
    4. 7.4. Strategic Development
      1. 7.4.1. Acquisitions and Mergers
      2. 7.4.2. New Products
      3. 7.4.3. Research & Development Activities
  8. CHAPTER 8. Company Profiles
    1. 8.1. Strategic Materials Inc
      1. 8.1.1. Company Overview
      2. 8.1.2. Strategic Materials Inc Sales, Revenue, Price, and Gross Margin
      3. 8.1.3. Product portfolio
      4. 8.1.4. Recent initiatives
    2. 8.2. ACE Glass Recycling
      1. 8.2.1. Company Overview
      2. 8.2.2. ACE Glass Recycling Sales, Revenue, Price, and Gross Margin
      3. 8.2.3. Product portfolio
      4. 8.2.4. Recent initiatives
    3. 8.3. Balcones Resources
      1. 8.3.1. Company Overview
      2. 8.3.2. Balcones Resources Sales, Revenue, Price, and Gross Margin
      3. 8.3.3. Product portfolio
      4. 8.3.4. Recent initiatives
    4. 8.4. Gallo Glass Company
      1. 8.4.1. Company Overview
      2. 8.4.2. Gallo Glass Company Sales, Revenue, Price, and Gross Margin
      3. 8.4.3. Product portfolio
      4. 8.4.4. Recent initiatives
    5. 8.5. Ripple Glass
      1. 8.5.1. Company Overview
      2. 8.5.2. Ripple Glass Sales, Revenue, Price, and Gross Margin
      3. 8.5.3. Product portfolio
      4. 8.5.4. Recent initiatives
    6. 8.6. Pace Glass Inc
      1. 8.6.1. Company Overview
      2. 8.6.2. Pace Glass Inc Sales, Revenue, Price, and Gross Margin
      3. 8.6.3. Product portfolio
      4. 8.6.4. Recent initiatives
    7. 8.7. Momentum Recycling LLC
      1. 8.7.1. Company Overview
      2. 8.7.2. Momentum Recycling LLC Sales, Revenue, Price, and Gross Margin
      3. 8.7.3. Product portfolio
      4. 8.7.4. Recent initiatives
    8. 8.8. 2M Ressources Inc
      1. 8.8.1. Company Overview
      2. 8.8.2. 2M Ressources Inc Sales, Revenue, Price, and Gross Margin
      3. 8.8.3. Product portfolio
      4. 8.8.4. Recent initiatives
    9. 8.9. CAP Glass
      1. 8.9.1. Company Overview
      2. 8.9.2. CAP Glass Sales, Revenue, Price, and Gross Margin
      3. 8.9.3. Product portfolio
      4. 8.9.4. Recent initiatives
    10. 8.10. Bradish Glass Inc
      1. 8.10.1. Company Overview
      2. 8.10.2. Bradish Glass Inc Sales, Revenue, Price, and Gross Margin
      3. 8.10.3. Product portfolio
      4. 8.10.4. Recent initiatives
    11. 8.11. Dlubak Glass Company
      1. 8.11.1. Company Overview
      2. 8.11.2. Dlubak Glass Company Sales, Revenue, Price, and Gross Margin
      3. 8.11.3. Product portfolio
      4. 8.11.4. Recent initiatives
  9. CHAPTER 9. Recycled Glass — Industry Analysis
    1. 9.1. Introduction and Taxonomy
    2. 9.2. Recycled Glass Market – Key Trends
      1. 9.2.1. Market Drivers
      2. 9.2.2. Market Restraints
      3. 9.2.3. Market Opportunities
    3. 9.3. Value Chain Analysis
    4. 9.4. Key Mandates and Regulations
    5. 9.5. Technology Roadmap and Timeline
    6. 9.6. Recycled Glass market – Attractiveness Analysis
      1. 9.6.1. By Source
      2. 9.6.2. By Product
      3. 9.6.3. By Application
      4. 9.6.4. By Region
  10. CHAPTER 10. Raw Material analysis
    1. 10.1. Recycled Glass Key Raw Material Analysis
      1. 10.1.1. Key Raw Materials
      2. 10.1.2. Price Trend of Key Raw Materials
    2. 10.2. Key Suppliers of Raw Materials
    3. 10.3. Proportion of Manufacturing Cost Structure
      1. 10.3.1. Raw Materials
      2. 10.3.2. Labor Cost
    4. 10.4. Manufacturing Expenses Analysis of Recycled Glass
  11. CHAPTER 11. Industrial Chain, Sourcing Strategy and Downstream Buyers
    1. 11.1. Recycled Glass Industrial Chain Analysis
    2. 11.2. Upstream Raw Materials Sourcing
      1. 11.2.1. Risk Mitigation:
      2. 11.2.2. Supplier Relationships:
      3. 11.2.3. Business Processes:
      4. 11.2.4. Securing the Product:
    3. 11.3. Raw Materials Sources of Recycled Glass Major Manufacturers in 2016
    4. 11.4. Downstream Buyers
    5. 11.5. Distributors/Traders List
  12. CHAPTER 12. Marketing Strategy Analysis, Distributors
    1. 12.1. Marketing Channel
    2. 12.2. Direct Marketing
    3. 12.3. Indirect Marketing
    4. 12.4. Marketing Channel Development Trend
    5. 12.5. Economic/Political Environmental Change
  13. CHAPTER 13. Report Conclusion
  14. CHAPTER 14. Research Approach & Methodology
    1. 14.1. Report Description
    2. 14.2. Research Scope
    3. 14.3. Research Methodology
      1. 14.3.1. Secondary Research
      2. 14.3.2. Primary Research
      3. 14.3.3. Models

  • List of Figures

    FIG. 1 Global Recycled Glass Market, 2016-2026 (USD Million)
    FIG. 2 Global Recycled Glass Market Share, by Source, 2018 & 2025 (USD Million)
    FIG. 3 Global Recycled Glass Market share, by Source, 2018 & 2025 (Kilo Tons)
    FIG. 4 Global Deposit program Recycled Glass Market, 2016-2026 (USD Million)
    FIG. 5 Global Deposit program Recycled Glass  Market, 2016-2026 (Kilo Tons)
    FIG. 6 Global  Drop off/buy back centers Recycled Glass Market, 2016-2026 (USD Million)
    FIG. 7 Global  Drop off/buy back centers Recycled Glass  Market, 2016-2026 (Kilo Tons)
    FIG. 8 Global Curbside pickups Recycled Glass Market, 2016-2026 (USD Million)
    FIG. 9 Global Curbside pickups Recycled Glass  Market, 2016-2026 (Kilo Tons)
    FIG. 10 Global Recycled Glass Market Share, by Product, 2018 & 2025 (USD Million)
    FIG. 11 Global Recycled Glass Market share, by Product, 2018 & 2025 (Kilo Tons)
    FIG. 12 Global Glass Cullet Recycled Glass Market, 2016-2026 (USD Million)
    FIG. 13 Global Glass Cullet Recycled Glass  Market, 2016-2026 (Kilo Tons)
    FIG. 14 Global Glass Fines Recycled Glass Market, 2016-2026 (USD Million)
    FIG. 15 Global Glass Fines Recycled Glass  Market, 2016-2026 (Kilo Tons)
    FIG. 16 Global Recycled Glass Market Share, by Application, 2018 & 2025 (USD Million)
    FIG. 17 Global Recycled Glass Market share, by Application, 2018 & 2025 (Kilo Tons)
    FIG. 18 Global Bottles & Containers Recycled Glass Market, 2016-2026 (USD Million)
    FIG. 19 Global Bottles & Containers Recycled Glass  Market, 2016-2026 (Kilo Tons)
    FIG. 20 Global Fiberglass Insulation Recycled Glass Market, 2016-2026 (USD Million)
    FIG. 21 Global Fiberglass Insulation Recycled Glass  Market, 2016-2026 (Kilo Tons)
    FIG. 22 Global Abrasives Recycled Glass Market, 2016-2026 (USD Million)
    FIG. 23 Global Abrasives Recycled Glass  Market, 2016-2026 (Kilo Tons)
    FIG. 24 Global Others Recycled Glass Market, 2016-2026 (USD Million)
    FIG. 25 Global Others Recycled Glass  Market, 2016-2026 (Kilo Tons)
    FIG. 26 Global Recycled Glass Market Share, by Region, 2018 & 2025
    FIG. 27 Global Recycled Glass Market Share, by Region, 2018 & 2025
    FIG. 28 North America Recycled Glass Market, 2016-2026
    FIG. 29 North America Recycled Glass  Market, 2016-2026 (Kilo Tons)
    FIG. 30 U.S. Recycled Glass Market, 2016-2026
    FIG. 31 U.S. Recycled Glass  Market, 2016-2026 (Kilo Tons)
    FIG. 32 Canada Recycled Glass Market, 2016-2026
    FIG. 33 Canada Recycled Glass  Market, 2016-2026 (Kilo Tons)
    FIG. 34 Europe Recycled Glass Market, 2016-2026
    FIG. 35 Europe Recycled Glass  Market, 2016-2026 (Kilo Tons)
    FIG. 36 Germany Recycled Glass Market, 2016-2026
    FIG. 37 Germany Recycled Glass  Market, 2016-2026 (Kilo Tons)
    FIG. 38 France Recycled Glass Market, 2016-2026
    FIG. 39 France Recycled Glass  Market, 2016-2026 (Kilo Tons)
    FIG. 40 U.K. Recycled Glass Market, 2016-2026
    FIG. 41 U.K. Recycled Glass  Market, 2016-2026 (Kilo Tons)
    FIG. 42 Italy Recycled Glass Market, 2016-2026
    FIG. 43 Italy Recycled Glass  Market, 2016-2026 (Kilo Tons)
    FIG. 44 Spain Recycled Glass Market, 2016-2026
    FIG. 45 Spain Recycled Glass  Market, 2016-2026 (Kilo Tons)
    FIG. 46 Rest of Europe Recycled Glass Market, 2016-2026
    FIG. 47 Rest of Europe Recycled Glass  Market, 2016-2026 (Kilo Tons)
    FIG. 48 Asia Pacific Recycled Glass Market, 2016-2026
    FIG. 49 Asia Pacific Recycled Glass  Market, 2016-2026 (Kilo Tons)
    FIG. 50 China Recycled Glass Market, 2016-2026
    FIG. 51 China Recycled Glass  Market, 2016-2026 (Kilo Tons)
    FIG. 52 Japan Recycled Glass Market, 2016-2026
    FIG. 53 Japan Recycled Glass  Market, 2016-2026 (Kilo Tons)
    FIG. 54 India Recycled Glass Market, 2016-2026
    FIG. 55 India Recycled Glass  Market, 2016-2026 (Kilo Tons)
    FIG. 56 South  Korea Recycled Glass Market, 2016-2026
    FIG. 57 South  Korea Recycled Glass  Market, 2016-2026 (Kilo Tons)
    FIG. 58 South-East Asia Recycled Glass Market, 2016-2026
    FIG. 59 South-East Asia Recycled Glass  Market, 2016-2026 (Kilo Tons)
    FIG. 60 Rest of Asia Pacific Recycled Glass Market, 2016-2026
    FIG. 61 Rest of Asia Pacific Recycled Glass  Market, 2016-2026 (Kilo Tons)
    FIG. 62 Latin America Recycled Glass Market, 2016-2026
    FIG. 63 Latin America Recycled Glass  Market, 2016-2026 (Kilo Tons)
    FIG. 64 Brazil Recycled Glass Market, 2016-2026
    FIG. 65 Brazil Recycled Glass  Market, 2016-2026 (Kilo Tons)
    FIG. 66 Mexico Recycled Glass Market, 2016-2026
    FIG. 67 Mexico Recycled Glass  Market, 2016-2026 (Kilo Tons)
    FIG. 68 Rest of Latin America Recycled Glass Market, 2016-2026
    FIG. 69 Rest of Latin America Recycled Glass  Market, 2016-2026 (Kilo Tons)
    FIG. 70 The Middle-East and Africa Recycled Glass Market, 2016-2026
    FIG. 71 The Middle-East and Africa Recycled Glass  Market, 2016-2026 (Kilo Tons)
    FIG. 72 GCC Countries Recycled Glass Market, 2016-2026
    FIG. 73 GCC Countries Recycled Glass  Market, 2016-2026 (Kilo Tons)
    FIG. 74 South Africa Recycled Glass Market, 2016-2026
    FIG. 75 South Africa Recycled Glass  Market, 2016-2026 (Kilo Tons)
    FIG. 76 Rest of Middle-East Africa Recycled Glass Market, 2016-2026
    FIG. 77 Rest of Middle-East Africa Recycled Glass  Market, 2016-2026 (Kilo Tons)
    FIG. 78 Global Recycled Glass production and revenue, 2015-2025 (USD Million) (Kilo Tons)
    FIG. 79 North America Recycled Glass production and revenue, 2015-2025 (USD Million) (Kilo Tons)
    FIG. 80 Europe Recycled Glass production and revenue, 2015-2025 (USD Million) (Kilo Tons)
    FIG. 81 Asia Pacific Recycled Glass production and revenue, 2015-2025 (USD Million) (Kilo Tons)
    FIG. 82 Latin America Recycled Glass production and revenue, 2015-2025 (USD Million) (Kilo Tons)
    FIG. 83 Middle East and Africa Recycled Glass production and revenue, 2015-2025 (USD Million) (Kilo Tons)
    FIG. 84 Competitor Market Share – Revenue
    FIG. 85 Competitor Market Share – Volume
    FIG. 86 Strategic Materials Inc Revenue and Growth Rate
    FIG. 87 Strategic Materials Inc Market Share
    FIG. 88 ACE Glass Recycling Revenue and Growth Rate
    FIG. 89 ACE Glass Recycling Market Share
    FIG. 90 Balcones Resources Revenue and Growth Rate
    FIG. 91 Balcones Resources Market Share
    FIG. 92 Gallo Glass Company Revenue and Growth Rate
    FIG. 93 Gallo Glass Company Market Share
    FIG. 94 Ripple Glass Revenue and Growth Rate
    FIG. 95 Ripple Glass Market Share
    FIG. 96 Pace Glass Inc Revenue and Growth Rate
    FIG. 97 Pace Glass Inc Market Share
    FIG. 98 Momentum Recycling LLC Revenue and Growth Rate
    FIG. 99 Momentum Recycling LLC Market Share
    FIG. 100 2M Ressources Inc Revenue and Growth Rate
    FIG. 101 2M Ressources Inc Market Share
    FIG. 102 CAP Glass Revenue and Growth Rate
    FIG. 103 CAP Glass Market Share
    FIG. 104 Bradish Glass Inc Revenue and Growth Rate
    FIG. 105 Bradish Glass Inc Market Share
    FIG. 106 Dlubak Glass Company Revenue and Growth Rate
    FIG. 107 Dlubak Glass Company Market Share
    FIG. 108 Market Dynamics
    FIG. 109 Global Recycled Glass – Value Chain Analysis
    FIG. 110 Key Mandates and Regulations
    FIG. 111 Technology Roadmap and Timeline
    FIG. 112 Market Attractiveness Analysis – By Source
    FIG. 113 Market Attractiveness Analysis – By Product
    FIG. 114 Market Attractiveness Analysis – By Application
    FIG. 115 Market Attractiveness Analysis – By Region
    FIG. 116 Manufacturing Cost Structure of Recycled Glass
    FIG. 117 Recycled Glass Industrial Chain Analysis
    FIG. 118 Market Channel
    FIG. 119 Marketing Channel Development Trend
    FIG. 120 Growth in World Gross Product, 2008-2018

    List of Tables

    TABLE 1 Global Recycled Glass market, 2018 & 2025 (USD Million)
    TABLE 2 Global Recycled Glass market, by Source, 2016-2026 (USD Million)
    TABLE 3 Global Recycled Glass market, by Source, 2016-2026 (Kilo Tons)
    TABLE 4 Global Recycled Glass market, by Product, 2016-2026 (USD Million)
    TABLE 5 Global Recycled Glass market, by Product, 2016-2026 (Kilo Tons)
    TABLE 6 Global Recycled Glass market, by Application, 2016-2026 (USD Million)
    TABLE 7 Global Recycled Glass market, by Application, 2016-2026 (Kilo Tons)
    TABLE 8 Global Recycled Glass market, by region, 2016-2026 (USD Million)
    TABLE 9 Global Recycled Glass market, by region, 2016-2026 (Kilo Tons)
    TABLE 10 North America Recycled Glass Market, by Source, 2016-2026 (USD Million)
    TABLE 11 North America Recycled Glass Market, by Source, 2016-2026 (Kilo Tons)
    TABLE 12 North America Recycled Glass Market, by Product, 2016-2026 (USD Million)
    TABLE 13 North America Recycled Glass Market, by Product, 2016-2026 (Kilo Tons)
    TABLE 14 North America Recycled Glass Market, by Application, 2016-2026 (USD Million)
    TABLE 15 North America Recycled Glass Market, by Application, 2016-2026 (Kilo Tons)
    TABLE 16 Europe Recycled Glass Market, by Source, 2016-2026 (USD Million)
    TABLE 17 Europe Recycled Glass Market, by Source, 2016-2026 (Kilo Tons)
    TABLE 18 Europe Recycled Glass Market, by Product, 2016-2026 (USD Million)
    TABLE 19 Europe Recycled Glass Market, by Product, 2016-2026 (Kilo Tons)
    TABLE 20 Europe Recycled Glass Market, by Application, 2016-2026 (USD Million)
    TABLE 21 Europe Recycled Glass Market, by Application, 2016-2026 (Kilo Tons)
    TABLE 22 Asia Pacific Recycled Glass Market, by Source, 2016-2026 (USD Million)
    TABLE 23 Asia Pacific Recycled Glass Market, by Source, 2016-2026 (Kilo Tons)
    TABLE 24 Asia Pacific Recycled Glass Market, by Product, 2016-2026 (USD Million)
    TABLE 25 Asia Pacific Recycled Glass Market, by Product, 2016-2026 (Kilo Tons)
    TABLE 26 Asia Pacific Recycled Glass Market, by Application, 2016-2026 (USD Million)
    TABLE 27 Asia Pacific Recycled Glass Market, by Application, 2016-2026 (Kilo Tons)
    TABLE 28 Latin America Recycled Glass Market, by Source, 2016-2026 (USD Million)
    TABLE 29 Latin America Recycled Glass Market, by Source, 2016-2026 (Kilo Tons)
    TABLE 30 Latin America Recycled Glass Market, by Product, 2016-2026 (USD Million)
    TABLE 31 Latin America Recycled Glass Market, by Product, 2016-2026 (Kilo Tons)
    TABLE 32 Latin America Recycled Glass Market, by Application, 2016-2026 (USD Million)
    TABLE 33 Latin America Recycled Glass Market, by Application, 2016-2026 (Kilo Tons)
    TABLE 34 The Middle-East and Africa Recycled Glass Market, by Source, 2016-2026 (USD Million)
    TABLE 35 The Middle-East and Africa Recycled Glass Market, by Source, 2016-2026 (Kilo Tons)
    TABLE 36 The Middle-East and Africa Recycled Glass Market, by Product, 2016-2026 (USD Million)
    TABLE 37 The Middle-East and Africa Recycled Glass Market, by Product, 2016-2026 (Kilo Tons)
    TABLE 38 The Middle-East and Africa Recycled Glass Market, by Application, 2016-2026 (USD Million)
    TABLE 39 The Middle-East and Africa Recycled Glass Market, by Application, 2016-2026 (Kilo Tons)
    TABLE 40 North America Recycled Glass Production, Consumption, Export, Import, 2016-2019
    TABLE 41 Europe Recycled Glass Production, Consumption, Export, Import, 2016-2019
    TABLE 42 Asia Pacific Recycled Glass Production, Consumption, Export, Import, 2016-2019
    TABLE 43 Latin America Recycled Glass Production, Consumption, Export, Import, 2016-2019
    TABLE 44 Middle East & Africa Recycled Glass Production, Consumption, Export, Import, 2016-2019
    TABLE 45 Global Recycled Glass Market - Company Revenue Analysis 2016-2019 (USD Million)
    TABLE 46 Global Recycled Glass Market - Company Revenue Share Analysis 2016-2019(%)
    TABLE 47 Global Recycled Glass Market - Company Volume Analysis 2016-2019 (Kilo Tons)
    TABLE 48 Global Recycled Glass Market - Company Volume Share Analysis 2016-2019(%)
    TABLE 49 Acquisitions and Mergers
    TABLE 50 New Product/Service Launch
    TABLE 51 Research & Development Activities
    TABLE 52 Market Drivers
    TABLE 53 Market Restraints
    TABLE 54 Market Opportunities
    TABLE 55 Production Base and Market Concentration Rate of Raw Material
    TABLE 56 Key Suppliers of Raw Materials
    TABLE 57 Raw Materials Sources of Recycled Glass Major Manufacturers in 2016
    TABLE 58 Major Buyers of Recycled Glass
    TABLE 59 Distributors/Traders of Recycled Glass by Region
  •  

    Industry Major Market Players

    •  Strategic Materials Inc
    •  ACE Glass Recycling
    •  Balcones Resources
    •  Gallo Glass Company
    •  Ripple Glass
    •  Pace Glass Inc
    •  Momentum Recycling LLC
    •  2M Ressources Inc
    •  CAP Glass
    •  Bradish Glass Inc
    •  Dlubak Glass Company.