Search Market Research Report

Discover Our Latest Reports
Discover Our Featured Reports
Discover Top Selling Reports

Raised Access Floor Market Size, Share Global Analysis Report, 2019–2026

report img

Raised Access Floor Market By Type (Calcium Sulphate Board, Steel Encapsulated, Aluminium Board, Chipboard Encapsulated, and others) and By End-Users (Technical Facilities, Commercial Office Space, Nonprofit Management, and Others): Global Industry Perspective, Market Size, Statistical Research, Market Intelligence, Comprehensive Analysis, Historical Trends, and Forecast 2019–2026

Industry Insights

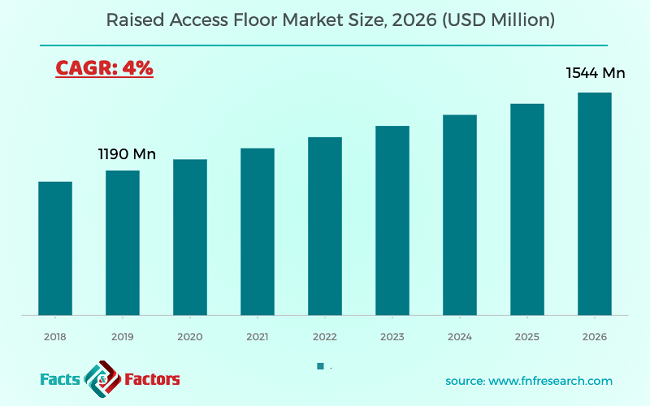
[110+ Pages Report] According to the report published by Facts Factors, the global raised access floor market size was worth around USD 1,190 million in 2019 and is predicted to grow to around USD 1,544 million by 2026 with a compound annual growth rate (CAGR) of roughly 4% between 2020 and 2026. The report analyzes the global raised access floor market drivers, restraints/challenges, and the effect they have on the demands during the projection period. In addition, the report explores emerging opportunities in the raised access floor market.

Raised Access Floor Market

To know more about this report | Request Free Sample Copy

This professional and specialized report study examines the technical and business perspective of the Raised Access Floor industry. The report provides a historical analysis of the industry as well as the projected trends expected to be witnessed in the Raised Access Floor market. The report study analyzes the market statistics at the global as well as regional levels to gain an in-depth perspective of the overall raised access floor market. The historical insights are provided from 2016 to 2019 and projected trends are provided from 2020 to 2026. The quantitative data is provided in terms of both volume (Units) and value (USD Million) for 2016 – 2026. The qualitative data is reinforced by analyzing and providing numerous market dynamics (directly or indirectly affecting the industry) such as growth drivers, restraints, challenges, and opportunities.

We have included various industry analysis models in our report and extensively demonstrated the key business strategies and competitive landscape of the Raised Access Floor market in our study.

Our study also includes an analysis of Porter’s Five Forces framework for understanding the competitive strategies adopted by various stakeholders involved in the entire value chain of the Raised Access Floor market. It also encompasses PESTLE analysis and SWOT analysis.


logoKey Insights from Primary Research

  • As per our primary respondents, the raised access floors market is set to grow annually at a rate of around 4%
  • It was established through primary research that the raised access floors market was valued at around USD 1,148 Million in 2018
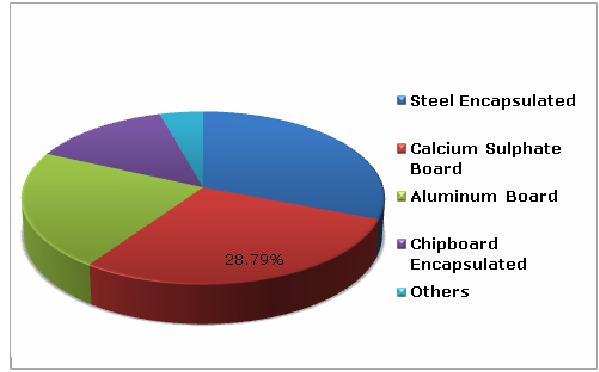
  • The “steel encapsulated” category, on the basis of type segmentation, was the leading revenue-generating category accounting for around USD 355 Million, in 2018
  • On the basis of end-user segmentation, the “technical facilities” category held the leading revenue of USD 405 Million, in 2018

logoKey Recommendations from Analysts

  • As per our analysts, raised access floor provides consumers with stability, safety, durability, and security which has surged the target market growth.
  • Europe is anticipated to contribute around USD 600 Million in 2026 to the global raised access floor market.
  • Growing at a CAGR of around 4%, raised access floors market provides numerous opportunities for all of the involved stakeholders across the entire value chain
  • Our analysts have identified “steel encapsulated” and “technical facilities” categories as the leading investment pockets for raised access floors market in terms of type and end-user segmentations respectively
  • Global raised access floor market is expected to generate revenue of around USD 1,544 Million in 2026.

logoMarket Value Share, by Type – By Type

Raised Access Floor Market

To know more about this report | Request Free Sample Copy


The report also offers an in-depth analysis of the market shares of each industry player and gives an outline of the market position of key players in the Raised Access Floor market. Moreover, the study offers wide coverage of key strategic advances witnessed in the market such as new product launches, acquisitions & mergers, collaborations & joint ventures, funding & VC activities, agreements, partnerships, R&D activities, and regional expansion of key players of the Raised Access Floor market.

The research study provides a critical assessment of the Raised Access Floor industry by logically segmenting the market on the basis of Type, Application, and regions. Based on the past, present, and future trends, all the segments were analyzed from the bottom up, and the market sizes have been estimated from 2020 to 2026. The regional segmentation of the Raised Access Floor industry includes the holistic bifurcation of all the five major continents including North America, Europe, Asia Pacific, Latin America, and Middle East & Africa.

Raised access floors deliver floor stability, safety, durability, and security for cable management, which has surged the target market growth. Also, rising investment in command centers is expected to boost the target market growth over the forecast period. Moreover, these floors are versatile which has been a factor for augmenting the target market growth. In addition, raised access floors promote a more comfortable living environment as well as lower the costs of maintaining regular floors substantially. This factor has increased the target market growth as well. Moreover, such floors ensure easier and more aesthetically pleasing access to key facilities and services.

The demand and price for raised access floors across the globe fluctuate drastically. 2018 was another rollercoaster year for raised access floors markets. The target market generated revenue of around USSD 1,148 Million. The number is expected to increase till 2026. The raised access floor is anticipated to generate revenue of around USD 1,544 Million in 2026.

The Raised Access Floor market is segmented based on Type and Application.  On the basis of type segmentation, the market is classified into Covered Hair Raised Access Floor, Hair Extension, and Others. In terms of Application segmentation, the market is bifurcated into Women and Men.

logoReport Scope

Report Attribute

Details

Market Size in 2019

USD 1,190 Million

Projected Market Size in 2026

USD 1,544 Million

CAGR Growth Rate

4% CAGR

Base Year

2019

Forecast Years

2020-2026

Key Market Players

Haworth, Polygroup, PORCELANOSA, Lenzlinger, Kingspan, Veitchi Flooring, Bathgate Flooring, MERO-TSK, and Others

Key Segment

By Type, End-Users, and Region

Major Regions Covered

North America, Europe, Asia Pacific, Latin America, and the Middle East & Africa

Purchase Options

Request customized purchase options to meet your research needs.Explore purchase options

logoSome of the leading players in the global market include

  • Haworth
  • Polygroup
  • PORCELANOSA
  • Lenzlinger
  • Kingspan
  • Veitchi Flooring
  • Bathgate Flooring
  • MERO-TSK

The taxonomy of the Raised Access Floor market by its scope and segmentation is as follows:

logoBy Type Segmentation Analysis

  • Calcium Sulphate Board
  • Steel Encapsulated
  • Aluminium Board
  • Chipboard Encapsulated
  • Others

logoBy End-user Segmentation Analysis

  • Technical Facilities
  • Commercial Office Space
  • Nonprofit Management
  • Others

logoBy Regional Segmentation Analysis

  • North America
    • The U.S.
    • Canada
  • Europe
    • France
    • The UK
    • Spain
    • Germany
    • Italy
    • Rest of Europe
  • Asia Pacific
    • China
    • Japan
    • India
    • South Korea
    • Southeast Asia
    • Rest of Asia Pacific
  • Latin America
    • Brazil
    • Mexico
    • Rest of Latin America
  • Middle East & Africa
    • GCC
    • South Africa
    • Rest of Middle East & Africa

logoKEY BUSINESS POINTERS ADDRESSED & FOREMOST REASONS TO PROCURE THE REPORT:

  • Statistical Analysis of the Past, Current, and Future Trends of the Industry with Validated Market Sizes Data
  • Direct and Indirect Rationales Impacting the Industry
  • In-depth and Micro Analysis of Viable Segments and Sub-segments
  • Companies and Vendors Market Share, Competitive Landscape, and Player Positioning Analysis
  • Demand Side (Consumption) and Supply Side (Production) Perspective and Analysis wherever applicable
  • Key Buyers and End-Users Analysis
  • Value Chain and Manufacturing Cost Structure Analysis wherever relevant
  • Key Marketing Strategies as well as Key Sales Channels adopted in the market
  • Investment Opportunity Analysis & Patents Analysis wherever feasible
  • Technological Road Map & Technical Analysis
  • Robust Research Methodology comprising dynamic mix (65%~35%) of Extensive Primary Research (primary interviews, ad-hoc surveys, questionnaires) and Protracted Secondary Research (proprietary in-house database, paid external databases, publically available validated sources)

Table of Content

  1. CHAPTER 1. Executive Summary
  2. CHAPTER 2. Raised Access Floor market – Type Analysis
    1. 2.1. Global Raised Access Floor Market – Type Overview
    2. 2.2. Global Raised Access Floor Market Share, by Type, 2018 & 2025 (USD Million)
    3. 2.3. Global Raised Access Floor Market share, by Type, 2018 & 2025 (Thousand Sq. Meter)
    4. 2.4. Steel Encapsulated
      1. 2.4.1. Global Steel Encapsulated Raised Access Floor Market, 2016-2026 (USD Million)
      2. 2.4.2. Global Steel Encapsulated Raised Access Floor Market, 2016-2026 (Thousand Sq. Meter)
    5. 2.5. Calcium Sulphate Board
      1. 2.5.1. Global Calcium Sulphate Board Raised Access Floor Market, 2016-2026 (USD Million)
      2. 2.5.2. Global Calcium Sulphate Board Raised Access Floor Market, 2016-2026 (Thousand Sq. Meter)
    6. 2.6. Aluminium Board
      1. 2.6.1. Global Aluminium Board Raised Access Floor Market, 2016-2026 (USD Million)
      2. 2.6.2. Global Aluminium Board Raised Access Floor Market, 2016-2026 (Thousand Sq. Meter)
    7. 2.7. Chipboard Encapsulated
      1. 2.7.1. Global Chipboard Encapsulated Raised Access Floor Market, 2016-2026 (USD Million)
      2. 2.7.2. Global Chipboard Encapsulated Raised Access Floor Market, 2016-2026 (Thousand Sq. Meter)
    8. 2.8. Others
      1. 2.8.1. Global Others Raised Access Floor Market, 2016-2026 (USD Million)
      2. 2.8.2. Global Others Raised Access Floor Market, 2016-2026 (Thousand Sq. Meter)
  3. CHAPTER 3. Raised Access Floor market – End-users Analysis
    1. 3.1. Global Raised Access Floor Market – End-users Overview
    2. 3.2. Global Raised Access Floor Market Share, by End-users, 2018 & 2025 (USD Million)
    3. 3.3. Global Raised Access Floor Market share, by End-users, 2018 & 2025 (Thousand Sq. Meter)
    4. 3.4. Technical Facilities
      1. 3.4.1. Global Technical Facilities Raised Access Floor Market, 2016-2026 (USD Million)
      2. 3.4.2. Global Technical Facilities Raised Access Floor Market, 2016-2026 (Thousand Sq. Meter)
    5. 3.5. Commercial Office Space
      1. 3.5.1. Global Commercial Office Space Raised Access Floor Market, 2016-2026 (USD Million)
      2. 3.5.2. Global Commercial Office Space Raised Access Floor Market, 2016-2026 (Thousand Sq. Meter)
    6. 3.6. Nonprofit Management
      1. 3.6.1. Global Nonprofit Management Raised Access Floor Market, 2016-2026 (USD Million)
      2. 3.6.2. Global Nonprofit Management Raised Access Floor Market, 2016-2026 (Thousand Sq. Meter)
    7. 3.7. Others
      1. 3.7.1. Global Others Raised Access Floor Market, 2016-2026 (USD Million)
      2. 3.7.2. Global Others Raised Access Floor Market, 2016-2026 (Thousand Sq. Meter)
  4. CHAPTER 4. Raised Access Floor market – Regional Analysis
    1. 4.1. Global Raised Access Floor Market Regional Overview
    2. 4.2. Global Raised Access Floor Market Share, by Region, 2018 & 2025 (Value)
    3. 4.3. Global Raised Access Floor Market Share, by Region, 2018 & 2025 (Volume)
    4. 4.4. North America
      1. 4.4.1. North America Raised Access Floor Market size and forecast, 2016-2026
      2. 4.4.2. North America Raised Access Floor Market, by Country, 2018 - 2025 (USD Million)
      3. 4.4.3. North America Market size and forecast, 2016-2026 (Thousand Sq. Meter)
      4. 4.4.4. North America Raised Access Floor Market, by Country, 2018 - 2025 (Thousand Sq. Meter)
      5. 4.4.5. North America Raised Access Floor Market, by Type, 2016-2026
        1. 4.4.5.1. North America Raised Access Floor Market, by Type, 2016-2026 (USD Million)
        2. 4.4.5.2. North America Raised Access Floor Market, by Type, 2016-2026 (Thousand Sq. Meter)
      6. 4.4.6. North America Raised Access Floor Market, by End-users, 2016-2026
        1. 4.4.6.1. North America Raised Access Floor Market, by End-users, 2016-2026 (USD Million)
        2. 4.4.6.2. North America Raised Access Floor Market, by End-users, 2016-2026 (Thousand Sq. Meter)
      7. 4.4.7. U.S.
        1. 4.4.7.1. U.S. Market size and forecast, 2016-2026 (USD Million)
        2. 4.4.7.2. U.S. Market size and forecast, 2016-2026 (Thousand Sq. Meter)
      8. 4.4.8. Canada
        1. 4.4.8.1. Canada Market size and forecast, 2016-2026 (USD Million)
        2. 4.4.8.2. Canada Market size and forecast, 2016-2026 (Thousand Sq. Meter)
    5. 4.5. Europe
      1. 4.5.1. Europe Raised Access Floor Market size and forecast, 2016-2026
      2. 4.5.2. Europe Raised Access Floor Market, by Country, 2018 - 2025 (USD Million)
      3. 4.5.3. Europe Market size and forecast, 2016-2026 (Thousand Sq. Meter)
      4. 4.5.4. Europe Raised Access Floor Market, by Country, 2018 - 2025 (Thousand Sq. Meter)
      5. 4.5.5. Europe Raised Access Floor Market, by Type, 2016-2026
        1. 4.5.5.1. Europe Raised Access Floor Market, by Type, 2016-2026 (USD Million)
        2. 4.5.5.2. Europe Raised Access Floor Market, by Type, 2016-2026 (Thousand Sq. Meter)
      6. 4.5.6. Europe Raised Access Floor Market, by End-users, 2016-2026
        1. 4.5.6.1. Europe Raised Access Floor Market, by End-users, 2016-2026 (USD Million)
        2. 4.5.6.2. Europe Raised Access Floor Market, by End-users, 2016-2026 (Thousand Sq. Meter)
      7. 4.5.7. Germany
        1. 4.5.7.1. Germany Market size and forecast, 2016-2026 (USD Million)
        2. 4.5.7.2. Germany Market size and forecast, 2016-2026 (Thousand Sq. Meter)
      8. 4.5.8. France
        1. 4.5.8.1. France Market size and forecast, 2016-2026 (USD Million)
        2. 4.5.8.2. France Market size and forecast, 2016-2026 (Thousand Sq. Meter)
      9. 4.5.9. U.K.
        1. 4.5.9.1. U.K. Market size and forecast, 2016-2026 (USD Million)
        2. 4.5.9.2. U.K. Market size and forecast, 2016-2026 (Thousand Sq. Meter)
      10. 4.5.10. Italy
        1. 4.5.10.1. Italy Market size and forecast, 2016-2026 (USD Million)
        2. 4.5.10.2. Italy Market size and forecast, 2016-2026 (Thousand Sq. Meter)
      11. 4.5.11. Spain
        1. 4.5.11.1. Spain Market size and forecast, 2016-2026 (USD Million)
        2. 4.5.11.2. Spain Market size and forecast, 2016-2026 (Thousand Sq. Meter)
      12. 4.5.12. Rest of Europe
        1. 4.5.12.1. Rest of Europe Market size and forecast, 2016-2026 (USD Million)
        2. 4.5.12.2. Rest of Europe Market size and forecast, 2016-2026 (Thousand Sq. Meter)
    6. 4.6. Asia Pacific
      1. 4.6.1. Asia Pacific Raised Access Floor Market size and forecast, 2016-2026
      2. 4.6.2. Asia Pacific Raised Access Floor Market, by Country, 2018 - 2025 (USD Million)
      3. 4.6.3. Asia Pacific Market size and forecast, 2016-2026 (Thousand Sq. Meter)
      4. 4.6.4. Asia Pacific Raised Access Floor Market, by Country, 2018 - 2025 (Thousand Sq. Meter)
      5. 4.6.5. Asia Pacific Raised Access Floor Market, by Type, 2016-2026
        1. 4.6.5.1. Asia Pacific Raised Access Floor Market, by Type, 2016-2026 (USD Million)
        2. 4.6.5.2. Asia Pacific Raised Access Floor Market, by Type, 2016-2026 (Thousand Sq. Meter)
      6. 4.6.6. Asia Pacific Raised Access Floor Market, by End-users, 2016-2026
        1. 4.6.6.1. Asia Pacific Raised Access Floor Market, by End-users, 2016-2026 (USD Million)
        2. 4.6.6.2. Asia Pacific Raised Access Floor Market, by End-users, 2016-2026 (Thousand Sq. Meter)
      7. 4.6.7. China
        1. 4.6.7.1. China Market size and forecast, 2016-2026 (USD Million)
        2. 4.6.7.2. China Market size and forecast, 2016-2026 (Thousand Sq. Meter)
      8. 4.6.8. Japan
        1. 4.6.8.1. Japan Market size and forecast, 2016-2026 (USD Million)
        2. 4.6.8.2. Japan Market size and forecast, 2016-2026 (Thousand Sq. Meter)
      9. 4.6.9. India
        1. 4.6.9.1. India Market size and forecast, 2016-2026 (USD Million)
        2. 4.6.9.2. India Market size and forecast, 2016-2026 (Thousand Sq. Meter)
      10. 4.6.10. South Korea
        1. 4.6.10.1. South Korea Market size and forecast, 2016-2026 (USD Million)
        2. 4.6.10.2. South Korea Market size and forecast, 2016-2026 (Thousand Sq. Meter)
      11. 4.6.11. South-East Asia
        1. 4.6.11.1. South-East Asia Market size and forecast, 2016-2026 (USD Million)
        2. 4.6.11.2. South-East Asia Market size and forecast, 2016-2026 (Thousand Sq. Meter)
      12. 4.6.12. Rest of Asia Pacific
        1. 4.6.12.1. Rest of Asia Pacific Market size and forecast, 2016-2026 (USD Million)
        2. 4.6.12.2. Rest of Asia Pacific Market size and forecast, 2016-2026 (Thousand Sq. Meter)
    7. 4.7. Latin America
      1. 4.7.1. Latin America Raised Access Floor Market size and forecast, 2016-2026
      2. 4.7.2. Latin America Raised Access Floor Market, by Country, 2018 - 2025 (USD Million)
      3. 4.7.3. Latin America Market size and forecast, 2016-2026 (Thousand Sq. Meter)
      4. 4.7.4. Latin America Raised Access Floor Market, by Country, 2018 - 2025 (Thousand Sq. Meter)
      5. 4.7.5. Latin America Raised Access Floor Market, by Type, 2016-2026
        1. 4.7.5.1. Latin America Raised Access Floor Market, by Type, 2016-2026 (USD Million)
        2. 4.7.5.2. Latin America Raised Access Floor Market, by Type, 2016-2026 (Thousand Sq. Meter)
      6. 4.7.6. Latin America Raised Access Floor Market, by End-users, 2016-2026
        1. 4.7.6.1. Latin America Raised Access Floor Market, by End-users, 2016-2026 (USD Million)
        2. 4.7.6.2. Latin America Raised Access Floor Market, by End-users, 2016-2026 (Thousand Sq. Meter)
      7. 4.7.7. Brazil
        1. 4.7.7.1. Brazil Market size and forecast, 2016-2026 (USD Million)
        2. 4.7.7.2. Brazil Market size and forecast, 2016-2026 (Thousand Sq. Meter)
      8. 4.7.8. Mexico
        1. 4.7.8.1. Mexico Market size and forecast, 2016-2026 (USD Million)
        2. 4.7.8.2. Mexico Market size and forecast, 2016-2026 (Thousand Sq. Meter)
      9. 4.7.9. Rest of Latin America
        1. 4.7.9.1. Rest of Latin America Market size and forecast, 2016-2026 (USD Million)
        2. 4.7.9.2. Rest of Latin America Market size and forecast, 2016-2026 (Thousand Sq. Meter)
    8. 4.8. The Middle-East and Africa
      1. 4.8.1. The Middle-East and Africa Raised Access Floor Market size and forecast, 2016-2026
      2. 4.8.2. The Middle-East and Africa Raised Access Floor Market, by Country, 2018 - 2025 (USD Million)
      3. 4.8.3. The Middle-East and Africa Market size and forecast, 2016-2026 (Thousand Sq. Meter)
      4. 4.8.4. The Middle-East and Africa Raised Access Floor Market, by Country, 2018 - 2025 (Thousand Sq. Meter)
      5. 4.8.5. The Middle-East and Africa Raised Access Floor Market, by Type, 2016-2026
        1. 4.8.5.1. The Middle-East and Africa Raised Access Floor Market, by Type, 2016-2026 (USD Million)
        2. 4.8.5.2. The Middle-East and Africa Raised Access Floor Market, by Type, 2016-2026 (Thousand Sq. Meter)
      6. 4.8.6. The Middle-East and Africa Raised Access Floor Market, by End-users, 2016-2026
        1. 4.8.6.1. The Middle-East and Africa Raised Access Floor Market, by End-users, 2016-2026 (USD Million)
        2. 4.8.6.2. The Middle-East and Africa Raised Access Floor Market, by End-users, 2016-2026 (Thousand Sq. Meter)
      7. 4.8.7. GCC Countries
        1. 4.8.7.1. GCC Countries Market size and forecast, 2016-2026 (USD Million)
        2. 4.8.7.2. GCC Countries Market size and forecast, 2016-2026 (Thousand Sq. Meter)
      8. 4.8.8. South Africa
        1. 4.8.8.1. South Africa Market size and forecast, 2016-2026 (USD Million)
        2. 4.8.8.2. South Africa Market size and forecast, 2016-2026 (Thousand Sq. Meter)
      9. 4.8.9. Rest of Middle-East Africa
        1. 4.8.9.1. Rest of Middle-East Africa Market size and forecast, 2016-2026 (USD Million)
        2. 4.8.9.2. Rest of Middle-East Africa Market size and forecast, 2016-2026 (Thousand Sq. Meter)
  5. CHAPTER 5. Raised Access Floor Production, Consumption, Export, Import by Regions
    1. 5.1. Global Raised Access Floor production and revenue, 2015-2025 (USD Million) (Thousand Sq. Meter)
    2. 5.2. Global Import and Export Analysis, by Region
  6. CHAPTER 6. Raised Access Floor market – Competitive Landscape
    1. 6.1. Competitor Market Share – Revenue
    2. 6.2. Market Concentration Rate Analysis, Top 3 and Top 5 Players
    3. 6.3. Competitor Market Share – Volume
    4. 6.4. Strategic Development
      1. 6.4.1. Acquisitions and Mergers
      2. 6.4.2. New Products
      3. 6.4.3. Research & Development Activities
  7. CHAPTER 7. Company Profiles
    1. 7.1. Haworth
      1. 7.1.1. Company Overview
      2. 7.1.2. Haworth Sales, Revenue, Price, and Gross Margin
      3. 7.1.3. Product portfolio
      4. 7.1.4. Recent initiatives
    2. 7.2. Polygroup
      1. 7.2.1. Company Overview
      2. 7.2.2. Polygroup Sales, Revenue, Price, and Gross Margin
      3. 7.2.3. Product portfolio
      4. 7.2.4. Recent initiatives
    3. 7.3. PORCELANOSA
      1. 7.3.1. Company Overview
      2. 7.3.2. PORCELANOSA Sales, Revenue, Price, and Gross Margin
      3. 7.3.3. Product portfolio
      4. 7.3.4. Recent initiatives
    4. 7.4. Lenzlinger
      1. 7.4.1. Company Overview
      2. 7.4.2. Lenzlinger Sales, Revenue, Price, and Gross Margin
      3. 7.4.3. Product portfolio
      4. 7.4.4. Recent initiatives
    5. 7.5. Kingspan
      1. 7.5.1. Company Overview
      2. 7.5.2. Kingspan Sales, Revenue, Price, and Gross Margin
      3. 7.5.3. Product portfolio
      4. 7.5.4. Recent initiatives
    6. 7.6. Veitchi Flooring
      1. 7.6.1. Company Overview
      2. 7.6.2. Veitchi Flooring Sales, Revenue, Price, and Gross Margin
      3. 7.6.3. Product portfolio
      4. 7.6.4. Recent initiatives
    7. 7.7. Bathgate Flooring
      1. 7.7.1. Company Overview
      2. 7.7.2. Bathgate Flooring Sales, Revenue, Price, and Gross Margin
      3. 7.7.3. Product portfolio
      4. 7.7.4. Recent initiatives
    8. 7.8. MERO-TSK
      1. 7.8.1. Company Overview
      2. 7.8.2. MERO-TSK Sales, Revenue, Price, and Gross Margin
      3. 7.8.3. Product portfolio
      4. 7.8.4. Recent initiatives
    9. 7.9. Others
      1. 7.9.1. Company Overview
      2. 7.9.2. Others Sales, Revenue, Price, and Gross Margin
      3. 7.9.3. Product portfolio
      4. 7.9.4. Recent initiatives
  8. CHAPTER 8. Raised Access Floor — Industry Analysis
    1. 8.1. Introduction and Taxonomy
    2. 8.2. Raised Access Floor Market – Key Trends
      1. 8.2.1. Market Drivers
      2. 8.2.2. Market Restraints
      3. 8.2.3. Market Opportunities
    3. 8.3. Value Chain Analysis
    4. 8.4. Key Mandates and Regulations
    5. 8.5. Technology Roadmap and Timeline
    6. 8.6. Raised Access Floor market – Attractiveness Analysis
      1. 8.6.1. By Type
      2. 8.6.2. By End-users
      3. 8.6.3. By Region
  9. CHAPTER 9. Raw Material analysis
    1. 9.1. Raised Access Floor Key Raw Material Analysis
      1. 9.1.1. Key Raw Materials
      2. 9.1.2. Price Trend of Key Raw Materials
    2. 9.2. Key Suppliers of Raw Materials
    3. 9.3. Proportion of Manufacturing Cost Structure
      1. 9.3.1. Raw Materials
      2. 9.3.2. Labor Cost
    4. 9.4. Manufacturing Expenses Analysis of Raised Access Floor
  10. CHAPTER 10. Industrial Chain, Sourcing Strategy and Downstream Buyers
    1. 10.1. Raised Access Floor Industrial Chain Analysis
    2. 10.2. Upstream Raw Materials Sourcing
      1. 10.2.1. Risk Mitigation:
      2. 10.2.2. Supplier Relationships:
      3. 10.2.3. Business Processes:
      4. 10.2.4. Securing the Product:
    3. 10.3. Raw Materials Sources of Raised Access Floor Major Manufacturers in 2016
    4. 10.4. Downstream Buyers
    5. 10.5. Distributors/Traders List
  11. CHAPTER 11. Marketing Strategy Analysis, Distributors
    1. 11.1. Marketing Channel
    2. 11.2. Direct Marketing
    3. 11.3. Indirect Marketing
    4. 11.4. Marketing Channel Development Trend
    5. 11.5. Economic/Political Environmental Change
  12. CHAPTER 12. Report Conclusion
  13. CHAPTER 13. Research Approach & Methodology
    1. 13.1. Report Description
    2. 13.2. Research Scope
    3. 13.3. Research Methodology
      1. 13.3.1. Secondary Research
      2. 13.3.2. Primary Research
      3. 13.3.3. Models
        1. 13.3.3.1. Company Share Analysis Model
        2. 13.3.3.2. Revenue Based Modeling
        3. 13.3.3.3. Research Limitations

        List of Figures

        FIG. 1    Global Raised Access Floor Market, 2016-2026 (USD Million)
        FIG. 2    Global Raised Access Floor Market Share, by Type, 2018 & 2025 (USD Million)
        FIG. 3    Global Raised Access Floor Market share, by Type, 2018 & 2025 (Thousand Sq. Meter)
        FIG. 4    Global Steel Encapsulated Raised Access Floor Market, 2016-2026 (USD Million)
        FIG. 5    Global Steel Encapsulated Raised Access Floor  Market, 2016-2026 (Thousand Sq. Meter)
        FIG. 6    Global Calcium Sulphate Board Raised Access Floor Market, 2016-2026 (USD Million)
        FIG. 7    Global Calcium Sulphate Board Raised Access Floor  Market, 2016-2026 (Thousand Sq. Meter)
        FIG. 8    Global Aluminium Board Raised Access Floor Market, 2016-2026 (USD Million)
        FIG. 9    Global Aluminium Board Raised Access Floor  Market, 2016-2026 (Thousand Sq. Meter)
        FIG. 10    Global Chipboard Encapsulated Raised Access Floor Market, 2016-2026 (USD Million)
        FIG. 11    Global Chipboard Encapsulated Raised Access Floor  Market, 2016-2026 (Thousand Sq. Meter)
        FIG. 12    Global Others Raised Access Floor Market, 2016-2026 (USD Million)
        FIG. 13    Global Others Raised Access Floor  Market, 2016-2026 (Thousand Sq. Meter)
        FIG. 14    Global Raised Access Floor Market Share, by End-users, 2018 & 2025 (USD Million)
        FIG. 15    Global Raised Access Floor Market share, by End-users, 2018 & 2025 (Thousand Sq. Meter)
        FIG. 16    Global Technical Facilities Raised Access Floor Market, 2016-2026 (USD Million)
        FIG. 17    Global Technical Facilities Raised Access Floor  Market, 2016-2026 (Thousand Sq. Meter)
        FIG. 18    Global Commercial Office Space Raised Access Floor Market, 2016-2026 (USD Million)
        FIG. 19    Global Commercial Office Space Raised Access Floor  Market, 2016-2026 (Thousand Sq. Meter)
        FIG. 20    Global Nonprofit Management Raised Access Floor Market, 2016-2026 (USD Million)
        FIG. 21    Global Nonprofit Management Raised Access Floor  Market, 2016-2026 (Thousand Sq. Meter)
        FIG. 22    Global Others Raised Access Floor Market, 2016-2026 (USD Million)
        FIG. 23    Global Others Raised Access Floor  Market, 2016-2026 (Thousand Sq. Meter)
        FIG. 24    Global Raised Access Floor Market Share, by Region, 2018 & 2025
        FIG. 25    Global Raised Access Floor Market Share, by Region, 2018 & 2025
        FIG. 26    North America Raised Access Floor Market, 2016-2026
        FIG. 27    North America Raised Access Floor  Market, 2016-2026 (Thousand Sq. Meter)
        FIG. 28    U.S. Raised Access Floor Market, 2016-2026
        FIG. 29    U.S. Raised Access Floor  Market, 2016-2026 (Thousand Sq. Meter)
        FIG. 30    Canada Raised Access Floor Market, 2016-2026
        FIG. 31    Canada Raised Access Floor  Market, 2016-2026 (Thousand Sq. Meter)
        FIG. 32    Europe Raised Access Floor Market, 2016-2026
        FIG. 33    Europe Raised Access Floor  Market, 2016-2026 (Thousand Sq. Meter)
        FIG. 34    Germany Raised Access Floor Market, 2016-2026
        FIG. 35    Germany Raised Access Floor  Market, 2016-2026 (Thousand Sq. Meter)
        FIG. 36    France Raised Access Floor Market, 2016-2026
        FIG. 37    France Raised Access Floor  Market, 2016-2026 (Thousand Sq. Meter)
        FIG. 38    U.K. Raised Access Floor Market, 2016-2026
        FIG. 39    U.K. Raised Access Floor  Market, 2016-2026 (Thousand Sq. Meter)
        FIG. 40    Italy Raised Access Floor Market, 2016-2026
        FIG. 41    Italy Raised Access Floor  Market, 2016-2026 (Thousand Sq. Meter)
        FIG. 42    Spain Raised Access Floor Market, 2016-2026
        FIG. 43    Spain Raised Access Floor  Market, 2016-2026 (Thousand Sq. Meter)
        FIG. 44    Rest of Europe Raised Access Floor Market, 2016-2026
        FIG. 45    Rest of Europe Raised Access Floor  Market, 2016-2026 (Thousand Sq. Meter)
        FIG. 46    Asia Pacific Raised Access Floor Market, 2016-2026
        FIG. 47    Asia Pacific Raised Access Floor  Market, 2016-2026 (Thousand Sq. Meter)
        FIG. 48    China Raised Access Floor Market, 2016-2026
        FIG. 49    China Raised Access Floor  Market, 2016-2026 (Thousand Sq. Meter)
        FIG. 50    Japan Raised Access Floor Market, 2016-2026
        FIG. 51    Japan Raised Access Floor  Market, 2016-2026 (Thousand Sq. Meter)
        FIG. 52    India Raised Access Floor Market, 2016-2026
        FIG. 53    India Raised Access Floor  Market, 2016-2026 (Thousand Sq. Meter)
        FIG. 54    South  Korea Raised Access Floor Market, 2016-2026
        FIG. 55    South  Korea Raised Access Floor  Market, 2016-2026 (Thousand Sq. Meter)
        FIG. 56    South-East Asia Raised Access Floor Market, 2016-2026
        FIG. 57    South-East Asia Raised Access Floor  Market, 2016-2026 (Thousand Sq. Meter)
        FIG. 58    Rest of Asia Pacific Raised Access Floor Market, 2016-2026
        FIG. 59    Rest of Asia Pacific Raised Access Floor  Market, 2016-2026 (Thousand Sq. Meter)
        FIG. 60    Latin America Raised Access Floor Market, 2016-2026
        FIG. 61    Latin America Raised Access Floor  Market, 2016-2026 (Thousand Sq. Meter)
        FIG. 62    Brazil Raised Access Floor Market, 2016-2026
        FIG. 63    Brazil Raised Access Floor  Market, 2016-2026 (Thousand Sq. Meter)
        FIG. 64    Mexico Raised Access Floor Market, 2016-2026
        FIG. 65    Mexico Raised Access Floor  Market, 2016-2026 (Thousand Sq. Meter)
        FIG. 66    Rest of Latin America Raised Access Floor Market, 2016-2026
        FIG. 67    Rest of Latin America Raised Access Floor  Market, 2016-2026 (Thousand Sq. Meter)
        FIG. 68    The Middle-East and Africa Raised Access Floor Market, 2016-2026
        FIG. 69    The Middle-East and Africa Raised Access Floor  Market, 2016-2026 (Thousand Sq. Meter)
        FIG. 70    GCC Countries Raised Access Floor Market, 2016-2026
        FIG. 71    GCC Countries Raised Access Floor  Market, 2016-2026 (Thousand Sq. Meter)
        FIG. 72    South Africa Raised Access Floor Market, 2016-2026
        FIG. 73    South Africa Raised Access Floor  Market, 2016-2026 (Thousand Sq. Meter)
        FIG. 74    Rest of Middle-East Africa Raised Access Floor Market, 2016-2026
        FIG. 75    Rest of Middle-East Africa Raised Access Floor  Market, 2016-2026 (Thousand Sq. Meter)
        FIG. 76    Global Raised Access Floor production and revenue, 2015-2025 (USD Million) (Thousand Sq. Meter)
        FIG. 77    North America Raised Access Floor production and revenue, 2015-2025 (USD Million) (Thousand Sq. Meter)
        FIG. 78    Europe Raised Access Floor production and revenue, 2015-2025 (USD Million) (Thousand Sq. Meter)
        FIG. 79    Asia Pacific Raised Access Floor production and revenue, 2015-2025 (USD Million) (Thousand Sq. Meter)
        FIG. 80    Latin America Raised Access Floor production and revenue, 2015-2025 (USD Million) (Thousand Sq. Meter)
        FIG. 81    Middle East and Africa Raised Access Floor production and revenue, 2015-2025 (USD Million) (Thousand Sq. Meter)
        FIG. 82    Competitor Market Share – Revenue
        FIG. 83    Competitor Market Share – Volume
        FIG. 84    Haworth Revenue and Growth Rate
        FIG. 85    Haworth Market Share
        FIG. 86    Polygroup Revenue and Growth Rate
        FIG. 87    Polygroup Market Share
        FIG. 88    PORCELANOSA Revenue and Growth Rate
        FIG. 89    PORCELANOSA Market Share
        FIG. 90    Lenzlinger Revenue and Growth Rate
        FIG. 91    Lenzlinger Market Share
        FIG. 92    Kingspan Revenue and Growth Rate
        FIG. 93    Kingspan Market Share
        FIG. 94    Veitchi Flooring Revenue and Growth Rate
        FIG. 95    Veitchi Flooring Market Share
        FIG. 96    Bathgate Flooring Revenue and Growth Rate
        FIG. 97    Bathgate Flooring Market Share
        FIG. 98    MERO-TSK Revenue and Growth Rate
        FIG. 99    MERO-TSK Market Share
        FIG. 100    Others Revenue and Growth Rate
        FIG. 101    Others Market Share
        FIG. 102    Market Dynamics
        FIG. 103    Global Raised Access Floor – Value Chain Analysis
        FIG. 104    Key Mandates and Regulations
        FIG. 105    Technology Roadmap and Timeline
        FIG. 106    Market Attractiveness Analysis – By Type
        FIG. 107    Market Attractiveness Analysis – By End-users
        FIG. 108    Market Attractiveness Analysis – By Region
        FIG. 109    Manufacturing Cost Structure of Raised Access Floor
        FIG. 110    Raised Access Floor Industrial Chain Analysis
        FIG. 111    Market Channel
        FIG. 112    Marketing Channel Development Trend
        FIG. 113    Growth in World Gross Product, 2008-2018


        List of Tables

        TABLE 1    Global Raised Access Floor market, 2018 & 2025 (USD Million)
        TABLE 2    Global Raised Access Floor market, by Type, 2016-2026 (USD Million)
        TABLE 3    Global Raised Access Floor market, by Type, 2016-2026 (Thousand Sq. Meter)
        TABLE 4    Global Raised Access Floor market, by End-users, 2016-2026 (USD Million)
        TABLE 5    Global Raised Access Floor market, by End-users, 2016-2026 (Thousand Sq. Meter)
        TABLE 6    Global Raised Access Floor market, by region, 2016-2026 (USD Million)
        TABLE 7    Global Raised Access Floor market, by region, 2016-2026 (Thousand Sq. Meter)
        TABLE 8    North America Raised Access Floor Market, by Type, 2016-2026 (USD Million)
        TABLE 9    North America Raised Access Floor Market, by Type, 2016-2026 (Thousand Sq. Meter)
        TABLE 10    North America Raised Access Floor Market, by End-users, 2016-2026 (USD Million)
        TABLE 11    North America Raised Access Floor Market, by End-users, 2016-2026 (Thousand Sq. Meter)
        TABLE 12    Europe Raised Access Floor Market, by Type, 2016-2026 (USD Million)
        TABLE 13    Europe Raised Access Floor Market, by Type, 2016-2026 (Thousand Sq. Meter)
        TABLE 14    Europe Raised Access Floor Market, by End-users, 2016-2026 (USD Million)
        TABLE 15    Europe Raised Access Floor Market, by End-users, 2016-2026 (Thousand Sq. Meter)
        TABLE 16    Asia Pacific Raised Access Floor Market, by Type, 2016-2026 (USD Million)
        TABLE 17    Asia Pacific Raised Access Floor Market, by Type, 2016-2026 (Thousand Sq. Meter)
        TABLE 18    Asia Pacific Raised Access Floor Market, by End-users, 2016-2026 (USD Million)
        TABLE 19    Asia Pacific Raised Access Floor Market, by End-users, 2016-2026 (Thousand Sq. Meter)
        TABLE 20    Latin America Raised Access Floor Market, by Type, 2016-2026 (USD Million)
        TABLE 21    Latin America Raised Access Floor Market, by Type, 2016-2026 (Thousand Sq. Meter)
        TABLE 22    Latin America Raised Access Floor Market, by End-users, 2016-2026 (USD Million)
        TABLE 23    Latin America Raised Access Floor Market, by End-users, 2016-2026 (Thousand Sq. Meter)
        TABLE 24    The Middle-East and Africa Raised Access Floor Market, by Type, 2016-2026 (USD Million)
        TABLE 25    The Middle-East and Africa Raised Access Floor Market, by Type, 2016-2026 (Thousand Sq. Meter)
        TABLE 26    The Middle-East and Africa Raised Access Floor Market, by End-users, 2016-2026 (USD Million)
        TABLE 27    The Middle-East and Africa Raised Access Floor Market, by End-users, 2016-2026 (Thousand Sq. Meter)
        TABLE 28    North America Raised Access Floor Production, Consumption, Export, Import, 2016-2019
        TABLE 29    Europe Raised Access Floor Production, Consumption, Export, Import, 2016-2019
        TABLE 30    Asia Pacific Raised Access Floor Production, Consumption, Export, Import, 2016-2019
        TABLE 31    Latin America Raised Access Floor Production, Consumption, Export, Import, 2016-2019
        TABLE 32    Middle East & Africa Raised Access Floor Production, Consumption, Export, Import, 2016-2019
        TABLE 33    Global Raised Access Floor Market - Company Revenue Analysis 2016-2019 (USD Million)
        TABLE 34    Global Raised Access Floor Market - Company Revenue Share Analysis 2016-2019(%)
        TABLE 35    Global Raised Access Floor Market - Company Volume Analysis 2016-2019 (Thousand Sq. Meter)
        TABLE 36    Global Raised Access Floor Market - Company Volume Share Analysis 2016-2019(%)
        TABLE 37    Acquisitions and Mergers
        TABLE 38    New Product/Service Launch
        TABLE 39    Research & Development Activities
        TABLE 40    Market Drivers
        TABLE 41    Market Restraints
        TABLE 42    Market Opportunities
        TABLE 43    Production Base and Market Concentration Rate of Raw Material
        TABLE 44    Key Suppliers of Raw Materials
        TABLE 45    Raw Materials Sources of Raised Access Floor Major Manufacturers in 2016
        TABLE 46    Major Buyers of Raised Access Floor
        TABLE 47    Distributors/Traders of Raised Access Floor by Region

Industry Major Market Players

  • Haworth
  • Polygroup
  • PORCELANOSA
  • Lenzlinger
  • Kingspan
  • Veitchi Flooring
  • Bathgate Flooring
  • MERO-TSK