Search Market Research Report

Discover Our Latest Reports
Discover Our Featured Reports
Discover Top Selling Reports

Quantum Dot Solar Cell Market Size, Share Global Analysis Report, 2021 – 2026

report img

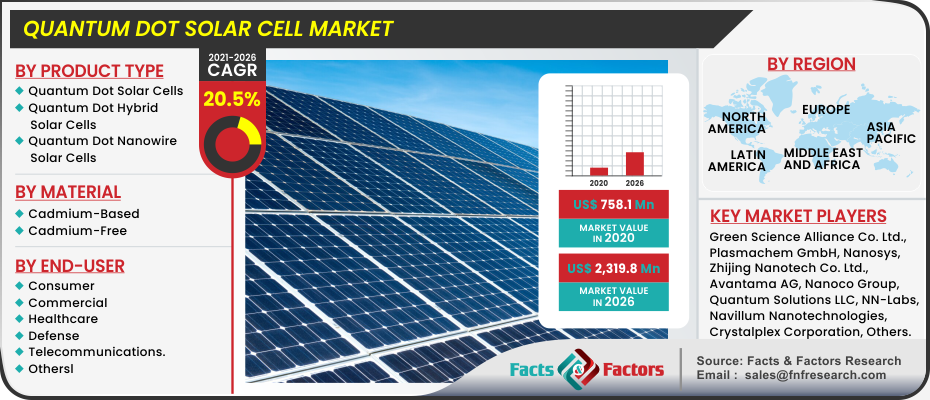
Quantum Dot Solar Cell Market by Product Type (Quantum Dot Solar Cells, Quantum Dot Hybrid Solar Cells, and Quantum Nanowire Solar Cells), By Material (Cadmium-Based and Cadmium-Free) and By End User (Consumer, Commercial, Healthcare, Defense, Telecommunications. and Others): Global and Regional Industry Perspective, Comprehensive Analysis, and Forecast 2021 – 2026

Industry Insights

[219+ Pages Report] According to a Facts and Factors report, the global quantum dot solar cells market was registered at approximately USD 758.1 Million in 2020 and is expected to generate revenue of almost USD 2,319.8 Million by the year 2026, growing at a CAGR of approximately 20.5% between 2021 and 2026.

logoMarket Overview          

Quantum dots are thought to be man-made atoms. Their energy levels can be adjusted by changing their size, which defines the bandgap. The dots can be grown in a variety of sizes, allowing them to communicate a wide range of bandgaps without changing the underlying material or construction. Sizing is accomplished by varying the duration or temperature of the fusion.

Quantum dot solar cells have the potential for solar, or photovoltaic, cells that reduce wasteful heat while maximizing the amount of solar energy converted to electricity. This is significant in terms of making solar energy more cost-competitive with traditional power sources.

Quantum Dot Solar Cell Market

To know more about this report | Request Free Sample Copy

logoIndustry Growth Factors

In 2021, the multibillion-dollar quantum dot-enabled market will grow even more, with market innovations leading to improved products in displays, Micro-LEDs, security tagging, medical diagnostics, quantum computing, and Agtech.

QDs (Quantum Dot) are a proven and scaled technology that is relatively inexpensive for the high-end applications to which they add value. Quantum Dots (QDs) are used in a variety of optoelectronic devices, such as televisions and displays, light-emitting devices (LEDs), solar cells, photodiodes, thermoelectrics, photoconductors, and field-effect transistors, and QD solutions have been used in a variety of in vivo and in vitro imaging, sensing, and labeling techniques

logoSegmentation Analysis

The global quantum dot solar cell market is segregated based on product type, end-user, material, and regions.  Based on product type, the quantum dot solar cell market is categorized into quantum dot hybrid solar cells, quantum dot solar cells, and quantum dot nanowire solar cells. Cadmium-based and cadmium-free are the further bifurcation of the material segment. Cadmium-free quantum dots have the potential not only for displays but also for a wide range of other applications, including solar cells. In addition, the report also classified the end-user segment into consumer, healthcare, defense, commercial, telecommunications, and others

logo Regional Analysis

In 2020, North America is expected to retain its supremacy in the global quantum dot solar cell market from a regional perspective. North America dominates the quantum dot solar cell market owing to the adoption of advanced technology in the U.S., and Canada. Moreover, the growing number of applications for quantum dot solar cells, such as chromatic windows and heat-resistant tiles, is also expected to fuel the market in this region. During the forecast period, Asia Pacific is expected to develop at the fastest CAGR. Customers' desire to embrace technically superior products, along with the increased research and development in QD technology by major display manufacturers, have fueled market expansion in this region. Furthermore, owing to the increased adoption of quantum dots-enabled products in consumer electronics, automotive, and healthcare is also anticipated to fuel market growth in the upcoming years.

logoReport Scope

Report Attribute

Details

Market Size in 2020

USD 758.1 Million

Projected Market Size in 2026

USD 2,319.8 Million

Growth Rate

CAGR 20.5%

Base Year

2020

Forecast Years

2021-2026

Key Market Players

Plasmachem GmbH, Zhijing Nanotech Co. Ltd., Samsung Electronics, Avantama AG, Quantum Solutions LLC, Crystalplex Corporation, Osram Licht, Nanoco Group, Green Science Alliance Co. Ltd., Nanosys, Navillum Nanotechnologies, NN-Labs, and Ocean NanoTech amongst others.

Key Segment

By Product Type, By Material, By End User, and By Region

Major Regions Covered

North America, Europe, Asia Pacific, Latin America, and the Middle East & Africa

Purchase Options

Request customized purchase options to meet your research needs. Explore purchase options

logo Competitive Players

logoSome main participants of the quantum dot solar cell market are

  • Green Science Alliance Co. Ltd.
  • Plasmachem GmbH
  • Zhijing Nanotech Co. Ltd.
  • Avantama AG
  • Quantum Solutions LLC
  • Crystalplex Corporation
  • Nanoco Group
  • Nanosys
  • Navillum Nanotechnologies
  • NN-Labs
  • Ocean NanoTech
  • Osram Licht
  • Samsung Electronics 

logoBy Product Type:

  • Quantum Dot Solar Cells
  • Quantum Dot Hybrid Solar Cells
  • Quantum Dot Nanowire Solar Cells

logoBy Material:

  • Cadmium-Based
  • Cadmium-Free

logoBy End-user:

  • Consumer
  • Commercial
  • Healthcare
  • Defense
  • Telecommunications.
  • Others

logoBy Region:

  • North America
    • The U.S.
    • Canada
  • Europe
    • France
    • The UK
    • Spain
    • Germany
    • Italy
    • Rest of Europe
  • Asia Pacific
    • China
    • Japan
    • India
    • South Korea
    • Southeast Asia
    • Rest of Asia Pacific
  • Latin America
    • Brazil
    • Mexico
    • Rest of Latin America
  • Middle East & Africa
    • GCC
    • South Africa
    • Rest of Middle East & Africa

Table of Content

  1. Chapter 1 Executive Summary
    1. 1.1. Introduction of Quantum Dot Solar Cell
    2. 1.2. Global Quantum Dot Solar Cell Market, 2020 & 2026 (USD Million)
    3. 1.3. Global Quantum Dot Solar Cell Market, 2016 – 2026 (USD Million)
    4. 1.4. Global Quantum Dot Solar Cell Market Absolute Revenue Opportunity, 2016 – 2026 (USD Million)
    5. 1.5. Global Quantum Dot Solar Cell Market Incremental Revenue Opportunity, 2020 – 2026 (USD Million)
    6. 1.6. COVID-19 Impacts on Quantum Dot Solar Cell Market
      1. 1.6.1. COVID-19 Impact on the Players
      2. 1.6.2. Business Strategies and Recommendations
  2. Chapter 2 Quantum Dot Solar Cell Market – Product Type Analysis
    1. 2.1. Global Quantum Dot Solar Cell Market – Product Type Overview
    2. 2.2. Global Quantum Dot Solar Cell Market Share, by Product Type, 2020 & 2026 (USD Million)
    3. 2.3. Quantum Dot Solar Cells
      1. 2.3.1. Global Quantum Dot Solar Cells Quantum Dot Solar Cell Market, 2016 – 2026 (USD Million)
    4. 2.4. Quantum Dot Hybrid Solar Cells
      1. 2.4.1. Global Quantum Dot Hybrid Solar Cells Quantum Dot Solar Cell Market, 2016 – 2026 (USD Million)
    5. 2.5. Quantum Dot Nanowire Solar Cells
      1. 2.5.1. Global Quantum Dot Nanowire Solar Cells Quantum Dot Solar Cell Market, 2016 – 2026 (USD Million)
  3. Chapter 3 Quantum Dot Solar Cell Market – Material Analysis
    1. 3.1. Global Quantum Dot Solar Cell Market – Material Overview
    2. 3.2. Global Quantum Dot Solar Cell Market Share, by Material, 2020 & 2026 (USD Million)
    3. 3.3. Cadmium-Based
      1. 3.3.1. Global Cadmium-Based Quantum Dot Solar Cell Market, 2016 – 2026 (USD Million)
    4. 3.4. Cadmium-Free
      1. 3.4.1. Global Cadmium-Free Quantum Dot Solar Cell Market, 2016 – 2026 (USD Million)
  4. Chapter 4 Quantum Dot Solar Cell Market – End User Analysis
    1. 4.1. Global Quantum Dot Solar Cell Market – End User Overview
    2. 4.2. Global Quantum Dot Solar Cell Market Share, by End User, 2020 & 2026 (USD Million)
    3. 4.3. Consumer
      1. 4.3.1. Global Consumer Quantum Dot Solar Cell Market, 2016 – 2026 (USD Million)
    4. 4.4. Commercial
      1. 4.4.1. Global Commercial Quantum Dot Solar Cell Market, 2016 – 2026 (USD Million)
    5. 4.5. Healthcare
      1. 4.5.1. Global Healthcare Quantum Dot Solar Cell Market, 2016 – 2026 (USD Million)
    6. 4.6. Defense
      1. 4.6.1. Global Defense Quantum Dot Solar Cell Market, 2016 – 2026 (USD Million)
    7. 4.7. Telecommunications
      1. 4.7.1. Global Telecommunications Quantum Dot Solar Cell Market, 2016 – 2026 (USD Million)
    8. 4.8. Others
      1. 4.8.1. Global Others Quantum Dot Solar Cell Market, 2016 – 2026 (USD Million)
  5. Chapter 5 Quantum Dot Solar Cell Market – Regional Analysis
    1. 5.1. Global Quantum Dot Solar Cell Market Regional Overview
    2. 5.2. Global Quantum Dot Solar Cell Market Share, by Region, 2020 & 2026 (USD Million)
    3. 5.3. North America
      1. 5.3.1. North America Quantum Dot Solar Cell Market, 2016 – 2026 (USD Million)
        1. 5.3.1.1. North America Quantum Dot Solar Cell Market, by Country, 2016 - 2026 (USD Million)
      2. 5.3.2. North America Quantum Dot Solar Cell Market, by Product Type, 2016 – 2026
        1. 5.3.2.1. North America Quantum Dot Solar Cell Market, by Product Type, 2016 – 2026 (USD Million)
      3. 5.3.3. North America Quantum Dot Solar Cell Market, by Material, 2016 – 2026
        1. 5.3.3.1. North America Quantum Dot Solar Cell Market, by Material, 2016 – 2026 (USD Million)
      4. 5.3.4. North America Quantum Dot Solar Cell Market, by End User, 2016 – 2026
        1. 5.3.4.1. North America Quantum Dot Solar Cell Market, by End User, 2016 – 2026 (USD Million)
      5. 5.3.5. U.S.
        1. 5.3.5.1. U.S. Quantum Dot Solar Cell Market, 2016 – 2026 (USD Million)
      6. 5.3.6. Canada
        1. 5.3.6.1. Canada Quantum Dot Solar Cell Market, 2016 – 2026 (USD Million)
    4. 5.4. Europe
      1. 5.4.1. Europe Quantum Dot Solar Cell Market, 2016 – 2026 (USD Million)
        1. 5.4.1.1. Europe Quantum Dot Solar Cell Market, by Country, 2016 - 2026 (USD Million)
      2. 5.4.2. Europe Quantum Dot Solar Cell Market, by Product Type, 2016 – 2026
        1. 5.4.2.1. Europe Quantum Dot Solar Cell Market, by Product Type, 2016 – 2026 (USD Million)
      3. 5.4.3. Europe Quantum Dot Solar Cell Market, by Material, 2016 – 2026
        1. 5.4.3.1. Europe Quantum Dot Solar Cell Market, by Material, 2016 – 2026 (USD Million)
      4. 5.4.4. Europe Quantum Dot Solar Cell Market, by End User, 2016 – 2026
        1. 5.4.4.1. Europe Quantum Dot Solar Cell Market, by End User, 2016 – 2026 (USD Million)
      5. 5.4.5. Germany
        1. 5.4.5.1. Germany Quantum Dot Solar Cell Market, 2016 – 2026 (USD Million)
      6. 5.4.6. France
        1. 5.4.6.1. France Quantum Dot Solar Cell Market, 2016 – 2026 (USD Million)
      7. 5.4.7. U.K.
        1. 5.4.7.1. U.K. Quantum Dot Solar Cell Market, 2016 – 2026 (USD Million)
      8. 5.4.8. Italy
        1. 5.4.8.1. Italy Quantum Dot Solar Cell Market, 2016 – 2026 (USD Million)
      9. 5.4.9. Spain
        1. 5.4.9.1. Spain Quantum Dot Solar Cell Market, 2016 – 2026 (USD Million)
      10. 5.4.10. Rest of Europe
        1. 5.4.10.1. Rest of Europe Quantum Dot Solar Cell Market, 2016 – 2026 (USD Million)
    5. 5.5. Asia Pacific
      1. 5.5.1. Asia Pacific Quantum Dot Solar Cell Market, 2016 – 2026 (USD Million)
        1. 5.5.1.1. Asia Pacific Quantum Dot Solar Cell Market, by Country, 2016 - 2026 (USD Million)
      2. 5.5.2. Asia Pacific Quantum Dot Solar Cell Market, by Product Type, 2016 – 2026
        1. 5.5.2.1. Asia Pacific Quantum Dot Solar Cell Market, by Product Type, 2016 – 2026 (USD Million)
      3. 5.5.3. Asia Pacific Quantum Dot Solar Cell Market, by Material, 2016 – 2026
        1. 5.5.3.1. Asia Pacific Quantum Dot Solar Cell Market, by Material, 2016 – 2026 (USD Million)
      4. 5.5.4. Asia Pacific Quantum Dot Solar Cell Market, by End User, 2016 – 2026
        1. 5.5.4.1. Asia Pacific Quantum Dot Solar Cell Market, by End User, 2016 – 2026 (USD Million)
      5. 5.5.5. China
        1. 5.5.5.1. China Quantum Dot Solar Cell Market, 2016 – 2026 (USD Million)
      6. 5.5.6. Japan
        1. 5.5.6.1. Japan Quantum Dot Solar Cell Market, 2016 – 2026 (USD Million)
      7. 5.5.7. India
        1. 5.5.7.1. India Quantum Dot Solar Cell Market, 2016 – 2026 (USD Million)
      8. 5.5.8. South Korea
        1. 5.5.8.1. South Korea Quantum Dot Solar Cell Market, 2016 – 2026 (USD Million)
      9. 5.5.9. South-East Asia
        1. 5.5.9.1. South-East Asia Quantum Dot Solar Cell Market, 2016 – 2026 (USD Million)
      10. 5.5.10. Rest of Asia Pacific
        1. 5.5.10.1. Rest of Asia Pacific Quantum Dot Solar Cell Market, 2016 – 2026 (USD Million)
    6. 5.6. Latin America
      1. 5.6.1. Latin America Quantum Dot Solar Cell Market, 2016 – 2026 (USD Million)
        1. 5.6.1.1. Latin America Quantum Dot Solar Cell Market, by Country, 2016 - 2026 (USD Million)
      2. 5.6.2. Latin America Quantum Dot Solar Cell Market, by Product Type, 2016 – 2026
        1. 5.6.2.1. Latin America Quantum Dot Solar Cell Market, by Product Type, 2016 – 2026 (USD Million)
      3. 5.6.3. Latin America Quantum Dot Solar Cell Market, by Material, 2016 – 2026
        1. 5.6.3.1. Latin America Quantum Dot Solar Cell Market, by Material, 2016 – 2026 (USD Million)
      4. 5.6.4. Latin America Quantum Dot Solar Cell Market, by End User, 2016 – 2026
        1. 5.6.4.1. Latin America Quantum Dot Solar Cell Market, by End User, 2016 – 2026 (USD Million)
      5. 5.6.5. Brazil
        1. 5.6.5.1. Brazil Quantum Dot Solar Cell Market, 2016 – 2026 (USD Million)
      6. 5.6.6. Mexico
        1. 5.6.6.1. Mexico Quantum Dot Solar Cell Market, 2016 – 2026 (USD Million)
      7. 5.6.7. Rest of Latin America
        1. 5.6.7.1. Rest of Latin America Quantum Dot Solar Cell Market, 2016 – 2026 (USD Million)
    7. 5.7. The Middle-East and Africa
      1. 5.7.1. The Middle-East and Africa Quantum Dot Solar Cell Market, 2016 – 2026 (USD Million)
        1. 5.7.1.1. The Middle-East and Africa Quantum Dot Solar Cell Market, by Country, 2016 - 2026 (USD Million)
      2. 5.7.2. The Middle-East and Africa Quantum Dot Solar Cell Market, by Product Type, 2016 – 2026
        1. 5.7.2.1. The Middle-East and Africa Quantum Dot Solar Cell Market, by Product Type, 2016 – 2026 (USD Million)
      3. 5.7.3. The Middle-East and Africa Quantum Dot Solar Cell Market, by Material, 2016 – 2026
        1. 5.7.3.1. The Middle-East and Africa Quantum Dot Solar Cell Market, by Material, 2016 – 2026 (USD Million)
      4. 5.7.4. The Middle-East and Africa Quantum Dot Solar Cell Market, by End User, 2016 – 2026
        1. 5.7.4.1. The Middle-East and Africa Quantum Dot Solar Cell Market, by End User, 2016 – 2026 (USD Million)
      5. 5.7.5. GCC Countries
        1. 5.7.5.1. GCC Countries Quantum Dot Solar Cell Market, 2016 – 2026 (USD Million)
      6. 5.7.6. South Africa
        1. 5.7.6.1. South Africa Quantum Dot Solar Cell Market, 2016 – 2026 (USD Million)
      7. 5.7.7. Rest of Middle-East Africa
        1. 5.7.7.1. Rest of Middle-East Africa Quantum Dot Solar Cell Market, 2016 – 2026 (USD Million)
  6. Chapter 6 Quantum Dot Solar Cell Market – Competitive Landscape
    1. 6.1. Competitor Market Share – Revenue
    2. 6.2. Market Concentration Rate Analysis, Top 3 and Top 5 Players
    3. 6.3. Strategic Developments
      1. 6.3.1. Acquisitions and Mergers
      2. 6.3.2. New Products
      3. 6.3.3. Research & Development Activities
  7. Chapter 7 Company Profiles
    1. 7.1. Green Science Alliance Co. Ltd.
      1. 7.1.1. Company Overview
      2. 7.1.2. Product/Service Portfolio
      3. 7.1.3. Green Science Alliance Co. Ltd. Sales, Revenue, and Gross Margin
      4. 7.1.4. Green Science Alliance Co. Ltd. Revenue and Growth Rate
      5. 7.1.5. Green Science Alliance Co. Ltd. Market Share
      6. 7.1.6. Recent Initiatives, Funding/VC Activities, and Technological Innovations
    2. 7.2. Plasmachem GmbH
      1. 7.2.1. Company Overview
      2. 7.2.2. Product/Service Portfolio
      3. 7.2.3. Plasmachem GmbH Sales, Revenue, and Gross Margin
      4. 7.2.4. Plasmachem GmbH Revenue and Growth Rate
      5. 7.2.5. Plasmachem GmbH Market Share
      6. 7.2.6. Recent Initiatives, Funding/VC Activities, and Technological Innovations
    3. 7.3. Zhijing Nanotech Co. Ltd
      1. 7.3.1. Company Overview
      2. 7.3.2. Product/Service Portfolio
      3. 7.3.3. Zhijing Nanotech Co. Ltd Sales, Revenue, and Gross Margin
      4. 7.3.4. Zhijing Nanotech Co. Ltd Revenue and Growth Rate
      5. 7.3.5. Zhijing Nanotech Co. Ltd Market Share
      6. 7.3.6. Recent Initiatives, Funding/VC Activities, and Technological Innovations
    4. 7.4. Avantama AG
      1. 7.4.1. Company Overview
      2. 7.4.2. Product/Service Portfolio
      3. 7.4.3. Avantama AG Sales, Revenue, and Gross Margin
      4. 7.4.4. Avantama AG Revenue and Growth Rate
      5. 7.4.5. Avantama AG Market Share
      6. 7.4.6. Recent Initiatives, Funding/VC Activities, and Technological Innovations
    5. 7.5. Osram Licht
      1. 7.5.1. Company Overview
      2. 7.5.2. Product/Service Portfolio
      3. 7.5.3. Osram Licht Sales, Revenue, and Gross Margin
      4. 7.5.4. Osram Licht Revenue and Growth Rate
      5. 7.5.5. Osram Licht Market Share
      6. 7.5.6. Recent Initiatives, Funding/VC Activities, and Technological Innovations
    6. 7.6. Samsung Electronics
      1. 7.6.1. Company Overview
      2. 7.6.2. Product/Service Portfolio
      3. 7.6.3. Samsung Electronics Sales, Revenue, and Gross Margin
      4. 7.6.4. Samsung Electronics Revenue and Growth Rate
      5. 7.6.5. Samsung Electronics Market Share
      6. 7.6.6. Recent Initiatives, Funding/VC Activities, and Technological Innovations
    7. 7.7. Quantum Solutions LLC
      1. 7.7.1. Company Overview
      2. 7.7.2. Product/Service Portfolio
      3. 7.7.3. Quantum Solutions LLC Sales, Revenue, and Gross Margin
      4. 7.7.4. Quantum Solutions LLC Revenue and Growth Rate
      5. 7.7.5. Quantum Solutions LLC Market Share
      6. 7.7.6. Recent Initiatives, Funding/VC Activities, and Technological Innovations
    8. 7.8. Crystalplex Corporation
      1. 7.8.1. Company Overview
      2. 7.8.2. Product/Service Portfolio
      3. 7.8.3. Crystalplex Corporation Sales, Revenue, and Gross Margin
      4. 7.8.4. Crystalplex Corporation Revenue and Growth Rate
      5. 7.8.5. Crystalplex Corporation Market Share
      6. 7.8.6. Recent Initiatives, Funding/VC Activities, and Technological Innovations
    9. 7.9. Nanoco Group
      1. 7.9.1. Company Overview
      2. 7.9.2. Product/Service Portfolio
      3. 7.9.3. Nanoco Group Sales, Revenue, and Gross Margin
      4. 7.9.4. Nanoco Group Revenue and Growth Rate
      5. 7.9.5. Nanoco Group Market Share
      6. 7.9.6. Recent Initiatives, Funding/VC Activities, and Technological Innovations
    10. 7.10. Nanosys
      1. 7.10.1. Company Overview
      2. 7.10.2. Product/Service Portfolio
      3. 7.10.3. Nanosys Sales, Revenue, and Gross Margin
      4. 7.10.4. Nanosys Revenue and Growth Rate
      5. 7.10.5. Nanosys Market Share
      6. 7.10.6. Recent Initiatives, Funding/VC Activities, and Technological Innovations
    11. 7.11. Navillum Nanotechnologies
      1. 7.11.1. Company Overview
      2. 7.11.2. Product/Service Portfolio
      3. 7.11.3. Navillum Nanotechnologies Sales, Revenue, and Gross Margin
      4. 7.11.4. Navillum Nanotechnologies Revenue and Growth Rate
      5. 7.11.5. Navillum Nanotechnologies Market Share
      6. 7.11.6. Recent Initiatives, Funding/VC Activities, and Technological Innovations
    12. 7.12. NN-Labs,
      1. 7.12.1. Company Overview
      2. 7.12.2. Product/Service Portfolio
      3. 7.12.3. NN-Labs, Sales, Revenue, and Gross Margin
      4. 7.12.4. NN-Labs, Revenue and Growth Rate
      5. 7.12.5. NN-Labs, Market Share
      6. 7.12.6. Recent Initiatives, Funding/VC Activities, and Technological Innovations
    13. 7.13. Ocean NanoTech
      1. 7.13.1. Company Overview
      2. 7.13.2. Product/Service Portfolio
      3. 7.13.3. Ocean NanoTech Sales, Revenue, and Gross Margin
      4. 7.13.4. Ocean NanoTech Revenue and Growth Rate
      5. 7.13.5. Ocean NanoTech Market Share
      6. 7.13.6. Recent Initiatives, Funding/VC Activities, and Technological Innovations
  8. Chapter 8 Quantum Dot Solar Cell — Industry Analysis
    1. 8.1. Introduction and Taxonomy
    2. 8.2. Quantum Dot Solar Cell Market – Key Trends
      1. 8.2.1. Market Drivers
      2. 8.2.2. Market Restraints
      3. 8.2.3. Market Opportunities
    3. 8.3. Value Chain Analysis
    4. 8.4. Key Mandates and Regulations
    5. 8.5. Technology Roadmap and Timeline
    6. 8.6. Quantum Dot Solar Cell Market – Attractiveness Analysis
      1. 8.6.1. By Product Type
      2. 8.6.2. By Material
      3. 8.6.3. By End User
      4. 8.6.4. By Region
  9. Chapter 9 Industrial Chain, Sourcing Strategy, and Downstream Buyers
    1. 9.1. Quantum Dot Solar Cell Industrial Chain Analysis
    2. 9.2. Downstream Buyers
    3. 9.3. Distributors/Traders List
  10. Chapter 10 Marketing Strategy Analysis
    1. 10.1. Marketing Channel
    2. 10.2. Direct Marketing
    3. 10.3. Indirect Marketing
    4. 10.4. Marketing Channel Development Trends
    5. 10.5. Economic/Political Environmental Change
  11. Chapter 11 Report Conclusion & Key Insights
    1. 11.1. Key Insights from Primary Interviews & Surveys Respondents
    2. 11.2. Key Takeaways from Analysts, Consultants, and Industry Leaders
  12. Chapter 12 Research Approach & Methodology
    1. 12.1. Report Description
    2. 12.2. Research Scope
    3. 12.3. Research Methodology
      1. 12.3.1. Secondary Research
      2. 12.3.2. Primary Research
      3. 12.3.3. Statistical Models
        1. 12.3.3.1. Company Share Analysis Model
        2. 12.3.3.2. Revenue Based Modeling
      4. 12.3.4. Research Limitations

      List of Figures

      Fig.1	Product Picture of Quantum Dot Solar Cell
      Fig.2	Global Quantum Dot Solar Cell Market, 2016 – 2026 (USD Million)
      Fig.3	Global Quantum Dot Solar Cell Market Absolute Revenue Opportunity, 2016 – 2026 (USD Million)
      Fig.4	Global Quantum Dot Solar Cell Market Incremental Revenue Opportunity, 2020 – 2026 (USD Million)
      Fig.5	COVID-19 Impacts on Quantum Dot Solar Cell Market
      Fig.6	COVID-19 Impact on the Players
      Fig.7	Business Strategies and Recommendations
      Fig.8	Global Quantum Dot Solar Cell Market Share, by Product Type, 2020 & 2026 (USD Million)
      Fig.9	Global Quantum Dot Solar Cells Quantum Dot Solar Cell Market, 2016 – 2026 (USD Million)
      Fig.10	Global Quantum Dot Hybrid Solar Cells Quantum Dot Solar Cell Market, 2016 – 2026 (USD Million)
      Fig.11	Global Quantum Dot Nanowire Solar Cells Quantum Dot Solar Cell Market, 2016 – 2026 (USD Million)
      Fig.12	Global Quantum Dot Solar Cell Market Share, by Material, 2020 & 2026 (USD Million)
      Fig.13	Global Cadmium-Based Quantum Dot Solar Cell Market, 2016 – 2026 (USD Million)
      Fig.14	Global Cadmium-Free Quantum Dot Solar Cell Market, 2016 – 2026 (USD Million)
      Fig.15	Global Quantum Dot Solar Cell Market Share, by End User, 2020 & 2026 (USD Million)
      Fig.16	Global Consumer Quantum Dot Solar Cell Market, 2016 – 2026 (USD Million)
      Fig.17	Global Commercial Quantum Dot Solar Cell Market, 2016 – 2026 (USD Million)
      Fig.18	Global Healthcare Quantum Dot Solar Cell Market, 2016 – 2026 (USD Million)
      Fig.19	Global Defense Quantum Dot Solar Cell Market, 2016 – 2026 (USD Million)
      Fig.20	Global Telecommunications Quantum Dot Solar Cell Market, 2016 – 2026 (USD Million)
      Fig.21	Global Others Quantum Dot Solar Cell Market, 2016 – 2026 (USD Million)
      Fig.22	Global Quantum Dot Solar Cell Market Share, by Region, 2020 & 2026 (USD Million)
      Fig.23	North America Quantum Dot Solar Cell Market, 2016 – 2026 (USD Million)
      Fig.24	U.S. Quantum Dot Solar Cell Market, 2016 – 2026 (USD Million)
      Fig.25	Canada Quantum Dot Solar Cell Market, 2016 – 2026 (USD Million)
      Fig.26	Europe Quantum Dot Solar Cell Market, 2016 – 2026 (USD Million)
      Fig.27	Germany Quantum Dot Solar Cell Market, 2016 – 2026 (USD Million)
      Fig.28	France Quantum Dot Solar Cell Market, 2016 – 2026 (USD Million)
      Fig.29	U.K. Quantum Dot Solar Cell Market, 2016 – 2026 (USD Million)
      Fig.30	Italy Quantum Dot Solar Cell Market, 2016 – 2026 (USD Million)
      Fig.31	Spain Quantum Dot Solar Cell Market, 2016 – 2026 (USD Million)
      Fig.32	Rest of Europe Quantum Dot Solar Cell Market, 2016 – 2026 (USD Million)
      Fig.33	Asia Pacific Quantum Dot Solar Cell Market, 2016 – 2026 (USD Million)
      Fig.34	China Quantum Dot Solar Cell Market, 2016 – 2026 (USD Million)
      Fig.35	Japan Quantum Dot Solar Cell Market, 2016 – 2026 (USD Million)
      Fig.36	India Quantum Dot Solar Cell Market, 2016 – 2026 (USD Million)
      Fig.37	South  Korea Quantum Dot Solar Cell Market, 2016 – 2026 (USD Million)
      Fig.38	South-East Asia Quantum Dot Solar Cell Market, 2016 – 2026 (USD Million)
      Fig.39	Rest of Asia Pacific Quantum Dot Solar Cell Market, 2016 – 2026 (USD Million)
      Fig.40	Latin America Quantum Dot Solar Cell Market, 2016 – 2026 (USD Million)
      Fig.41	Brazil Quantum Dot Solar Cell Market, 2016 – 2026 (USD Million)
      Fig.42	Mexico Quantum Dot Solar Cell Market, 2016 – 2026 (USD Million)
      Fig.43	Rest of Latin America Quantum Dot Solar Cell Market, 2016 – 2026 (USD Million)
      Fig.44	The Middle-East and Africa Quantum Dot Solar Cell Market, 2016 – 2026 (USD Million)
      Fig.45	GCC Countries Quantum Dot Solar Cell Market, 2016 – 2026 (USD Million)
      Fig.46	South Africa Quantum Dot Solar Cell Market, 2016 – 2026 (USD Million)
      Fig.47	Rest of Middle-East Africa Quantum Dot Solar Cell Market, 2016 – 2026 (USD Million)
      Fig.48	Competitor Market Share – Revenue
      Fig.49	Green Science Alliance Co. Ltd. Revenue and Growth Rate
      Fig.50	Green Science Alliance Co. Ltd. Market Share
      Fig.51	Plasmachem GmbH Revenue and Growth Rate
      Fig.52	Plasmachem GmbH Market Share
      Fig.53	Zhijing Nanotech Co. Ltd Revenue and Growth Rate
      Fig.54	Zhijing Nanotech Co. Ltd Market Share
      Fig.55	Avantama AG Revenue and Growth Rate
      Fig.56	Avantama AG Market Share
      Fig.57	Osram Licht Revenue and Growth Rate
      Fig.58	Osram Licht Market Share
      Fig.59	Samsung Electronics Revenue and Growth Rate
      Fig.60	Samsung Electronics Market Share
      Fig.61	Quantum Solutions LLC Revenue and Growth Rate
      Fig.62	Quantum Solutions LLC Market Share
      Fig.63	Crystalplex Corporation Revenue and Growth Rate
      Fig.64	Crystalplex Corporation Market Share
      Fig.65	Nanoco Group Revenue and Growth Rate
      Fig.66	Nanoco Group Market Share
      Fig.67	Nanosys Revenue and Growth Rate
      Fig.68	Nanosys Market Share
      Fig.69	Navillum Nanotechnologies Revenue and Growth Rate
      Fig.70	Navillum Nanotechnologies Market Share
      Fig.71	NN-Labs, Revenue and Growth Rate
      Fig.72	NN-Labs, Market Share
      Fig.73	Ocean NanoTech Revenue and Growth Rate
      Fig.74	Ocean NanoTech Market Share
      Fig.75	Market Dynamics
      Fig.76	Global Quantum Dot Solar Cell – Value Chain Analysis
      Fig.77	Key Mandates and Regulations
      Fig.78	Technology Roadmap and Timeline
      Fig.79	Market Attractiveness Analysis – By Product Type
      Fig.80	Market Attractiveness Analysis – By Material
      Fig.81	Market Attractiveness Analysis – By End User
      Fig.82	Market Attractiveness Analysis – By Region
      Fig.83	Quantum Dot Solar Cell Industrial Chain Analysis
      Fig.84	Market Channels
      Fig.85	Marketing Channel Development Trend
      Fig.86	Growth in World Gross Product, 2008-2018
      

      List of Tables

      	
      Table 1	Global Quantum Dot Solar Cell Market, 2020 & 2026 (USD Million)
      Table 2	Global Quantum Dot Solar Cell Market, by Product Type, 2016 – 2026 (USD Million)
      Table 3	Global Quantum Dot Solar Cell Market, by Material, 2016 – 2026 (USD Million)
      Table 4	Global Quantum Dot Solar Cell Market, by End User, 2016 – 2026 (USD Million)
      Table 5	Global Quantum Dot Solar Cell Market, by Region, 2016 – 2026 (USD Million)
      Table 6	North America Quantum Dot Solar Cell Market, by Country, 2016 – 2026 (USD Million)
      Table 7	North America Quantum Dot Solar Cell Market, by Product Type, 2016 – 2026 (USD Million)
      Table 8	North America Quantum Dot Solar Cell Market, by Material, 2016 – 2026 (USD Million)
      Table 9	North America Quantum Dot Solar Cell Market, by End User, 2016 – 2026 (USD Million)
      Table 10 Europe Quantum Dot Solar Cell Market, by Country, 2016 – 2026 (USD Million)
      Table 11 Europe Quantum Dot Solar Cell Market, by Product Type, 2016 – 2026 (USD Million)
      Table 12 Europe Quantum Dot Solar Cell Market, by Material, 2016 – 2026 (USD Million)
      Table 13 Europe Quantum Dot Solar Cell Market, by End User, 2016 – 2026 (USD Million)
      Table 14 Asia Pacific Quantum Dot Solar Cell Market, by Country, 2016 – 2026 (USD Million)
      Table 15 Asia Pacific Quantum Dot Solar Cell Market, by Product Type, 2016 – 2026 (USD Million)
      Table 16 Asia Pacific Quantum Dot Solar Cell Market, by Material, 2016 – 2026 (USD Million)
      Table 17 Asia Pacific Quantum Dot Solar Cell Market, by End User, 2016 – 2026 (USD Million)
      Table 18 Latin America Quantum Dot Solar Cell Market, by Country, 2016 – 2026 (USD Million)
      Table 19 Latin America Quantum Dot Solar Cell Market, by Product Type, 2016 – 2026 (USD Million)
      Table 20 Latin America Quantum Dot Solar Cell Market, by Material, 2016 – 2026 (USD Million)
      Table 21 Latin America Quantum Dot Solar Cell Market, by End User, 2016 – 2026 (USD Million)
      Table 22 The Middle-East and Africa Quantum Dot Solar Cell Market, by Country, 2016 – 2026 (USD Million)
      Table 23 The Middle-East and Africa Quantum Dot Solar Cell Market, by Product Type, 2016 – 2026 (USD Million)
      Table 24 The Middle-East and Africa Quantum Dot Solar Cell Market, by Material, 2016 – 2026 (USD Million)
      Table 25 The Middle-East and Africa Quantum Dot Solar Cell Market, by End User, 2016 – 2026 (USD Million)
      Table 26 Global Quantum Dot Solar Cell Market - Company Revenue Analysis, 2016 – 2019 (USD Million)
      Table 27 Global Quantum Dot Solar Cell Market - Company Revenue Share Analysis, 2016 – 2019 (%)
      Table 28 Acquisitions and Mergers
      Table 29 Market Drivers – Impact Analysis
      Table 30 Market Restraints
      Table 31 Market Opportunities
      Table 32 Major Buyers of Quantum Dot Solar Cell
      Table 33 Distributors/Traders of Quantum Dot Solar Cell by Region
      

Industry Major Market Players

  • Green Science Alliance Co. Ltd.
  • Plasmachem GmbH
  • Zhijing Nanotech Co. Ltd.
  • Avantama AG
  • Quantum Solutions LLC
  • Crystalplex Corporation
  • Nanoco Group
  • Nanosys
  • Navillum Nanotechnologies
  • NN-Labs
  • Ocean NanoTech
  • Osram Licht
  • Samsung Electronics