Search Market Research Report

Discover Our Latest Reports
Discover Our Featured Reports
Discover Top Selling Reports

Pulsed Power Market Size, Share Global Analysis Report, 2020–2026

report img

Pulsed Power Market By Application (Food Processing, Medical Treatment, Water Treatment, Exhaust Gas Treatment, Ozone Generation, Ion Implantation, Military, and Others): Global Industry Outlook, Market Size, Business Intelligence, Consumer Preferences, Statistical Surveys, Comprehensive Analysis, Historical Developments, Current Trends, and Forecast 2020–2026

Industry Insights

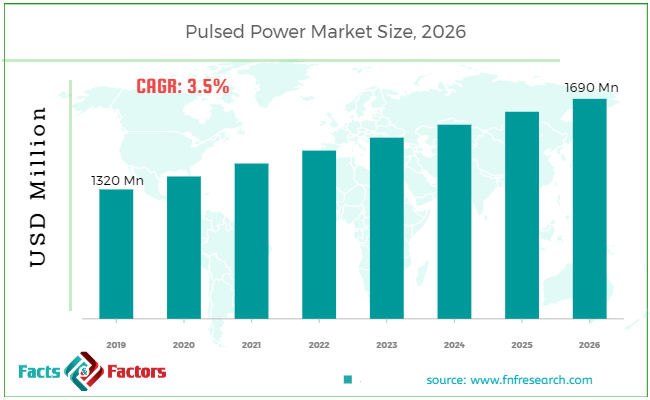
[190+ Pages Report] According to the report published by Facts Factors, the global pulsed power market size was worth around USD 1320 million in 2019 and is predicted to grow to around USD 1690 million by 2026 with a compound annual growth rate (CAGR) of roughly 3.5% between 2020 and 2026. The report analyzes the global pulsed power market drivers, restraints/challenges, and the effect they have on the demands during the projection period. In addition, the report explores emerging opportunities in the pulsed power market.

Pulsed Power Market

To know more about this report | Request Free Sample Copy

The pulsed power market report analyzes and notifies the industry statistics at the global as well as regional and country levels in order to acquire a thorough perspective of the entire pulsed power market. The historical and past insights are provided for FY 2016 to FY 2019 whereas projected trends are delivered for FY 2020 to FY 2026. The quantitative and numerical data is represented in terms of both volume (Units) and value (USD Million) from FY 2016 – 2026.


logoKey Insights from Primary Research

  • As per our primary respondents, the global pulsed power market is set to grow annually at a rate of around 3.5%
  • It was established through primary research that the pulsed power market was valued at around USD1320 Million in 2019
  • Presently, the United States and Europe are holding the largest revenue share among all the regions and is further expected to maintain its position throughout the forecast period.
  • On basis of application segment, ‘military’ dominated the global pulsed power market in 2019.
  • The global pulsed power market is expected to reach around USD 1690 Million by 2026.

logoKey Recommendations from Analysts

  • As per our analysts, the global pulsed power market is expected to grow significantly over the forecast period.
  • The strategic and competitive advantage provided by the pulsed power technology in aerospace and defence is anticipated to be the key factor driving this market globally.
  • As per analysts, the use of pulsed power in automotive – Capacitor Discharge Ignition (CDI) is slowly fading away as electric vehicles (EVs) are in more demand in mass market.
  • Our team of analysts has identified, use of Pulsed Electric Field in food industry will support the growth of the market.
  • U.S. is expected to be the fastest growing market for pulsed power during the years to come due to on-going research & development activities coupled with strong support of U.S. Government.

The quantitative data is further underlined and reinforced by comprehensive qualitative data which comprises various across-the-board market dynamics. The rationales which directly or indirectly impact the pulsed power industry are exemplified through parameters such as growth drivers, restraints, challenges, and opportunities among other impacting factors.

Throughout our research report, we have encompassed all the proven models and tools of industry analysis and extensively illustrated all the key business strategies and business models adopted in the Pulsed Power industry. The report provides an all-inclusive and detailed competitive landscape prevalent in the Pulsed Power market.

The report utilizes established industry analysis tools and models such as Porter’s Five Forces framework to analyze and recognize critical business strategies adopted by various stakeholders involved in the entire value chain of the Pulsed Power industry. The Pulsed Power market report additionally employs SWOT analysis and PESTLE analysis models for further in-depth analysis.

The report study further includes an in-depth analysis of industry players' market shares and provides an overview of leading players' market position in the pulsed power sector. Key strategic developments in the pulsed power market competitive landscape such as acquisitions & mergers, inaugurations of different products and services, partnerships & joint ventures, MoU agreements, VC & funding activities, R&D activities, and geographic expansion among other noteworthy activities by key players of the pulsed power market are appropriately highlighted in the report.

The purchasing pattern of the consumers worldwide is based on the evolving fashion trends and changing hairstyles. The market share is largely influenced by the product sales greatly impacted by religious beliefs and ethnic populations. Apparently, easy access to clips, ornamented pins, and bands on the e-commerce web portal will further accelerate the industry surge over the forecast timespan.

The global pulsed power market has witnessed significant growth in recent years due to increase usage in applications of pulsed power. Pulsed power-based water treatment services are expected to provide a new opportunity in the pharmaceutical industry and the pulp & paper industry during the years to come. Moreover, opportunity in the plastic industry and steel & metal industry for gas treatment.

logoReport Scope

Report Attribute

Details

Market Size in 2019

USD 1320 Million

Projected Market Size in 2026

USD 1690 Million

CAGR Growth Rate

3.5% CAGR

Base Year

2019

Forecast Years

2020-2026

Key Market Players

General Atomics, ScandiNova, Applied Pulsed Power (APP), Excelitas Technologies Corp., Sandia National Laboratories, Woodruff Scientific, Inc., Tetra Corporation, Astrol Electronic AG, Pulsed Power Plasmas Group, PPM Power, Dynatronix, Transient Plasma Systems, Inc., Riley Industries Ltd., MUNK GmbH, Quantel Laser, Ness Engineering, Inc, SLAC National, and Accelerator Laboratory, and Others

Key Segment

By Application, and Region

Major Regions Covered

North America, Europe, Asia Pacific, Latin America, and the Middle East & Africa

Purchase Options

Request customized purchase options to meet your research needs. Explore purchase options

The pulsed power market is concentrated in U.S., Europe, Russia, Germany, China, etc. there is a good opportunity to expand in the ROW such as Middle East & Africa, Latin America, and the Asia Pacific.

The pulsed power market research report delivers an acute valuation and taxonomy of the pulsed power industry by practically splitting the market on the basis of different types, applications, and regions. Through the analysis of the historical and projected trends, all the segments and sub-segments were evaluated through the bottom-up approach, and different market sizes have been projected for FY 2020 to FY 2026.

The regional segmentation of the pulsed power industry includes the complete classification of all the major continents including North America, Latin America, Europe, Asia Pacific, and Middle East & Africa. Further, country-wise data for the pulsed power industry is provided for the leading economies of the world.

On the basis of application, the global pulsed power market is bifurcated into food processing, medical treatment, water treatment, exhaust gas treatment, ozone generation, ion implantation, and military among others.

logoSome of the essential players operating in the pulsed power market, but not restricted to include

  • General Atomics
  • ScandiNova
  • Applied Pulsed Power (APP)
  • Excelitas Technologies Corp.
  • Sandia National Laboratories
  • Woodruff Scientific Inc.
  • Tetra Corporation
  • Astrol Electronic AG
  • Pulsed Power Plasmas Group
  • PPM Power
  • Dynatronix
  • Transient Plasma Systems Inc.
  • Riley Industries Ltd.
  • MUNK GmbH
  • Quantel Laser
  • Ness Engineering Inc
  • SLAC National
  • Accelerator Laboratory

The taxonomy of the pulsed power industry by its scope and segmentation is as follows:

logo By Application Segmentation Analysis

  • Food Processing
  • Medical Treatment
  • Water Treatment
  • Exhaust Gas Treatment
  • Ozone Generation
  • Ion Implantation
  • Military
  • Others

logo Regional Segmentation Analysis

  • North America
    • The U.S.
    • Canada
  • Europe
    • Germany
    • The UK
    • France
    • Spain
    • Italy
    • Rest of Europe
  • Asia Pacific
    • China
    • Japan
    • India
    • South Korea
    • Southeast Asia
    • Rest of Asia Pacific
  • Latin America
    • Brazil
    • Mexico
    • Rest of Latin America
  • Middle East & Africa
    • GCC
    • South Africa
    • Rest of Middle East & Africa

Table of Content

  1. CHAPTER 1. Executive Summary
  2. CHAPTER 2. Pulsed Power market – Application Analysis
    1. 2.1. Global Pulsed Power Market – Application Overview
    2. 2.2. Global Pulsed Power Market Share, by Application, 2018 & 2025 (USD Million)
    3. 2.3. Food Processing
      1. 2.3.1. Global Food Processing Pulsed Power Market, 2016-2026 (USD Million)
    4. 2.4. Medical Treatment
      1. 2.4.1. Global Medical Treatment Pulsed Power Market, 2016-2026 (USD Million)
    5. 2.5. Water Treatment
      1. 2.5.1. Global Water Treatment Pulsed Power Market, 2016-2026 (USD Million)
    6. 2.6. Exhaust Gas Treatment
      1. 2.6.1. Global Exhaust Gas Treatment Pulsed Power Market, 2016-2026 (USD Million)
    7. 2.7. Ozone Generation
      1. 2.7.1. Global Ozone Generation Pulsed Power Market, 2016-2026 (USD Million)
    8. 2.8. Ion Implantation
      1. 2.8.1. Global Ion Implantation Pulsed Power Market, 2016-2026 (USD Million)
    9. 2.9. Military
      1. 2.9.1. Global Military Pulsed Power Market, 2016-2026 (USD Million)
    10. 2.10. Others
      1. 2.10.1. Global Others Pulsed Power Market, 2016-2026 (USD Million)
  3. CHAPTER 3. Pulsed Power market – Regional Analysis
    1. 3.1. Global Pulsed Power Market Regional Overview
    2. 3.2. Global Pulsed Power Market Share, by Region, 2018 & 2025 (Value)
    3. 3.3. North America
      1. 3.3.1. North America Pulsed Power Market size and forecast, 2016-2026
      2. 3.3.2. North America Pulsed Power Market, by Country, 2018 & 2025 (USD Million)
      3. 3.3.3. North America Pulsed Power Market, by Application, 2016-2026
        1. 3.3.3.1. North America Pulsed Power Market, by Application, 2016-2026 (USD Million)
      4. 3.3.4. U.S.
        1. 3.3.4.1. U.S. Market size and forecast, 2016-2026 (USD Million)
      5. 3.3.5. Canada
        1. 3.3.5.1. Canada Market size and forecast, 2016-2026 (USD Million)
    4. 3.4. Europe
      1. 3.4.1. Europe Pulsed Power Market size and forecast, 2016-2026
      2. 3.4.2. Europe Pulsed Power Market, by Country, 2018 & 2025 (USD Million)
      3. 3.4.3. Europe Pulsed Power Market, by Application, 2016-2026
        1. 3.4.3.1. Europe Pulsed Power Market, by Application, 2016-2026 (USD Million)
      4. 3.4.4. Germany
        1. 3.4.4.1. Germany Market size and forecast, 2016-2026 (USD Million)
      5. 3.4.5. France
        1. 3.4.5.1. France Market size and forecast, 2016-2026 (USD Million)
      6. 3.4.6. U.K.
        1. 3.4.6.1. U.K. Market size and forecast, 2016-2026 (USD Million)
      7. 3.4.7. Italy
        1. 3.4.7.1. Italy Market size and forecast, 2016-2026 (USD Million)
      8. 3.4.8. Spain
        1. 3.4.8.1. Spain Market size and forecast, 2016-2026 (USD Million)
      9. 3.4.9. Rest of Europe
        1. 3.4.9.1. Rest of Europe Market size and forecast, 2016-2026 (USD Million)
    5. 3.5. Asia Pacific
      1. 3.5.1. Asia Pacific Pulsed Power Market size and forecast, 2016-2026
      2. 3.5.2. Asia Pacific Pulsed Power Market, by Country, 2018 & 2025 (USD Million)
      3. 3.5.3. Asia Pacific Pulsed Power Market, by Application, 2016-2026
        1. 3.5.3.1. Asia Pacific Pulsed Power Market, by Application, 2016-2026 (USD Million)
      4. 3.5.4. China
        1. 3.5.4.1. China Market size and forecast, 2016-2026 (USD Million)
      5. 3.5.5. Japan
        1. 3.5.5.1. Japan Market size and forecast, 2016-2026 (USD Million)
      6. 3.5.6. India
        1. 3.5.6.1. India Market size and forecast, 2016-2026 (USD Million)
      7. 3.5.7. South Korea
        1. 3.5.7.1. South Korea Market size and forecast, 2016-2026 (USD Million)
      8. 3.5.8. South-East Asia
        1. 3.5.8.1. South-East Asia Market size and forecast, 2016-2026 (USD Million)
      9. 3.5.9. Rest of Asia Pacific
        1. 3.5.9.1. Rest of Asia Pacific Market size and forecast, 2016-2026 (USD Million)
    6. 3.6. Latin America
      1. 3.6.1. Latin America Pulsed Power Market size and forecast, 2016-2026
      2. 3.6.2. Latin America Pulsed Power Market, by Country, 2018 & 2025 (USD Million)
      3. 3.6.3. Latin America Pulsed Power Market, by Application, 2016-2026
        1. 3.6.3.1. Latin America Pulsed Power Market, by Application, 2016-2026 (USD Million)
      4. 3.6.4. Brazil
        1. 3.6.4.1. Brazil Market size and forecast, 2016-2026 (USD Million)
      5. 3.6.5. Mexico
        1. 3.6.5.1. Mexico Market size and forecast, 2016-2026 (USD Million)
      6. 3.6.6. Rest of Latin America
        1. 3.6.6.1. Rest of Latin America Market size and forecast, 2016-2026 (USD Million)
    7. 3.7. The Middle-East and Africa
      1. 3.7.1. The Middle-East and Africa Pulsed Power Market size and forecast, 2016-2026
      2. 3.7.2. The Middle-East and Africa Pulsed Power Market, by Country, 2018 & 2025 (USD Million)
      3. 3.7.3. The Middle-East and Africa Pulsed Power Market, by Application, 2016-2026
        1. 3.7.3.1. The Middle-East and Africa Pulsed Power Market, by Application, 2016-2026 (USD Million)
      4. 3.7.4. GCC Countries
        1. 3.7.4.1. GCC Countries Market size and forecast, 2016-2026 (USD Million)
      5. 3.7.5. South Africa
        1. 3.7.5.1. South Africa Market size and forecast, 2016-2026 (USD Million)
      6. 3.7.6. Rest of Middle-East Africa
        1. 3.7.6.1. Rest of Middle-East Africa Market size and forecast, 2016-2026 (USD Million)
  4. CHAPTER 4. Pulsed Power market – Competitive Landscape
    1. 4.1. Competitor Market Share – Revenue
    2. 4.2. Market Concentration Rate Analysis, Top 3 and Top 5 Players
    3. 4.3. Strategic Development
      1. 4.3.1. Acquisitions and Mergers
      2. 4.3.2. New Products
      3. 4.3.3. Research & Development Activities
  5. CHAPTER 5. Company Profiles
    1. 5.1. General Atomics
      1. 5.1.1. Company Overview
      2. 5.1.2. General Atomics Revenue and Gross Margin
      3. 5.1.3. Product portfolio
      4. 5.1.4. Recent initiatives
    2. 5.2. ScandiNova
      1. 5.2.1. Company Overview
      2. 5.2.2. ScandiNova Revenue and Gross Margin
      3. 5.2.3. Product portfolio
      4. 5.2.4. Recent initiatives
    3. 5.3. Applied Pulsed Power(APP)
      1. 5.3.1. Company Overview
      2. 5.3.2. Applied Pulsed Power(APP) Revenue and Gross Margin
      3. 5.3.3. Product portfolio
      4. 5.3.4. Recent initiatives
    4. 5.4. Excelitas Technologies Corp.
      1. 5.4.1. Company Overview
      2. 5.4.2. Excelitas Technologies Corp. Revenue and Gross Margin
      3. 5.4.3. Product portfolio
      4. 5.4.4. Recent initiatives
    5. 5.5. Sandia National Laboratories
      1. 5.5.1. Company Overview
      2. 5.5.2. Sandia National Laboratories Revenue and Gross Margin
      3. 5.5.3. Product portfolio
      4. 5.5.4. Recent initiatives
    6. 5.6. Woodruff Scientific, Inc.
      1. 5.6.1. Company Overview
      2. 5.6.2. Woodruff Scientific, Inc. Revenue and Gross Margin
      3. 5.6.3. Product portfolio
      4. 5.6.4. Recent initiatives
    7. 5.7. Tetra Corporation
      1. 5.7.1. Company Overview
      2. 5.7.2. Tetra Corporation Revenue and Gross Margin
      3. 5.7.3. Product portfolio
      4. 5.7.4. Recent initiatives
    8. 5.8. Astrol Electronic AG
      1. 5.8.1. Company Overview
      2. 5.8.2. Astrol Electronic AG Revenue and Gross Margin
      3. 5.8.3. Product portfolio
      4. 5.8.4. Recent initiatives
    9. 5.9. Pulsed Power Plasmas Group
      1. 5.9.1. Company Overview
      2. 5.9.2. Pulsed Power Plasmas Group Revenue and Gross Margin
      3. 5.9.3. Product portfolio
      4. 5.9.4. Recent initiatives
    10. 5.10. PPM Power
      1. 5.10.1. Company Overview
      2. 5.10.2. PPM Power Revenue and Gross Margin
      3. 5.10.3. Product portfolio
      4. 5.10.4. Recent initiatives
    11. 5.11. Dynatronix
      1. 5.11.1. Company Overview
      2. 5.11.2. Dynatronix Revenue and Gross Margin
      3. 5.11.3. Product portfolio
      4. 5.11.4. Recent initiatives
    12. 5.12. Transient Plasma
      1. 5.12.1. Company Overview
      2. 5.12.2. Transient Plasma Revenue and Gross Margin
      3. 5.12.3. Product portfolio
      4. 5.12.4. Recent initiatives
    13. 5.13. Systems, Inc.
      1. 5.13.1. Company Overview
      2. 5.13.2. Systems, Inc. Revenue and Gross Margin
      3. 5.13.3. Product portfolio
      4. 5.13.4. Recent initiatives
    14. 5.14. Riley Industries Ltd.
      1. 5.14.1. Company Overview
      2. 5.14.2. Riley Industries Ltd. Revenue and Gross Margin
      3. 5.14.3. Product portfolio
      4. 5.14.4. Recent initiatives
    15. 5.15. MUNK GmbH
      1. 5.15.1. Company Overview
      2. 5.15.2. MUNK GmbH Revenue and Gross Margin
      3. 5.15.3. Product portfolio
      4. 5.15.4. Recent initiatives
    16. 5.16. Quantel Laser
      1. 5.16.1. Company Overview
      2. 5.16.2. Quantel Laser Revenue and Gross Margin
      3. 5.16.3. Product portfolio
      4. 5.16.4. Recent initiatives
    17. 5.17. Ness Engineering, Inc
      1. 5.17.1. Company Overview
      2. 5.17.2. Ness Engineering, Inc Revenue and Gross Margin
      3. 5.17.3. Product portfolio
      4. 5.17.4. Recent initiatives
    18. 5.18. SLAC National
      1. 5.18.1. Company Overview
      2. 5.18.2. SLAC National Revenue and Gross Margin
      3. 5.18.3. Product portfolio
      4. 5.18.4. Recent initiatives
    19. 5.19. Accelerator Laboratory
      1. 5.19.1. Company Overview
      2. 5.19.2. Accelerator Laboratory Revenue and Gross Margin
      3. 5.19.3. Product portfolio
      4. 5.19.4. Recent initiatives
  6. CHAPTER 6. Pulsed Power — Industry Analysis
    1. 6.1. Pulsed Power Market – Key Trends
      1. 6.1.1. Market Drivers
      2. 6.1.2. Market Restraints
      3. 6.1.3. Market Opportunities
    2. 6.2. Value Chain Analysis
    3. 6.3. Technology Roadmap and Timeline
    4. 6.4. Pulsed Power Market – Attractiveness Analysis
      1. 6.4.1. By Application
      2. 6.4.2. By Region
  7. CHAPTER 7. Marketing Strategy Analysis, Distributors
    1. 7.1. Marketing Channel
    2. 7.2. Direct Marketing
    3. 7.3. Indirect Marketing
    4. 7.4. Marketing Channel Development Trend
    5. 7.5. Economic/Political Environmental Change
  8. CHAPTER 8. Report Conclusion
  9. CHAPTER 9. Research Approach & Methodology
    1. 9.1. Report Description
    2. 9.2. Research Scope
    3. 9.3. Research Methodology
      1. 9.3.1. Secondary Research
      2. 9.3.2. Primary Research
      3. 9.3.3. Models
        1. 9.3.3.1. Company Share Analysis Model
        2. 9.3.3.2. Revenue Based Modeling
        3. 9.3.3.3. Research Limitations

  • List of Figures

    FIG. 1 Global Pulsed Power Market, 2016-2026 (USD Million)
    FIG. 2 Global Pulsed Power Market Share, by Application, 2018 & 2025 (USD Million)
    FIG. 3 Global Food Processing Pulsed Power Market, 2016-2026 (USD Million)
    FIG. 4 Global Medical Treatment Pulsed Power Market, 2016-2026 (USD Million)
    FIG. 5 Global Water Treatment Pulsed Power Market, 2016-2026 (USD Million)
    FIG. 6 Global Exhaust Gas Treatment Pulsed Power Market, 2016-2026 (USD Million)
    FIG. 7 Global Ozone Generation Pulsed Power Market, 2016-2026 (USD Million)
    FIG. 8 Global Ion Implantation Pulsed Power Market, 2016-2026 (USD Million)
    FIG. 9 Global Military Pulsed Power Market, 2016-2026 (USD Million)
    FIG. 10 Global Others Pulsed Power Market, 2016-2026 (USD Million)
    FIG. 11 Global Pulsed Power Market Share, by Region, 2018 & 2025
    FIG. 12 North America Pulsed Power Market, 2016-2026
    FIG. 13 U.S. Pulsed Power Market, 2016-2026
    FIG. 14 Canada Pulsed Power Market, 2016-2026
    FIG. 15 Europe Pulsed Power Market, 2016-2026
    FIG. 16 Germany Pulsed Power Market, 2016-2026
    FIG. 17 France Pulsed Power Market, 2016-2026
    FIG. 18 U.K. Pulsed Power Market, 2016-2026
    FIG. 19 Italy Pulsed Power Market, 2016-2026
    FIG. 20 Spain Pulsed Power Market, 2016-2026
    FIG. 21 Rest of Europe Pulsed Power Market, 2016-2026
    FIG. 22 Asia Pacific Pulsed Power Market, 2016-2026
    FIG. 23 China Pulsed Power Market, 2016-2026
    FIG. 24 Japan Pulsed Power Market, 2016-2026
    FIG. 25 India Pulsed Power Market, 2016-2026
    FIG. 26 South  Korea Pulsed Power Market, 2016-2026
    FIG. 27 South-East Asia Pulsed Power Market, 2016-2026
    FIG. 28 Rest of Asia Pacific Pulsed Power Market, 2016-2026
    FIG. 29 Latin America Pulsed Power Market, 2016-2026
    FIG. 30 Brazil Pulsed Power Market, 2016-2026
    FIG. 31 Mexico Pulsed Power Market, 2016-2026
    FIG. 32 Rest of Latin America Pulsed Power Market, 2016-2026
    FIG. 33 The Middle-East and Africa Pulsed Power Market, 2016-2026
    FIG. 34 GCC Countries Pulsed Power Market, 2016-2026
    FIG. 35 South Africa Pulsed Power Market, 2016-2026
    FIG. 36 Rest of Middle-East Africa Pulsed Power Market, 2016-2026
    FIG. 37 Competitor Market Share – Revenue
    FIG. 38 General Atomics Revenue and Growth Rate
    FIG. 39 General Atomics Market Share
    FIG. 40 ScandiNova Revenue and Growth Rate
    FIG. 41 ScandiNova Market Share
    FIG. 42 Applied Pulsed Power(APP) Revenue and Growth Rate
    FIG. 43 Applied Pulsed Power(APP) Market Share
    FIG. 44 Excelitas Technologies Corp. Revenue and Growth Rate
    FIG. 45 Excelitas Technologies Corp. Market Share
    FIG. 46 Sandia National Laboratories Revenue and Growth Rate
    FIG. 47 Sandia National Laboratories Market Share
    FIG. 48 Woodruff Scientific, Inc. Revenue and Growth Rate
    FIG. 49 Woodruff Scientific, Inc. Market Share
    FIG. 50 Tetra Corporation Revenue and Growth Rate
    FIG. 51 Tetra Corporation Market Share
    FIG. 52 Astrol Electronic AG Revenue and Growth Rate
    FIG. 53 Astrol Electronic AG Market Share
    FIG. 54 Pulsed Power Plasmas Group Revenue and Growth Rate
    FIG. 55 Pulsed Power Plasmas Group Market Share
    FIG. 56 PPM Power Revenue and Growth Rate
    FIG. 57 PPM Power Market Share
    FIG. 58 Dynatronix Revenue and Growth Rate
    FIG. 59 Dynatronix Market Share
    FIG. 60 Transient Plasma Revenue and Growth Rate
    FIG. 61 Transient Plasma Market Share
    FIG. 62 Systems, Inc. Revenue and Growth Rate
    FIG. 63 Systems, Inc. Market Share
    FIG. 64 Riley Industries Ltd. Revenue and Growth Rate
    FIG. 65 Riley Industries Ltd. Market Share
    FIG. 66 MUNK GmbH Revenue and Growth Rate
    FIG. 67 MUNK GmbH Market Share
    FIG. 68 Quantel Laser Revenue and Growth Rate
    FIG. 69 Quantel Laser Market Share
    FIG. 70 Ness Engineering, Inc Revenue and Growth Rate
    FIG. 71 Ness Engineering, Inc Market Share
    FIG. 72 SLAC National Revenue and Growth Rate
    FIG. 73 SLAC National Market Share
    FIG. 74 Accelerator Laboratory Revenue and Growth Rate
    FIG. 75 Accelerator Laboratory Market Share
    FIG. 76 Market Dynamics
    FIG. 77 Global Pulsed Power – Value Chain Analysis
    FIG. 78 Technology Roadmap and Timeline
    FIG. 79 Market Attractiveness Analysis – By Application
    FIG. 80 Market Attractiveness Analysis – By Region
    FIG. 81 Market Channel
    FIG. 82 Marketing Channel Development Trend
    FIG. 83 Growth in World Gross Product, 2008-2018

    List of Tables

    TABLE 1 Global Pulsed Power Market, 2018 & 2025 (USD Million)
    TABLE 2 Global Pulsed Power market, by Application, 2016-2026 (USD Million)
    TABLE 3 Global Pulsed Power market, by Region, 2016-2026 (USD Million)
    TABLE 4 North America Pulsed Power Market, by Application, 2016-2026 (USD Million)
    TABLE 5 Europe Pulsed Power Market, by Application, 2016-2026 (USD Million)
    TABLE 6 Asia Pacific Pulsed Power Market, by Application, 2016-2026 (USD Million)
    TABLE 7 Latin America Pulsed Power Market, by Application, 2016-2026 (USD Million)
    TABLE 8 The Middle-East and Africa Pulsed Power Market, by Application, 2016-2026 (USD Million)
    TABLE 9 Global Pulsed Power Market - Company Revenue Analysis 2016-2019 (USD Million)
    TABLE 10 Global Pulsed Power Market - Company Revenue Share Analysis 2016-2019(%)
    TABLE 11 Acquisitions and Mergers
    TABLE 12 New Product/Service Launch
    TABLE 13 Research & Development Activities
    TABLE 14 Market Drivers
    TABLE 15 Market Restraints
    TABLE 16 Market Opportunities
  •  

    Industry Major Market Players

    • General Atomics
    • ScandiNova
    • Applied Pulsed Power (APP)
    • Excelitas Technologies Corp.
    • Sandia National Laboratories
    • Woodruff Scientific Inc.
    • Tetra Corporation
    • Astrol Electronic AG
    • Pulsed Power Plasmas Group
    • PPM Power
    • Dynatronix
    • Transient Plasma Systems Inc.
    • Riley Industries Ltd.
    • MUNK GmbH
    • Quantel Laser
    • Ness Engineering Inc
    • SLAC National
    • Accelerator Laboratory