Search Market Research Report

Discover Our Latest Reports
Discover Our Featured Reports
Discover Top Selling Reports

Proptech Market Size, Share Global Analysis Report, 2026-2034

report img

Proptech Market Size, Share, Growth Analysis Report By Solution (Integrated Platform/Software, Standalone Software, and Others), By Deployment (Cloud, On-premises, and Others), By End-User (Real Estate Agents, Housing Associations, Property Investors, and Others), and By Region - Global Industry Insights, Overview, Comprehensive Analysis, Trends, Statistical Research, Market Intelligence, Historical Data and Forecast 2026-2034

Industry Insights

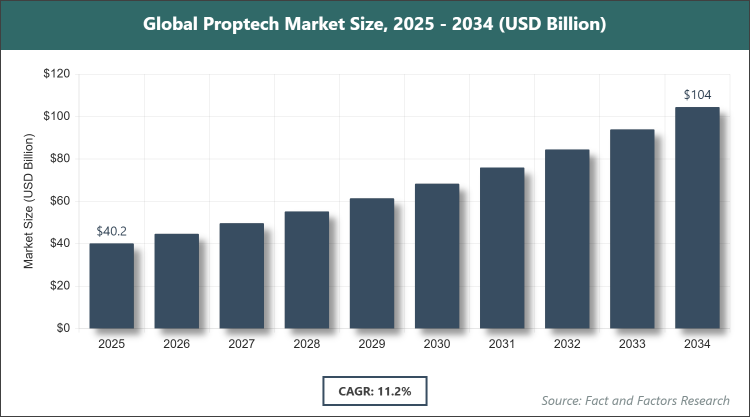
[225+ Pages Report] According to Facts & Factors, the global Proptech market size was estimated at USD 40.19 billion in 2025 and is expected to reach USD 104.57 billion by the end of 2034. The Proptech industry is anticipated to grow by a CAGR of 11.2% between 2026 and 2034. The Proptech Market is driven by increasing adoption of digital technologies and AI in real estate operations.

logoMarket Overview

Proptech, or property technology, refers to the integration of innovative digital solutions and technologies aimed at transforming the real estate industry, encompassing software platforms, hardware devices, and services that enhance property management, transactions, and user experiences. This market involves the application of tools like AI, IoT, blockchain, and big data analytics to streamline processes such as leasing, valuation, maintenance, and investment, addressing inefficiencies in traditional real estate practices by enabling smarter decision-making, improved transparency, and sustainable operations without incorporating numerical data.

logoKey Insights

  • As per the analysis shared by our research analyst, the global Proptech market is estimated to grow annually at a CAGR of around 11.2% over the forecast period (2026-2034).
  • In terms of revenue, the global Proptech market size was valued at around USD 40.19 billion in 2025 and is projected to reach USD 104.57 billion by 2034.
  • The market is driven by rapid digital transformation and the adoption of AI and IoT in real estate.
  • Based on the solution, the standalone software segment dominated with a 55% share due to its flexibility and ease of integration in diverse applications.
  • Based on the deployment, the cloud segment dominated with a 65% share owing to its scalability and cost-effectiveness for remote access.
  • Based on the end-user, the real estate agents segment dominated with a 40% share because of the need for efficient transaction and client management tools.
  • Based on the region, North America dominated with a 38% share attributed to advanced technological infrastructure and high investment in real estate tech.

logoGrowth Drivers

  • Digital Transformation in Real Estate

The shift toward digital platforms for property transactions, management, and analytics has accelerated due to the need for efficiency and transparency, with technologies like AI enabling predictive maintenance and virtual tours that reduce operational costs and enhance user engagement. This driver is supported by urbanisation and the demand for smart buildings.

Moreover, integration of IoT devices for real-time data collection optimises energy use and security, fostering sustainable practices and attracting eco-conscious investors, thereby expanding market reach.

logoRestraints

  • Data Privacy and Security Concerns

Increasing cyber threats and regulatory requirements for data protection hinder adoption, as stakeholders worry about breaches in sensitive property and financial information. This restraint demands robust security measures, increasing implementation costs.

Additionally, varying global standards complicate compliance, potentially delaying deployments and limiting cross-border expansions in the market.

logoOpportunities

  • Emergence of Sustainable Tech Solutions

The focus on green building technologies and ESG criteria opens avenues for proptech innovations in energy management and carbon tracking, appealing to environmentally aware markets. This opportunity aligns with global sustainability goals.

Furthermore, partnerships with governments for smart city projects can drive large-scale implementations, enhancing market penetration in developing regions.

logoChallenges

  • High Implementation Costs

Significant upfront investments in technology infrastructure deter small and medium enterprises from adopting proptech solutions, impacting overall market growth. This challenge requires affordable alternatives and financing options.

In addition, resistance to change from traditional real estate practices slows integration, necessitating education and demonstration of ROI to overcome inertia.

logoReport Scope

Report Attribute

Details

Market Size 2025

USD 40.19 Billion

Projected Market Size in 2034

USD 104.57 Billion

CAGR Growth Rate

11.2% CAGR

Base Year

2025

Forecast Years

2026-2034

Key Market Players

Zillow Group Inc., Opendoor Technologies Inc., Altus Group, Guesty Inc., Qualia Labs Inc., Ascendix Technologies, Zumper Inc., CoreLogic, MRI Software LLC, VTS (View The Space), and Others.

Key Segment

By Solution, By Deployment, By End-User, and By Region

Major Regions Covered

North America, Europe, Asia Pacific, Latin America, and the Middle East & Africa

Purchase Options

Request customized purchase options to meet your research needs. Explore purchase options

logoMarket Segmentation

The Proptech market is segmented by solution, deployment, end-user, and region.

Based on Solution Segment, the Proptech market is divided into integrated platform/software, standalone software, and others. The most dominant segment is standalone software, followed by integrated platform/software as the second most dominant. Standalone software dominates due to its modular nature allowing customization for specific needs like CRM or analytics without overhauling existing systems, driving the market by enabling quick adoption and cost savings for diverse real estate operations; integrated platform/software, offering comprehensive end-to-end solutions, supports growth by streamlining workflows across multiple functions, enhancing efficiency for larger enterprises.

Based on Deployment Segment, the Proptech market is divided into cloud, on-premises, and others. The most dominant segment is cloud, followed by on-premises as the second most dominant. Cloud deployment leads owing to its flexibility, remote accessibility, and subscription-based pricing that reduces capital expenditure, propelling market expansion through scalability for global operations; on-premises, preferred for data-sensitive applications requiring control, contributes to growth by providing customized security in regulated environments.

Based on End-User Segment, the Proptech market is divided into real estate agents, housing associations, property investors, and others. The most dominant segment is real estate agents, followed by property investors as the second most dominant. Real estate agents dominate as they leverage tools for listings, virtual showings, and client management to close deals faster, boosting the market via increased transaction volumes; property investors utilize analytics and valuation software for informed decisions, driving growth through optimized portfolio management.

logoRecent Developments

  • In February 2025, CoStar Group acquired Matterport for USD 1.6 billion to integrate 3D digital-twin technology with property data.
  • In May 2025, SCALARA secured €3 million to enhance its digital property-management software platform.
  • In October 2025, Arbio raised $36 million in Series A funding to expand its PropTech solutions.
  • In November 2025, Buena raised €49 million to grow its AI-powered property-management platform.

logoRegional Analysis

  • North America to Dominate the Global Market

North America dominates the Proptech market, led by the United States, where robust technological infrastructure, high venture capital investments, and a mature real estate sector foster innovation in AI-driven analytics and smart building solutions, supported by early adoption of digital tools that enhance efficiency and attract global talent.

Europe maintains significant growth, with the United Kingdom at the helm, benefiting from strong regulatory frameworks promoting sustainability and digital transactions, alongside a focus on blockchain for secure property deals that integrate with EU-wide smart city initiatives.

Asia Pacific is rapidly expanding, dominated by China, driven by massive urbanization, government-backed smart city projects, and increasing mobile tech penetration that accelerates adoption of virtual reality tours and IoT for property management.

Latin America shows emerging potential, led by Brazil, through rising foreign investments and digital infrastructure improvements that enable cloud-based platforms for affordable housing and commercial real estate optimization.

The Middle East & Africa region is progressing, with the United Arab Emirates leading via ambitious smart city developments like Dubai's initiatives, incorporating AI for energy-efficient buildings and attracting international Proptech collaborations.

logoCompetitive Analysis

The global Proptech market is dominated by players:

  • Zillow Group Inc.
  • Opendoor Technologies Inc.
  • Altus Group
  • Guesty Inc.
  • Qualia Labs Inc.
  • Ascendix Technologies
  • Zumper Inc.
  • CoreLogic
  • MRI Software LLC
  • VTS (View The Space)
  • Others

The global Proptech market is segmented as follows:

logoBy Solution

  • Integrated Platform/Software
  • Standalone Software

logoBy Deployment

  • Cloud
  • On-premises

logoBy End-User

  • Real Estate Agents
  • Housing Associations
  • Property Investors

logoBy Region

  • North America
    • The U.S.
    • Canada
    • Mexico
  • Europe
    • France
    • The UK
    • Spain
    • Germany
    • Italy
    • Rest of Europe
  • Asia Pacific
    • China
    • Japan
    • India
    • Australia
    • Southeast Asia
    • Rest of Asia Pacific
  • The Middle East & Africa
    • Saudi Arabia
    • UAE
    • Egypt
    • Kuwait
    • South Africa
    • Rest of the Middle East & Africa
  • Latin America
    • Brazil
    • Argentina
    • Rest of Latin America

Table of Content

  • Chapter 1. Preface
    • 1.1 Report Description and Scope
    • 1.2 Research Scope
    • 1.3 Research Methodology
      • 1.3.1 Market Research Type
      • 1.3.2 Market Research Methodology
  • Chapter 2. Executive Summary
    • 2.1 Global Proptech Market, (2026 - 2034) (USD Billion)
    • 2.2 Global Proptech Market: Snapshot
  • Chapter 3. Global Proptech Market - Industry Analysis
    • 3.1 Proptech Market: Market Dynamics
    • 3.2 Market Drivers
      • 3.2.1 Digital Transformation in Real Estate
    • 3.3 Market Restraints
      • 3.3.1. Data Privacy and Security Concerns
    • 3.4 Market Opportunities
      • 3.4.1. Emergence of Sustainable Tech Solutions
    • 3.5 Market Challenges
      • 3.5.1. High Implementation Costs
    • 3.6 Porter’s Five Forces Analysis
    • 3.7 Market Attractiveness Analysis
      • 3.7.1 Market Attractiveness Analysis By Solution
      • 3.7.2 Market Attractiveness Analysis By Deployment
      • 3.7.3 Market Attractiveness Analysis By End-User
  • Chapter 4. Global Proptech Market- Competitive Landscape
    • 4.1 Company Market Share Analysis
      • 4.1.1 Global Proptech Market: Company Market Share, 2025
    • 4.2 Strategic Development
      • 4.2.1 Acquisitions & Mergers
      • 4.2.2 New Product Launches
      • 4.2.3 Agreements, Partnerships, Collaborations, and Joint Ventures
      • 4.2.4 Research and Development and Regional Expansion
    • 4.3 Price Trend Analysis
  • Chapter 5. Global Proptech Market - By Solution Segment Analysis
    • 5.1 Global Proptech Market Overview: By Solution
      • 5.1.1 Global Proptech Market Share, By Solution, 2025 and 2034
    • 5.2 Integrated Platform/Software
      • 5.2.1 Global Proptech Market by Integrated Platform/Software, 2026 - 2034 (USD Billion)
    • 5.3 Standalone Software
      • 5.3.1 Global Proptech Market by Standalone Software, 2026 - 2034 (USD Billion)
  • Chapter 6. Global Proptech Market - By Deployment Segment Analysis
    • 6.1 Global Proptech Market Overview: By Deployment
      • 6.1.1 Global Proptech Market Share, By Deployment, 2025 and 2034
    • 6.2 Cloud
      • 6.2.1 Global Proptech Market by Cloud, 2026 - 2034 (USD Billion)
    • 6.3 On-premises
      • 6.3.1 Global Proptech Market by On-premises, 2026 - 2034 (USD Billion)
  • Chapter 7. Global Proptech Market - By End-User Segment Analysis
    • 7.1 Global Proptech Market Overview: By End-User
      • 7.1.1 Global Proptech Market Share, By End-User, 2025 and 2034
    • 7.2 Real Estate Agents
      • 7.2.1 Global Proptech Market by Real Estate Agents, 2026 - 2034 (USD Billion)
    • 7.3 Housing Associations
      • 7.3.1 Global Proptech Market by Housing Associations, 2026 - 2034 (USD Billion)
    • 7.4 Property Investors
      • 7.4.1 Global Proptech Market by Property Investors, 2026 - 2034 (USD Billion)
  • Chapter 8. Proptech Market - Regional Analysis
    • 8.1 Global Proptech Market Regional Overview
    • 8.2 Global Proptech Market Share, by Region, 2025 & 2034 (USD Billion)
    • 8.3. North America
      • 8.3.1 North America Proptech Market, 2026 - 2034 (USD Billion)
        • 8.3.1.1 North America Proptech Market, by Country, 2026 - 2034 (USD Billion)
    • 8.4 North America Proptech Market, by Solution, 2026 - 2034
      • 8.4.1 North America Proptech Market, by Solution, 2026 - 2034 (USD Billion)
    • 8.5 North America Proptech Market, by Deployment, 2026 - 2034
      • 8.5.1 North America Proptech Market, by Deployment, 2026 - 2034 (USD Billion)
    • 8.6 North America Proptech Market, by End-User, 2026 - 2034
      • 8.6.1 North America Proptech Market, by End-User, 2026 - 2034 (USD Billion)
    • 8.7. Europe
      • 8.7.1 Europe Proptech Market, 2026 - 2034 (USD Billion)
        • 8.7.1.1 Europe Proptech Market, by Country, 2026 - 2034 (USD Billion)
    • 8.8 Europe Proptech Market, by Solution, 2026 - 2034
      • 8.8.1 Europe Proptech Market, by Solution, 2026 - 2034 (USD Billion)
    • 8.9 Europe Proptech Market, by Deployment, 2026 - 2034
      • 8.9.1 Europe Proptech Market, by Deployment, 2026 - 2034 (USD Billion)
    • 8.10 Europe Proptech Market, by End-User, 2026 - 2034
      • 8.10.1 Europe Proptech Market, by End-User, 2026 - 2034 (USD Billion)
    • 8.11. Asia Pacific
      • 8.11.1 Asia Pacific Proptech Market, 2026 - 2034 (USD Billion)
        • 8.11.1.1 Asia Pacific Proptech Market, by Country, 2026 - 2034 (USD Billion)
    • 8.12 Asia Pacific Proptech Market, by Solution, 2026 - 2034
      • 8.12.1 Asia Pacific Proptech Market, by Solution, 2026 - 2034 (USD Billion)
    • 8.13 Asia Pacific Proptech Market, by Deployment, 2026 - 2034
      • 8.13.1 Asia Pacific Proptech Market, by Deployment, 2026 - 2034 (USD Billion)
    • 8.14 Asia Pacific Proptech Market, by End-User, 2026 - 2034
      • 8.14.1 Asia Pacific Proptech Market, by End-User, 2026 - 2034 (USD Billion)
    • 8.15. Latin America
      • 8.15.1 Latin America Proptech Market, 2026 - 2034 (USD Billion)
        • 8.15.1.1 Latin America Proptech Market, by Country, 2026 - 2034 (USD Billion)
    • 8.16 Latin America Proptech Market, by Solution, 2026 - 2034
      • 8.16.1 Latin America Proptech Market, by Solution, 2026 - 2034 (USD Billion)
    • 8.17 Latin America Proptech Market, by Deployment, 2026 - 2034
      • 8.17.1 Latin America Proptech Market, by Deployment, 2026 - 2034 (USD Billion)
    • 8.18 Latin America Proptech Market, by End-User, 2026 - 2034
      • 8.18.1 Latin America Proptech Market, by End-User, 2026 - 2034 (USD Billion)
    • 8.19. The Middle-East and Africa
      • 8.19.1 The Middle-East and Africa Proptech Market, 2026 - 2034 (USD Billion)
        • 8.19.1.1 The Middle-East and Africa Proptech Market, by Country, 2026 - 2034 (USD Billion)
    • 8.20 The Middle-East and Africa Proptech Market, by Solution, 2026 - 2034
      • 8.20.1 The Middle-East and Africa Proptech Market, by Solution, 2026 - 2034 (USD Billion)
    • 8.21 The Middle-East and Africa Proptech Market, by Deployment, 2026 - 2034
      • 8.21.1 The Middle-East and Africa Proptech Market, by Deployment, 2026 - 2034 (USD Billion)
    • 8.22 The Middle-East and Africa Proptech Market, by End-User, 2026 - 2034
      • 8.22.1 The Middle-East and Africa Proptech Market, by End-User, 2026 - 2034 (USD Billion)
  • Chapter 9. Company Profiles
    • 9.1 Zillow Group Inc.
      • 9.1.1 Overview
      • 9.1.2 Financials
      • 9.1.3 Product Portfolio
      • 9.1.4 Business Strategy
      • 9.1.5 Recent Developments
    • 9.2 Opendoor Technologies Inc.
      • 9.2.1 Overview
      • 9.2.2 Financials
      • 9.2.3 Product Portfolio
      • 9.2.4 Business Strategy
      • 9.2.5 Recent Developments
    • 9.3 Altus Group
      • 9.3.1 Overview
      • 9.3.2 Financials
      • 9.3.3 Product Portfolio
      • 9.3.4 Business Strategy
      • 9.3.5 Recent Developments
    • 9.4 Guesty Inc.
      • 9.4.1 Overview
      • 9.4.2 Financials
      • 9.4.3 Product Portfolio
      • 9.4.4 Business Strategy
      • 9.4.5 Recent Developments
    • 9.5 Qualia Labs Inc.
      • 9.5.1 Overview
      • 9.5.2 Financials
      • 9.5.3 Product Portfolio
      • 9.5.4 Business Strategy
      • 9.5.5 Recent Developments
    • 9.6 Ascendix Technologies
      • 9.6.1 Overview
      • 9.6.2 Financials
      • 9.6.3 Product Portfolio
      • 9.6.4 Business Strategy
      • 9.6.5 Recent Developments
    • 9.7 Zumper Inc.
      • 9.7.1 Overview
      • 9.7.2 Financials
      • 9.7.3 Product Portfolio
      • 9.7.4 Business Strategy
      • 9.7.5 Recent Developments
    • 9.8 CoreLogic
      • 9.8.1 Overview
      • 9.8.2 Financials
      • 9.8.3 Product Portfolio
      • 9.8.4 Business Strategy
      • 9.8.5 Recent Developments
    • 9.9 MRI Software LLC
      • 9.9.1 Overview
      • 9.9.2 Financials
      • 9.9.3 Product Portfolio
      • 9.9.4 Business Strategy
      • 9.9.5 Recent Developments
    • 9.10 VTS (View The Space)
      • 9.10.1 Overview
      • 9.10.2 Financials
      • 9.10.3 Product Portfolio
      • 9.10.4 Business Strategy
      • 9.10.5 Recent Developments

List of Figures

  • 1. Market Research Type
  • 2. Market Research Methodology
  • 3. Global Proptech Market, 2026 - 2034 (USD Billion)
  • 4. Porter’s Five Forces Analysis
  • 5. Global Proptech Market Attractiveness, By Solution
  • 6. Global Proptech Market Attractiveness, By Deployment
  • 7. Global Proptech Market Attractiveness, By End-User
  • 8. Global Proptech Market Share by Solution, 2026 and 2034 (USD Billion)
  • 9. Global Proptech Market by Integrated Platform/Software, 2026 - 2034 (USD Billion)
  • 10. Global Proptech Market by Standalone Software, 2026 - 2034 (USD Billion)
  • 11. Global Proptech Market Share by Deployment, 2026 and 2034 (USD Billion)
  • 12. Global Proptech Market by Cloud, 2026 - 2034 (USD Billion)
  • 13. Global Proptech Market by On-premises, 2026 - 2034 (USD Billion)
  • 14. Global Proptech Market Share by End-User, 2026 and 2034 (USD Billion)
  • 15. Global Proptech Market by Real Estate Agents, 2026 - 2034 (USD Billion)
  • 16. Global Proptech Market by Housing Associations, 2026 - 2034 (USD Billion)
  • 17. Global Proptech Market by Property Investors, 2026 - 2034 (USD Billion)
  • 18. Global Proptech Market Share, by Region, 2026 and 2034
  • 19. North America Proptech Market, 2026 - 2034 (USD Billion)
  • 20. Europe Proptech Market, 2026 - 2034 (USD Billion)
  • 21. Asia Pacific Proptech Market, 2026 - 2034 (USD Billion)
  • 22. Latin America Proptech Market, 2026 - 2034 (USD Billion)
  • 23. The Middle-East and Africa Proptech Market, 2026 - 2034 (USD Billion)

List of Tables

  • 1. Global Proptech Market: Snapshot
  • 2. Drivers of the Proptech Market: Impact Analysis
  • 3. North America Proptech Market Revenue, By Solution, 2026 - 2034 (USD Billion)
  • 4. North America Proptech Market Revenue, By Deployment, 2026 - 2034 (USD Billion)
  • 5. North America Proptech Market Revenue, By End-User, 2026 - 2034 (USD Billion)
  • 6. U.S. Proptech Market Revenue, By Solution, 2026 - 2034 (USD Billion)
  • 7. U.S. Proptech Market Revenue, By Deployment, 2026 - 2034 (USD Billion)
  • 8. U.S. Proptech Market Revenue, By End-User, 2026 - 2034 (USD Billion)
  • 9. Canada Proptech Market Revenue, By Solution, 2026 - 2034 (USD Billion)
  • 10. Canada Proptech Market Revenue, By Deployment, 2026 - 2034 (USD Billion)
  • 11. Canada Proptech Market Revenue, By End-User, 2026 - 2034 (USD Billion)
  • 12. Europe Proptech Market Revenue, By Solution, 2026 - 2034 (USD Billion)
  • 13. Europe Proptech Market Revenue, By Deployment, 2026 - 2034 (USD Billion)
  • 14. Europe Proptech Market Revenue, By End-User, 2026 - 2034 (USD Billion)
  • 15. Germany Proptech Market Revenue, By Solution, 2026 - 2034 (USD Billion)
  • 16. Germany Proptech Market Revenue, By Deployment, 2026 - 2034 (USD Billion)
  • 17. Germany Proptech Market Revenue, By End-User, 2026 - 2034 (USD Billion)
  • 18. France Proptech Market Revenue, By Solution, 2026 - 2034 (USD Billion)
  • 19. France Proptech Market Revenue, By Deployment, 2026 - 2034 (USD Billion)
  • 20. France Proptech Market Revenue, By End-User, 2026 - 2034 (USD Billion)
  • 21. U.K. Proptech Market Revenue, By Solution, 2026 - 2034 (USD Billion)
  • 22. U.K. Proptech Market Revenue, By Deployment, 2026 - 2034 (USD Billion)
  • 23. U.K. Proptech Market Revenue, By End-User, 2026 - 2034 (USD Billion)
  • 24. Italy Proptech Market Revenue, By Solution, 2026 - 2034 (USD Billion)
  • 25. Italy Proptech Market Revenue, By Deployment, 2026 - 2034 (USD Billion)
  • 26. Italy Proptech Market Revenue, By End-User, 2026 - 2034 (USD Billion)
  • 27. Spain Proptech Market Revenue, By Solution, 2026 - 2034 (USD Billion)
  • 28. Spain Proptech Market Revenue, By Deployment, 2026 - 2034 (USD Billion)
  • 29. Spain Proptech Market Revenue, By End-User, 2026 - 2034 (USD Billion)
  • 30. Rest of Europe Proptech Market Revenue, By Solution, 2026 - 2034 (USD Billion)
  • 31. Rest of Europe Proptech Market Revenue, By Deployment, 2026 - 2034 (USD Billion)
  • 32. Rest of Europe Proptech Market Revenue, By End-User, 2026 - 2034 (USD Billion)
  • 33. Asia Pacific Proptech Market Revenue, By Solution, 2026 - 2034 (USD Billion)
  • 34. Asia Pacific Proptech Market Revenue, By Deployment, 2026 - 2034 (USD Billion)
  • 35. Asia Pacific Proptech Market Revenue, By End-User, 2026 - 2034 (USD Billion)
  • 36. China Proptech Market Revenue, By Solution, 2026 - 2034 (USD Billion)
  • 37. China Proptech Market Revenue, By Deployment, 2026 - 2034 (USD Billion)
  • 38. China Proptech Market Revenue, By End-User, 2026 - 2034 (USD Billion)
  • 39. Japan Proptech Market Revenue, By Solution, 2026 - 2034 (USD Billion)
  • 40. Japan Proptech Market Revenue, By Deployment, 2026 - 2034 (USD Billion)
  • 41. Japan Proptech Market Revenue, By End-User, 2026 - 2034 (USD Billion)
  • 42. India Proptech Market Revenue, By Solution, 2026 - 2034 (USD Billion)
  • 43. India Proptech Market Revenue, By Deployment, 2026 - 2034 (USD Billion)
  • 44. India Proptech Market Revenue, By End-User, 2026 - 2034 (USD Billion)
  • 45. South Korea Proptech Market Revenue, By Solution, 2026 - 2034 (USD Billion)
  • 46. South Korea Proptech Market Revenue, By Deployment, 2026 - 2034 (USD Billion)
  • 47. South Korea Proptech Market Revenue, By End-User, 2026 - 2034 (USD Billion)
  • 48. South-East Asia Proptech Market Revenue, By Solution, 2026 - 2034 (USD Billion)
  • 49. South-East Asia Proptech Market Revenue, By Deployment, 2026 - 2034 (USD Billion)
  • 50. South-East Asia Proptech Market Revenue, By End-User, 2026 - 2034 (USD Billion)
  • 51. Rest of Asia Pacific Proptech Market Revenue, By Solution, 2026 - 2034 (USD Billion)
  • 52. Rest of Asia Pacific Proptech Market Revenue, By Deployment, 2026 - 2034 (USD Billion)
  • 53. Rest of Asia Pacific Proptech Market Revenue, By End-User, 2026 - 2034 (USD Billion)
  • 54. Latin America Proptech Market Revenue, By Solution, 2026 - 2034 (USD Billion)
  • 55. Latin America Proptech Market Revenue, By Deployment, 2026 - 2034 (USD Billion)
  • 56. Latin America Proptech Market Revenue, By End-User, 2026 - 2034 (USD Billion)
  • 57. Brazil Proptech Market Revenue, By Solution, 2026 - 2034 (USD Billion)
  • 58. Brazil Proptech Market Revenue, By Deployment, 2026 - 2034 (USD Billion)
  • 59. Brazil Proptech Market Revenue, By End-User, 2026 - 2034 (USD Billion)
  • 60. Mexico Proptech Market Revenue, By Solution, 2026 - 2034 (USD Billion)
  • 61. Mexico Proptech Market Revenue, By Deployment, 2026 - 2034 (USD Billion)
  • 62. Mexico Proptech Market Revenue, By End-User, 2026 - 2034 (USD Billion)
  • 63. Rest of Latin America Proptech Market Revenue, By Solution, 2026 - 2034 (USD Billion)
  • 64. Rest of Latin America Proptech Market Revenue, By Deployment, 2026 - 2034 (USD Billion)
  • 65. Rest of Latin America Proptech Market Revenue, By End-User, 2026 - 2034 (USD Billion)
  • 66. The Middle-East and Africa Proptech Market Revenue, By Solution, 2026 - 2034 (USD Billion)
  • 67. The Middle-East and Africa Proptech Market Revenue, By Deployment, 2026 - 2034 (USD Billion)
  • 68. The Middle-East and Africa Proptech Market Revenue, By End-User, 2026 - 2034 (USD Billion)
  • 69. GCC Countries Proptech Market Revenue, By Solution, 2026 - 2034 (USD Billion)
  • 70. GCC Countries Proptech Market Revenue, By Deployment, 2026 - 2034 (USD Billion)
  • 71. GCC Countries Proptech Market Revenue, By End-User, 2026 - 2034 (USD Billion)
  • 72. South Africa Proptech Market Revenue, By Solution, 2026 - 2034 (USD Billion)
  • 73. South Africa Proptech Market Revenue, By Deployment, 2026 - 2034 (USD Billion)
  • 74. South Africa Proptech Market Revenue, By End-User, 2026 - 2034 (USD Billion)
  • 75. Rest of Middle-East Africa Proptech Market Revenue, By Solution, 2026 - 2034 (USD Billion)
  • 76. Rest of Middle-East Africa Proptech Market Revenue, By Deployment, 2026 - 2034 (USD Billion)
  • 77. Rest of Middle-East Africa Proptech Market Revenue, By End-User, 2026 - 2034 (USD Billion)

Industry Major Market Players

  • Zillow Group Inc.
  • Opendoor Technologies Inc.
  • Altus Group
  • Guesty Inc.
  • Qualia Labs Inc.
  • Ascendix Technologies
  • Zumper Inc.
  • CoreLogic
  • MRI Software LLC
  • VTS (View The Space)