Search Market Research Report

Discover Our Latest Reports
Discover Our Featured Reports
Discover Top Selling Reports

Professional Service Automation (PSA) Software Market Size, Share Global Analysis Report, 2021 – 2026

report img

Professional Service Automation (PSA) Software Market By End-Users (Consulting Firms, Technology Companies, Marketing & Communications Firms, & Others), By Deployment Mode (Cloud Based & On-Premise), And By Regions - Global & Regional Industry Perspective, Comprehensive Analysis, and Forecast 2021 – 2026

Industry Insights

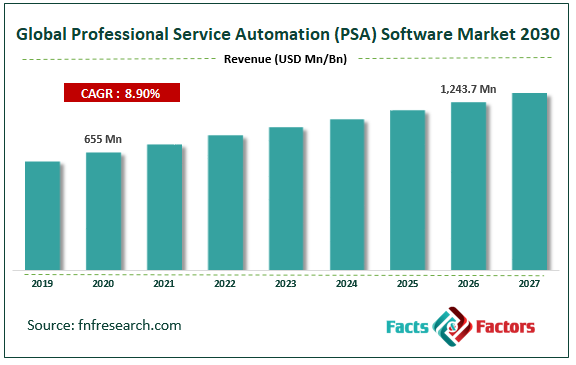
[187+ Pages Report] The latest finding surrounding the “Global Professional Service Automation (PSA) Software Market” published by Facts & Factorsoffers complete market overview. In this report, the global professional service automation (PSA) software market is projected to reach USD 1,243.7 Million by 2026, with a growth rate of 8.9% CAGR from an initial value of USD 655 Million in 2020.

Global Professional Service Automation (PSA) Software Market Size

To know more about this report | Request Free Sample Copy

logoMarket Overview

Professional service automation (PSA) is a set of software tools that aid professional services firms in organizing their tasks effectively in order to attain a higher level of productivity thereby increasing their profitability. These software solutions have the capability of managing complete business requirements such as project management, billing, invoice management, time tracking, expense management, and resource allocation. PSA services are often employed in large-scale organizations; however, small-scale organizations still utilize spreadsheet-based operations in order to save costs.

logoIndustry Growth Factors

The global professional service automation (PSA) software market is expected to be driven by contributing factors such as rising efficiency measures and operational visibility projects requirements coupled with service-driven organizations owing to changing business models to name a few. Additionally, rising functionalities of PSA services owing to resource management, automated timing and billing, and project management solutions are expected to increase the consumer base for the global professional service automation (PSA) software market during the forecast period. Moreover, the integration of advanced capabilities such as AI and ML have led to forecasting capabilities within these services coupled with services pertaining to better consumer satisfaction is expected to improve revenue opportunities for the global professional service automation (PSA) software market during the forecast period.

The global professional service automation (PSA) software market is expected to be driven by factors pertaining to efficient implementation leading to tighter profit margins coupled with an added focus toward improving the new generation of PSA models to name a few. Other factors including the functioning of PSA software in mobile devices, graphical reporting dashboards, and integration within social media channels are expected to boost the global professional service automation (PSA) software market during the forecast duration. However, a higher cost of implementation coupled with a lack of skilled workforce is expected to decrease the market share for the global professional service automation (PSA) software market during the forecast period.

logoSegmentation Analysis

The global professional service automation (PSA) software market is segmented into end-users, deployment mode, and region.

On the basis of end-users, the global professional service automation (PSA) software market is divided into consulting firms, technology companies, marketing, and communications firms, and others. The technology companies segment is expected to witness the largest market share during the advent of the forecast owing to dynamic resources in tandem coupled with rapid moving projects to name a few. Additionally, the increasing popularity of PSA software within technology firms coupled with the rising prevalence of social media and digital marketing is expected to cement the latter segment’s position during the advent of the forecast. On the basis of deployment mode, the global professional service automation (PSA) software market is classified into cloud-based and on-premise deployment. The segment pertaining to cloud-based deployment is expected to witness the largest market share during the advent of the forecast owing to rising functionality and compatibility measures employed by the current generation of cloud services coupled with a pay-as-you-use model to name a few. Additionally, increasing benefits of cloud-based services over their counterparts coupled with reduced technological costs and disaster recovery measures are expected to cement the dominant market position of the latter’s position during the advent of the forecast.

logo Report Scope

Report Attribute

Details

Market Size in 2020

USD 655 Million

Projected Market Size in 2026

USD 1,243.7 Million

CAGR Growth Rate

8.9% CAGR

Base Year

2020

Forecast Years

2021-2026

Key Market Players

Appirio, Inc., ChangePoint, ConnectWise, FinancialForce.com, Microsoft Corporation, NetSuite OpenAir, Projector PSA, Tenroxare, Autotask Corporation, SAP, Upland Software, Project Open Business Solution LLC, Kaseya Limited, and Oracle, among others

Key Segments

End-Users, Deployment Mode, and Region

Major Regions Covered

North America, Europe, Asia Pacific, Latin America, and Middle East & Africa

Purchase Options

Request customized purchase options to meet your research needs. Explore purchase options

logo Regional Analysis

North America is expected to witness the largest market share during the advent of the forecast owing to the region is the home to a majority of technological firms coupled with a rising innovative outlook in the sector to name a few. Additionally, the rising demand for services is expected to be driven by a rapidly aging workforce coupled with the increasing need for effective allocation of resources is expected to increase the footprint of the professional service automation (PSA) software market during the forecast duration. Moreover, factors pertaining to the rapid adoption of important technologies coupled with increased adoption of online service deliveries are expected to boost the growth of the professional service automation (PSA) software market during the forecast period. The professional service automation (PSA) software market is further expected to be driven toward a larger consumer base in the region owing to firms adopting an inorganic growth model coupled with early adoption of the technology in the sector to name a few.

logo Competitive Players

The key market participants for the global professional service automation (PSA) software market are:

  • Appirio Inc.
  • ChangePoint
  • ConnectWise
  • FinancialForce.com
  • Microsoft Corporation
  • NetSuite OpenAir
  • Projector PSA
  • Tenroxare
  • Autotask Corporation
  • SAP
  • Upland Software
  • Project Open Business Solution LLC
  • Kaseya Limited
  • Oracle

logo By End-Users Segment Analysis

  • Consulting Firms
  • Technology Companies
  • Marketing & Communications Firms
  • Others

logo By Deployment Mode Segment Analysis

  • Cloud-Based
  • On-Premise

Table of Content

  1. Chapter 1 Executive Summary
    1. 1.1. Introduction of Professional Service Automation (PSA) Software
    2. 1.2. Global Professional Service Automation (PSA) Software Market, 2019 & 2026 (USD Million)
    3. 1.3. Global Professional Service Automation (PSA) Software Market, 2016 – 2026 (USD Million)
    4. 1.4. Global Professional Service Automation (PSA) Software Market Absolute Revenue Opportunity, 2016 – 2026 (USD Million)
    5. 1.5. Global Professional Service Automation (PSA) Software Market Incremental Revenue Opportunity, 2020 – 2026 (USD Million)
  2. Chapter 2 Professional Service Automation (PSA) Software Market – End-Users Analysis
    1. 2.1. Global Professional Service Automation (PSA) Software Market – End-Users Overview
    2. 2.2. Global Professional Service Automation (PSA) Software Market Share, by End-Users, 2019 & 2026 (USD Million)
    3. 2.3. Consulting Firms
      1. 2.3.1. Global Consulting Firms Professional Service Automation (PSA) Software Market, 2016 – 2026 (USD Million)
    4. 2.4. Technology Companies
      1. 2.4.1. Global Technology Companies Professional Service Automation (PSA) Software Market, 2016 – 2026 (USD Million)
    5. 2.5. Marketing & Communications Firms
      1. 2.5.1. Global Marketing & Communications Firms Professional Service Automation (PSA) Software Market, 2016 – 2026 (USD Million)
    6. 2.6. Others
      1. 2.6.1. Global Others Professional Service Automation (PSA) Software Market, 2016 – 2026 (USD Million)
  3. Chapter 3 Professional Service Automation (PSA) Software Market – Deployment Mode Analysis
    1. 3.1. Global Professional Service Automation (PSA) Software Market – Deployment Mode Overview
    2. 3.2. Global Professional Service Automation (PSA) Software Market Share, by Deployment Mode, 2019 & 2026 (USD Million)
    3. 3.3. Cloud Based
      1. 3.3.1. Global Cloud Based Professional Service Automation (PSA) Software Market, 2016 – 2026 (USD Million)
    4. 3.4. On-Premise
      1. 3.4.1. Global On-Premise Professional Service Automation (PSA) Software Market, 2016 – 2026 (USD Million)
  4. Chapter 4 Professional Service Automation (PSA) Software Market – Regional Analysis
    1. 4.1. Global Professional Service Automation (PSA) Software Market Regional Overview
    2. 4.2. Global Professional Service Automation (PSA) Software Market Share, by Region, 2019 & 2026 (USD Million)
    3. 4.3. North America
      1. 4.3.1. North America Professional Service Automation (PSA) Software Market, 2016 – 2026 (USD Million)
        1. 4.3.1.1. North America Professional Service Automation (PSA) Software Market, by Country, 2016 - 2026 (USD Million)
      2. 4.3.2. North America Professional Service Automation (PSA) Software Market, by End-Users, 2016 – 2026
        1. 4.3.2.1. North America Professional Service Automation (PSA) Software Market, by End-Users, 2016 – 2026 (USD Million)
      3. 4.3.3. North America Professional Service Automation (PSA) Software Market, by Deployment Mode, 2016 – 2026
        1. 4.3.3.1. North America Professional Service Automation (PSA) Software Market, by Deployment Mode, 2016 – 2026 (USD Million)
      4. 4.3.4. U.S.
        1. 4.3.4.1. U.S. Professional Service Automation (PSA) Software Market, 2016 – 2026 (USD Million)
      5. 4.3.5. Canada
        1. 4.3.5.1. Canada Professional Service Automation (PSA) Software Market, 2016 – 2026 (USD Million)
    4. 4.4. Europe
      1. 4.4.1. Europe Professional Service Automation (PSA) Software Market, 2016 – 2026 (USD Million)
        1. 4.4.1.1. Europe Professional Service Automation (PSA) Software Market, by Country, 2016 - 2026 (USD Million)
      2. 4.4.2. Europe Professional Service Automation (PSA) Software Market, by End-Users, 2016 – 2026
        1. 4.4.2.1. Europe Professional Service Automation (PSA) Software Market, by End-Users, 2016 – 2026 (USD Million)
      3. 4.4.3. Europe Professional Service Automation (PSA) Software Market, by Deployment Mode, 2016 – 2026
        1. 4.4.3.1. Europe Professional Service Automation (PSA) Software Market, by Deployment Mode, 2016 – 2026 (USD Million)
      4. 4.4.4. Germany
        1. 4.4.4.1. Germany Professional Service Automation (PSA) Software Market, 2016 – 2026 (USD Million)
      5. 4.4.5. France
        1. 4.4.5.1. France Professional Service Automation (PSA) Software Market, 2016 – 2026 (USD Million)
      6. 4.4.6. U.K.
        1. 4.4.6.1. U.K. Professional Service Automation (PSA) Software Market, 2016 – 2026 (USD Million)
      7. 4.4.7. Italy
        1. 4.4.7.1. Italy Professional Service Automation (PSA) Software Market, 2016 – 2026 (USD Million)
      8. 4.4.8. Spain
        1. 4.4.8.1. Spain Professional Service Automation (PSA) Software Market, 2016 – 2026 (USD Million)
      9. 4.4.9. Rest of Europe
        1. 4.4.9.1. Rest of Europe Professional Service Automation (PSA) Software Market, 2016 – 2026 (USD Million)
    5. 4.5. Asia Pacific
      1. 4.5.1. Asia Pacific Professional Service Automation (PSA) Software Market, 2016 – 2026 (USD Million)
        1. 4.5.1.1. Asia Pacific Professional Service Automation (PSA) Software Market, by Country, 2016 - 2026 (USD Million)
      2. 4.5.2. Asia Pacific Professional Service Automation (PSA) Software Market, by End-Users, 2016 – 2026
        1. 4.5.2.1. Asia Pacific Professional Service Automation (PSA) Software Market, by End-Users, 2016 – 2026 (USD Million)
      3. 4.5.3. Asia Pacific Professional Service Automation (PSA) Software Market, by Deployment Mode, 2016 – 2026
        1. 4.5.3.1. Asia Pacific Professional Service Automation (PSA) Software Market, by Deployment Mode, 2016 – 2026 (USD Million)
      4. 4.5.4. China
        1. 4.5.4.1. China Professional Service Automation (PSA) Software Market, 2016 – 2026 (USD Million)
      5. 4.5.5. Japan
        1. 4.5.5.1. Japan Professional Service Automation (PSA) Software Market, 2016 – 2026 (USD Million)
      6. 4.5.6. India
        1. 4.5.6.1. India Professional Service Automation (PSA) Software Market, 2016 – 2026 (USD Million)
      7. 4.5.7. South Korea
        1. 4.5.7.1. South Korea Professional Service Automation (PSA) Software Market, 2016 – 2026 (USD Million)
      8. 4.5.8. South-East Asia
        1. 4.5.8.1. South-East Asia Professional Service Automation (PSA) Software Market, 2016 – 2026 (USD Million)
      9. 4.5.9. Rest of Asia Pacific
        1. 4.5.9.1. Rest of Asia Pacific Professional Service Automation (PSA) Software Market, 2016 – 2026 (USD Million)
    6. 4.6. Latin America
      1. 4.6.1. Latin America Professional Service Automation (PSA) Software Market, 2016 – 2026 (USD Million)
        1. 4.6.1.1. Latin America Professional Service Automation (PSA) Software Market, by Country, 2016 - 2026 (USD Million)
      2. 4.6.2. Latin America Professional Service Automation (PSA) Software Market, by End-Users, 2016 – 2026
        1. 4.6.2.1. Latin America Professional Service Automation (PSA) Software Market, by End-Users, 2016 – 2026 (USD Million)
      3. 4.6.3. Latin America Professional Service Automation (PSA) Software Market, by Deployment Mode, 2016 – 2026
        1. 4.6.3.1. Latin America Professional Service Automation (PSA) Software Market, by Deployment Mode, 2016 – 2026 (USD Million)
      4. 4.6.4. Brazil
        1. 4.6.4.1. Brazil Professional Service Automation (PSA) Software Market, 2016 – 2026 (USD Million)
      5. 4.6.5. Mexico
        1. 4.6.5.1. Mexico Professional Service Automation (PSA) Software Market, 2016 – 2026 (USD Million)
      6. 4.6.6. Rest of Latin America
        1. 4.6.6.1. Rest of Latin America Professional Service Automation (PSA) Software Market, 2016 – 2026 (USD Million)
    7. 4.7. The Middle-East and Africa
      1. 4.7.1. The Middle-East and Africa Professional Service Automation (PSA) Software Market, 2016 – 2026 (USD Million)
        1. 4.7.1.1. The Middle-East and Africa Professional Service Automation (PSA) Software Market, by Country, 2016 - 2026 (USD Million)
      2. 4.7.2. The Middle-East and Africa Professional Service Automation (PSA) Software Market, by End-Users, 2016 – 2026
        1. 4.7.2.1. The Middle-East and Africa Professional Service Automation (PSA) Software Market, by End-Users, 2016 – 2026 (USD Million)
      3. 4.7.3. The Middle-East and Africa Professional Service Automation (PSA) Software Market, by Deployment Mode, 2016 – 2026
        1. 4.7.3.1. The Middle-East and Africa Professional Service Automation (PSA) Software Market, by Deployment Mode, 2016 – 2026 (USD Million)
      4. 4.7.4. GCC Countries
        1. 4.7.4.1. GCC Countries Professional Service Automation (PSA) Software Market, 2016 – 2026 (USD Million)
      5. 4.7.5. South Africa
        1. 4.7.5.1. South Africa Professional Service Automation (PSA) Software Market, 2016 – 2026 (USD Million)
      6. 4.7.6. Rest of Middle-East Africa
        1. 4.7.6.1. Rest of Middle-East Africa Professional Service Automation (PSA) Software Market, 2016 – 2026 (USD Million)
  5. Chapter 5 Professional Service Automation (PSA) Software Market – Competitive Landscape
    1. 5.1. Competitor Market Share – Revenue
    2. 5.2. Market Concentration Rate Analysis, Top 3 and Top 5 Players
    3. 5.3. Strategic Developments
      1. 5.3.1. Acquisitions and Mergers
      2. 5.3.2. New Products
      3. 5.3.3. Research & Development Activities
  6. Chapter 6 Company Profiles
    1. 6.1. Appirio Inc
      1. 6.1.1. Company Overview
      2. 6.1.2. Product/Service Portfolio
      3. 6.1.3. Appirio Inc Sales, Revenue, and Gross Margin
      4. 6.1.4. Appirio Inc Revenue and Growth Rate
      5. 6.1.5. Appirio Inc Market Share
      6. 6.1.6. Recent Initiatives, Funding/VC Activities, and Technological Innovations
    2. 6.2. ChangePoint
      1. 6.2.1. Company Overview
      2. 6.2.2. Product/Service Portfolio
      3. 6.2.3. ChangePoint Sales, Revenue, and Gross Margin
      4. 6.2.4. ChangePoint Revenue and Growth Rate
      5. 6.2.5. ChangePoint Market Share
      6. 6.2.6. Recent Initiatives, Funding/VC Activities, and Technological Innovations
    3. 6.3. ConnectWise
      1. 6.3.1. Company Overview
      2. 6.3.2. Product/Service Portfolio
      3. 6.3.3. ConnectWise Sales, Revenue, and Gross Margin
      4. 6.3.4. ConnectWise Revenue and Growth Rate
      5. 6.3.5. ConnectWise Market Share
      6. 6.3.6. Recent Initiatives, Funding/VC Activities, and Technological Innovations
      7. 6.4. FinancialForce.com
      8. 6.4.1. Company Overview
      9. 6.4.2. Product/Service Portfolio
        1. 6.4.3. FinancialForce.com Sales, Revenue, and Gross Margin
        2. 6.4.4. FinancialForce.com Revenue and Growth Rate
        3. 6.4.5. FinancialForce.com Market Share
      10. 6.4.6. Recent Initiatives, Funding/VC Activities, and Technological Innovations
    4. 6.5. Microsoft Corporation
      1. 6.5.1. Company Overview
      2. 6.5.2. Product/Service Portfolio
      3. 6.5.3. Microsoft Corporation Sales, Revenue, and Gross Margin
      4. 6.5.4. Microsoft Corporation Revenue and Growth Rate
      5. 6.5.5. Microsoft Corporation Market Share
      6. 6.5.6. Recent Initiatives, Funding/VC Activities, and Technological Innovations
    5. 6.6. NetSuite OpenAir
      1. 6.6.1. Company Overview
      2. 6.6.2. Product/Service Portfolio
      3. 6.6.3. NetSuite OpenAir Sales, Revenue, and Gross Margin
      4. 6.6.4. NetSuite OpenAir Revenue and Growth Rate
      5. 6.6.5. NetSuite OpenAir Market Share
      6. 6.6.6. Recent Initiatives, Funding/VC Activities, and Technological Innovations
    6. 6.7. Projector PSA
      1. 6.7.1. Company Overview
      2. 6.7.2. Product/Service Portfolio
      3. 6.7.3. Projector PSA Sales, Revenue, and Gross Margin
      4. 6.7.4. Projector PSA Revenue and Growth Rate
      5. 6.7.5. Projector PSA Market Share
      6. 6.7.6. Recent Initiatives, Funding/VC Activities, and Technological Innovations
    7. 6.8. Tenroxare
      1. 6.8.1. Company Overview
      2. 6.8.2. Product/Service Portfolio
      3. 6.8.3. Tenroxare Sales, Revenue, and Gross Margin
      4. 6.8.4. Tenroxare Revenue and Growth Rate
      5. 6.8.5. Tenroxare Market Share
      6. 6.8.6. Recent Initiatives, Funding/VC Activities, and Technological Innovations
    8. 6.9. Autotask Corporation
      1. 6.9.1. Company Overview
      2. 6.9.2. Product/Service Portfolio
      3. 6.9.3. Autotask Corporation Sales, Revenue, and Gross Margin
      4. 6.9.4. Autotask Corporation Revenue and Growth Rate
      5. 6.9.5. Autotask Corporation Market Share
      6. 6.9.6. Recent Initiatives, Funding/VC Activities, and Technological Innovations
    9. 6.10. SAP
      1. 6.10.1. Company Overview
      2. 6.10.2. Product/Service Portfolio
      3. 6.10.3. SAP Sales, Revenue, and Gross Margin
      4. 6.10.4. SAP Revenue and Growth Rate
      5. 6.10.5. SAP Market Share
      6. 6.10.6. Recent Initiatives, Funding/VC Activities, and Technological Innovations
    10. 6.11. Upland Software
      1. 6.11.1. Company Overview
      2. 6.11.2. Product/Service Portfolio
      3. 6.11.3. Upland Software Sales, Revenue, and Gross Margin
      4. 6.11.4. Upland Software Revenue and Growth Rate
      5. 6.11.5. Upland Software Market Share
      6. 6.11.6. Recent Initiatives, Funding/VC Activities, and Technological Innovations
    11. 6.12. Project Open Business Solution LLC
      1. 6.12.1. Company Overview
      2. 6.12.2. Product/Service Portfolio
      3. 6.12.3. Project Open Business Solution LLC Sales, Revenue, and Gross Margin
      4. 6.12.4. Project Open Business Solution LLC Revenue and Growth Rate
      5. 6.12.5. Project Open Business Solution LLC Market Share
      6. 6.12.6. Recent Initiatives, Funding/VC Activities, and Technological Innovations
    12. 6.13. Kaseya Limited
      1. 6.13.1. Company Overview
      2. 6.13.2. Product/Service Portfolio
      3. 6.13.3. Kaseya Limited Sales, Revenue, and Gross Margin
      4. 6.13.4. Kaseya Limited Revenue and Growth Rate
      5. 6.13.5. Kaseya Limited Market Share
      6. 6.13.6. Recent Initiatives, Funding/VC Activities, and Technological Innovations
    13. 6.14. Oracle
      1. 6.14.1. Company Overview
      2. 6.14.2. Product/Service Portfolio
      3. 6.14.3. Oracle Sales, Revenue, and Gross Margin
      4. 6.14.4. Oracle Revenue and Growth Rate
      5. 6.14.5. Oracle Market Share
      6. 6.14.6. Recent Initiatives, Funding/VC Activities, and Technological Innovations
  7. Chapter 7 Professional Service Automation (PSA) Software — Industry Analysis
    1. 7.1. Introduction and Taxonomy
    2. 7.2. Professional Service Automation (PSA) Software Market – Key Trends
      1. 7.2.1. Market Drivers
      2. 7.2.2. Market Restraints
      3. 7.2.3. Market Opportunities
    3. 7.3. Value Chain Analysis
    4. 7.4. Key Mandates and Regulations
    5. 7.5. Technology Roadmap and Timeline
    6. 7.6. Professional Service Automation (PSA) Software Market – Attractiveness Analysis
      1. 7.6.1. By End-Users
      2. 7.6.2. By Deployment Mode
      3. 7.6.3. By Region
  8. Chapter 8 Industrial Chain, Sourcing Strategy, and Downstream Buyers
    1. 8.1. Professional Service Automation (PSA) Software Industrial Chain Analysis
    2. 8.2. Downstream Buyers
    3. 8.3. Distributors/Traders List
  9. Chapter 9 Marketing Strategy Analysis
    1. 9.1. Marketing Channel
    2. 9.2. Direct Marketing
    3. 9.3. Indirect Marketing
    4. 9.4. Marketing Channel Development Trends
    5. 9.5. Economic/Political Environmental Change
  10. Chapter 10 Report Conclusion & Key Insights
    1. 10.1. Key Insights from Primary Interviews & Surveys Respondents
    2. 10.2. Key Takeaways from Analysts, Consultants, and Industry Leaders
  11. Chapter 11 Research Approach & Methodology
    1. 11.1. Report Description
    2. 11.2. Research Scope
    3. 11.3. Research Methodology
      1. 11.3.1. Secondary Research
      2. 11.3.2. Primary Research
      3. 11.3.3. Statistical Models
        1. 11.3.3.1. Company Share Analysis Model
        2. 11.3.3.2. Revenue Based Modeling
      4. 11.3.4. Research Limitations

      List of Figures

      Fig.1	Product Picture of Professional Service Automation (PSA) Software
      Fig.2	Global Professional Service Automation (PSA) Software Market, 2016 – 2026 (USD Million)
      Fig.3	Global Professional Service Automation (PSA) Software Market Absolute Revenue Opportunity, 2016 – 2026 (USD Million)
      Fig.4	Global Professional Service Automation (PSA) Software Market Incremental Revenue Opportunity, 2020 – 2026 (USD Million)
      Fig.5	Global Professional Service Automation (PSA) Software Market Share, by End-Users, 2019 & 2026 (USD Million)
      Fig.6	Global Consulting Firms  Professional Service Automation (PSA) Software Market, 2016 – 2026 (USD Million)
      Fig.7	Global Technology Companies Professional Service Automation (PSA) Software Market, 2016 – 2026 (USD Million)
      Fig.8	Global Marketing & Communications Firms  Professional Service Automation (PSA) Software Market, 2016 – 2026 (USD Million)
      Fig.9	Global Others Professional Service Automation (PSA) Software Market, 2016 – 2026 (USD Million)
      Fig.10	Global Professional Service Automation (PSA) Software Market Share, by Deployment Mode, 2019 & 2026 (USD Million)
      Fig.11	Global Cloud Based  Professional Service Automation (PSA) Software Market, 2016 – 2026 (USD Million)
      Fig.12	Global On-Premise Professional Service Automation (PSA) Software Market, 2016 – 2026 (USD Million)
      Fig.13	Global Professional Service Automation (PSA) Software Market Share, by Region, 2019 & 2026 (USD Million)
      Fig.14	North America Professional Service Automation (PSA) Software Market, 2016 – 2026 (USD Million)
      Fig.15	U.S. Professional Service Automation (PSA) Software Market, 2016 – 2026 (USD Million)
      Fig.16	Canada Professional Service Automation (PSA) Software Market, 2016 – 2026 (USD Million)
      Fig.17	Europe Professional Service Automation (PSA) Software Market, 2016 – 2026 (USD Million)
      Fig.18	Germany Professional Service Automation (PSA) Software Market, 2016 – 2026 (USD Million)
      Fig.19	France Professional Service Automation (PSA) Software Market, 2016 – 2026 (USD Million)
      Fig.20	U.K. Professional Service Automation (PSA) Software Market, 2016 – 2026 (USD Million)
      Fig.21	Italy Professional Service Automation (PSA) Software Market, 2016 – 2026 (USD Million)
      Fig.22	Spain Professional Service Automation (PSA) Software Market, 2016 – 2026 (USD Million)
      Fig.23	Rest of Europe Professional Service Automation (PSA) Software Market, 2016 – 2026 (USD Million)
      Fig.24	Asia Pacific Professional Service Automation (PSA) Software Market, 2016 – 2026 (USD Million)
      Fig.25	China Professional Service Automation (PSA) Software Market, 2016 – 2026 (USD Million)
      Fig.26	Japan Professional Service Automation (PSA) Software Market, 2016 – 2026 (USD Million)
      Fig.27	India Professional Service Automation (PSA) Software Market, 2016 – 2026 (USD Million)
      Fig.28	South  Korea Professional Service Automation (PSA) Software Market, 2016 – 2026 (USD Million)
      Fig.29	South-East Asia Professional Service Automation (PSA) Software Market, 2016 – 2026 (USD Million)
      Fig.30	Rest of Asia Pacific Professional Service Automation (PSA) Software Market, 2016 – 2026 (USD Million)
      Fig.31	Latin America Professional Service Automation (PSA) Software Market, 2016 – 2026 (USD Million)
      Fig.32	Brazil Professional Service Automation (PSA) Software Market, 2016 – 2026 (USD Million)
      Fig.33	Mexico Professional Service Automation (PSA) Software Market, 2016 – 2026 (USD Million)
      Fig.34	Rest of Latin America Professional Service Automation (PSA) Software Market, 2016 – 2026 (USD Million)
      Fig.35	The Middle-East and Africa Professional Service Automation (PSA) Software Market, 2016 – 2026 (USD Million)
      Fig.36	GCC Countries Professional Service Automation (PSA) Software Market, 2016 – 2026 (USD Million)
      Fig.37	South Africa Professional Service Automation (PSA) Software Market, 2016 – 2026 (USD Million)
      Fig.38	Rest of Middle-East Africa Professional Service Automation (PSA) Software Market, 2016 – 2026 (USD Million)
      Fig.39	Competitor Market Share – Revenue
      Fig.40	Appirio Inc Revenue and Growth Rate
      Fig.41	Appirio Inc Market Share
      Fig.42	ChangePoint Revenue and Growth Rate
      Fig.43	ChangePoint Market Share
      Fig.44	ConnectWise Revenue and Growth Rate
      Fig.45	ConnectWise Market Share
      Fig.46	FinancialForce.com Revenue and Growth Rate
      Fig.47	FinancialForce.com Market Share
      Fig.48	Microsoft Corporation Revenue and Growth Rate
      Fig.49	Microsoft Corporation Market Share
      Fig.50	NetSuite OpenAir Revenue and Growth Rate
      Fig.51	NetSuite OpenAir Market Share
      Fig.52	Projector PSA Revenue and Growth Rate
      Fig.53	Projector PSA Market Share
      Fig.54	Tenroxare Revenue and Growth Rate
      Fig.55	Tenroxare Market Share
      Fig.56	Autotask Corporation Revenue and Growth Rate
      Fig.57	Autotask Corporation Market Share
      Fig.58	SAP Revenue and Growth Rate
      Fig.59	SAP Market Share
      Fig.60	Upland Software Revenue and Growth Rate
      Fig.61	Upland Software Market Share
      Fig.62	Project Open Business Solution LLC Revenue and Growth Rate
      Fig.63	Project Open Business Solution LLC Market Share
      Fig.64	Kaseya Limited Revenue and Growth Rate
      Fig.65	Kaseya Limited Market Share
      Fig.66	Oracle Revenue and Growth Rate
      Fig.67	Oracle Market Share
      Fig.68	Market Dynamics
      Fig.69	Global Professional Service Automation (PSA) Software – Value Chain Analysis
      Fig.70	Key Mandates and Regulations
      Fig.71	Technology Roadmap and Timeline
      Fig.72	Market Attractiveness Analysis – By End-Users
      Fig.73	Market Attractiveness Analysis – By Deployment Mode
      Fig.74	Market Attractiveness Analysis – By Region
      Fig.75	Professional Service Automation (PSA) Software Industrial Chain Analysis
      Fig.76	Market Channels
      Fig.77	Marketing Channel Development Trend
      Fig.78	Growth in World Gross Product, 2008-2018
      

      List of Tables

      Table 1	Global Professional Service Automation (PSA) Software Market, 2019 & 2026 (USD Million)
      Table 2	Global Professional Service Automation (PSA) Software Market, by End-Users, 2016 – 2026 (USD Million)
      Table 3	Global Professional Service Automation (PSA) Software Market, by Deployment Mode, 2016 – 2026 (USD Million)
      Table 4	Global Professional Service Automation (PSA) Software Market, by Region, 2016 – 2026 (USD Million)
      Table 5	North America Professional Service Automation (PSA) Software Market, by Country, 2016 – 2026 (USD Million)
      Table 6	North America Professional Service Automation (PSA) Software Market, by End-Users, 2016 – 2026 (USD Million)
      Table 7	North America Professional Service Automation (PSA) Software Market, by Deployment Mode, 2016 – 2026 (USD Million)
      Table 8	Europe Professional Service Automation (PSA) Software Market, by Country, 2016 – 2026 (USD Million)
      Table 9	Europe Professional Service Automation (PSA) Software Market, by End-Users, 2016 – 2026 (USD Million)
      Table 10 Europe Professional Service Automation (PSA) Software Market, by Deployment Mode, 2016 – 2026 (USD Million)
      Table 11 Asia Pacific Professional Service Automation (PSA) Software Market, by Country, 2016 – 2026 (USD Million)
      Table 12 Asia Pacific Professional Service Automation (PSA) Software Market, by End-Users, 2016 – 2026 (USD Million)
      Table 13 Asia Pacific Professional Service Automation (PSA) Software Market, by Deployment Mode, 2016 – 2026 (USD Million)
      Table 14 Latin America Professional Service Automation (PSA) Software Market, by Country, 2016 – 2026 (USD Million)
      Table 15 Latin America Professional Service Automation (PSA) Software Market, by End-Users, 2016 – 2026 (USD Million)
      Table 16 Latin America Professional Service Automation (PSA) Software Market, by Deployment Mode, 2016 – 2026 (USD Million)
      Table 17 The Middle-East and Africa Professional Service Automation (PSA) Software Market, by Country, 2016 – 2026 (USD Million)
      Table 18 The Middle-East and Africa Professional Service Automation (PSA) Software Market, by End-Users, 2016 – 2026 (USD Million)
      Table 19 The Middle-East and Africa Professional Service Automation (PSA) Software Market, by Deployment Mode, 2016 – 2026 (USD Million)
      Table 20 Global Professional Service Automation (PSA) Software Market - Company Revenue Analysis, 2016 – 2019 (USD Million)
      Table 21 Global Professional Service Automation (PSA) Software Market - Company Revenue Share Analysis, 2016 – 2019 (%)
      Table 22 Acquisitions and Mergers
      Table 23 Market Drivers – Impact Analysis
      Table 24 Market Restraints
      Table 25 Market Opportunities
      Table 26 Major Buyers of Professional Service Automation (PSA) Software
      Table 27 Distributors/Traders of Professional Service Automation (PSA) Software by Region
      

Industry Major Market Players

  • Appirio Inc.
  • ChangePoint
  • ConnectWise
  • FinancialForce.com
  • Microsoft Corporation
  • NetSuite OpenAir
  • Projector PSA
  • Tenroxare
  • Autotask Corporation
  • SAP
  • Upland Software
  • Project Open Business Solution LLC
  • Kaseya Limited
  • Oracle