Search Market Research Report

Discover Our Latest Reports
Discover Our Featured Reports
Discover Top Selling Reports

Premium Bottled Water Market Size, Share Global Analysis Report, 2020–2026

report img

Premium Bottled Water Market By Type (Flavored and Unflavored) and By Distribution Channel (Supermarkets, Convenience Stores, Departmental Stores, and Others): Global Industry Outlook, Market Size, Business Intelligence, Consumer Preferences, Statistical Surveys, Comprehensive Analysis, Historical Developments, Current Trends, and Forecast 2020–2026

Industry Insights

The premium bottled water market report analyzes and notifies the industry statistics at the global as well as regional and country levels in order to acquire a thorough perspective of the entire premium bottled water market. The historical and past insights are provided for FY 2016 to FY 2019 whereas projected trends are delivered for FY 2020 to FY 2026. The quantitative and numerical data is represented in terms of value (USD Million) from FY 2016 – 2026.

This specialized and expertise-oriented industry research report scrutinizes the technical and commercial business outlook of the premium bottled water industry. The report analyzes and declares the historical and current trends analysis of the premium bottled water industry and subsequently recommends the projected trends anticipated to be observed in the premium bottled water market during the upcoming years.

Premium Bottled Water Market Size

To know more about this report | Request Free Sample Copy


logoKey Insights from Primary Research

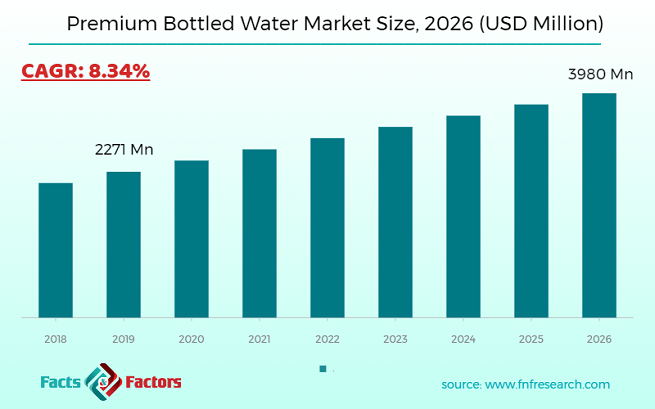
  • As per our analysis, premium bottled water is set to grow annually at a rate of around 8.34%
  • It was valued through primary research that the premium bottled water market was valued at around USD 2,271 Million in 2019
  • Europe is currently holding the largest share among all the regions and is expected to continue the trend in the upcoming period.
  • The market may witness a rise in the future for premium bottled water due to already being well-established in the key markets of France, Germany, Italy, the UK, and Spain.

logoKey Recommendations from Analysts

  • As per our analysis, it was anticipated that in upcoming years demand for functional water to drive the sales of premium bottled water
  • The market value for the year 2026 was estimated at USD 3,980 Million
  • North America region is likely to witness the highest growth rate during the estimated period
  • As per our analysts, it is estimated that the value per liter for premium water is more than 2.5 to 7 times in comparison to normal bottled water.

The quantitative data is further underlined and reinforced by comprehensive qualitative data which comprises various across-the-board market dynamics. The rationales which directly or indirectly impact the premium bottled water industry are exemplified through parameters such as growth drivers, restraints, challenges, and opportunities among other impacting factors.

Throughout our research report, we have encompassed all the proven models and tools of industry analysis and extensively illustrated all the key business strategies and business models adopted in the premium bottled water industry. The report provides an all-inclusive and detailed competitive landscape prevalent in the premium bottled water market.

The report utilizes established industry analysis tools and models such as Porter’s Five Forces framework to analyze and recognize critical business strategies adopted by various stakeholders involved in the entire value chain of the premium bottled water industry. The premium bottled water market report additionally employs SWOT analysis and PESTLE analysis models for further in-depth analysis.

The report study further includes an in-depth analysis of industry players' market shares and provides an overview of leading players' market position in the premium bottled water sector. Key strategic developments in the premium bottled water market competitive landscape such as acquisitions & mergers, inaugurations of different products and services, partnerships & joint ventures, MoU agreements, VC & funding activities, R&D activities, and geographic expansion among other noteworthy activities by key players of the premium bottled water market are appropriately highlighted in the report.

An increasing number of small local actors is a major trend in the global bottled water industry. Thanks to their relatively low entry costs and restricted reach, small players still have significant gains in many regions. Therefore, the lack of proven clean standards leads customers to new products in emerging markets. Moreover, low production costs for unsettled players in emerging markets such as the Asia Pacific are expected to boost growth. In the near future, there are several mergers and acquisitions on the global bottled water market.

In addition, a significant increase in the demand and use of quality bottled water is evident from factors such as economic development in developing countries, increased disposable income and a change in the way people live. The market is expected to have a CAGR of 8.4 percent during the forecast period. By contrast to carbonated beverages, health benefits and added nutrients are estimated to be higher. During the forecast period, bottled water demand will likely be boosted by factors such as the rise in per capita expenditure and rapid urbanization.

The premium bottled water market research report delivers an acute valuation and taxonomy of the premium bottled water industry by practically splitting the market on the basis of different types, distribution channels, and regions. Through the analysis of the historical and projected trends, all the segments and sub-segments were evaluated through the bottom-up approach, and different market sizes have been projected for FY 2020 to FY 2026. The regional segmentation of the premium bottled water industry includes the complete classification of all the major continents including North America, Latin America, Europe, Asia Pacific, and the Middle East & Africa. Further, country-wise data for the premium bottled water industry is provided for the leading economies of the world.

The premium bottled water market is segmented based on type and distribution channels. On the basis of type segmentation, the market is classified into flavored and unflavored. In terms of distribution channel segmentation, the market is bifurcated into supermarkets, convenience stores, departmental stores, and others.

logoReport Scope

Report Attribute

Details

Market Size in 2019

USD 2,271 Million

Projected Market Size in 2026

USD 3,980 Million

CAGR Growth Rate

8.34% CAGR

Base Year

2019

Forecast Years

2020-2026

Key Market Players

Danone, Pepsico, Nestle, Hangzhou Wahaha Group Co. Ltd., Nestlé Waters, The Coca Cola Company, Natural Waters of Viti Ltd., PepsiCo Inc., Mountain Valley Spring Company, and Dasani and Icelandic Glacial Inc. and others.

Key Segment

By Type, By Distribution Channel, By Region

Major Regions Covered

North America, Europe, Asia Pacific, Latin America, and the Middle East & Africa

Purchase Options

Request customized purchase options to meet your research needs. Explore purchase options

The taxonomy of the premium bottled water industry by its scope and segmentation is as follows:

logoSome of the major players operating in the premium bottled water market include

  •  Danone
  •  Pepsico
  •  Nestle
  •  Hangzhou Wahaha Group Co. Ltd.
  •  Nestlé Waters
  •  The Coca Cola Company
  •  Natural Waters of Viti Ltd.
  •  PepsiCo Inc.
  •  Mountain Valley Spring Company
  •  Dasani and Icelandic Glacial Inc.

logo By Type Segmentation Analysis (Customizable)

  • Flavoured
  • Unflavoured

logo By Distribution Channel Segmentation Analysis (Customizable)

  • Supermarkets
  • Convenience Stores
  • Departmental Stores
  • Others

logo Regional Segmentation Analysis (Customizable)

  • North America
    • The U.S.
    • Canada
  • Europe
    • Germany
    • The UK
    • France
    • Spain
    • Italy
    • Rest of Europe
  • Asia Pacific
    • China
    • Japan
    • India
    • South Korea
    • Southeast Asia
    • Rest of Asia Pacific
  • Latin America
    • Brazil
    • Mexico
    • Rest of Latin America
  • Middle East & Africa
    • GCC
    • South Africa
    • Rest of the Middle East & Africa

Table of Content

  1. CHAPTER 1. Executive Summary
  2. CHAPTER 2. Premium Bottled Water market – Type Analysis
    1. 2.1. Global Premium Bottled Water Market – Type Overview
    2. 2.2. Global Premium Bottled Water Market Share, by Type, 2019 & 2026 (USD Million)
    3. 2.3. Flavored
      1. 2.3.1. Global Flavored Premium Bottled Water Market, 2016-2019 (USD Million)
    4. 2.4. Unflavored
      1. 2.4.1. Global Unflavored Premium Bottled Water Market, 2016-2019 (USD Million)
  3. CHAPTER 3. Premium Bottled Water market – Distribution Channel Analysis
    1. 3.1. Global Premium Bottled Water Market – Distribution Channel Overview
    2. 3.2. Global Premium Bottled Water Market Share, by Distribution Channel, 2019 & 2026 (USD Million)
    3. 3.3. Supermarkets
      1. 3.3.1. Global Supermarkets Premium Bottled Water Market, 2016-2019 (USD Million)
    4. 3.4. Convenience Stores
      1. 3.4.1. Global Convenience Stores Premium Bottled Water Market, 2016-2019 (USD Million)
    5. 3.5. Departmental Stores
      1. 3.5.1. Global Departmental Stores Premium Bottled Water Market, 2016-2019 (USD Million)
    6. 3.6. Others
      1. 3.6.1. Global Others Premium Bottled Water Market, 2016-2019 (USD Million)
  4. CHAPTER 4. Premium Bottled Water market – Regional Analysis
    1. 4.1. Global Premium Bottled Water Market Regional Overview
    2. 4.2. Global Premium Bottled Water Market Share, by Region, 2019 & 2026 (Value)
    3. 4.3. North America
      1. 4.3.1. North America Premium Bottled Water Market size and forecast, 2016-2019
      2. 4.3.2. North America Premium Bottled Water Market, by Country, 2019 & 2026 (USD Million)
      3. 4.3.3. North America Premium Bottled Water Market, by Type, 2016-2019
        1. 4.3.3.1. North America Premium Bottled Water Market, by Type, 2016-2019 (USD Million)
      4. 4.3.4. North America Premium Bottled Water Market, by Distribution Channel, 2016-2019
        1. 4.3.4.1. North America Premium Bottled Water Market, by Distribution Channel, 2016-2019 (USD Million)
      5. 4.3.5. U.S.
        1. 4.3.5.1. U.S. Market size and forecast, 2016-2019 (USD Million)
      6. 4.3.6. Canada
        1. 4.3.6.1. Canada Market size and forecast, 2016-2019 (USD Million)
    4. 4.4. Europe
      1. 4.4.1. Europe Premium Bottled Water Market size and forecast, 2016-2019
      2. 4.4.2. Europe Premium Bottled Water Market, by Country, 2019 & 2026 (USD Million)
      3. 4.4.3. Europe Premium Bottled Water Market, by Type, 2016-2019
        1. 4.4.3.1. Europe Premium Bottled Water Market, by Type, 2016-2019 (USD Million)
      4. 4.4.4. Europe Premium Bottled Water Market, by Distribution Channel, 2016-2019
        1. 4.4.4.1. Europe Premium Bottled Water Market, by Distribution Channel, 2016-2019 (USD Million)
      5. 4.4.5. Germany
        1. 4.4.5.1. Germany Market size and forecast, 2016-2019 (USD Million)
      6. 4.4.6. France
        1. 4.4.6.1. France Market size and forecast, 2016-2019 (USD Million)
      7. 4.4.7. U.K.
        1. 4.4.7.1. U.K. Market size and forecast, 2016-2019 (USD Million)
      8. 4.4.8. Italy
        1. 4.4.8.1. Italy Market size and forecast, 2016-2019 (USD Million)
      9. 4.4.9. Spain
        1. 4.4.9.1. Spain Market size and forecast, 2016-2019 (USD Million)
      10. 4.4.10. Rest of Europe
        1. 4.4.10.1. Rest of Europe Market size and forecast, 2016-2019 (USD Million)
    5. 4.5. Asia Pacific
      1. 4.5.1. Asia Pacific Premium Bottled Water Market size and forecast, 2016-2019
      2. 4.5.2. Asia Pacific Premium Bottled Water Market, by Country, 2019 & 2026 (USD Million)
      3. 4.5.3. Asia Pacific Premium Bottled Water Market, by Type, 2016-2019
        1. 4.5.3.1. Asia Pacific Premium Bottled Water Market, by Type, 2016-2019 (USD Million)
      4. 4.5.4. Asia Pacific Premium Bottled Water Market, by Distribution Channel, 2016-2019
        1. 4.5.4.1. Asia Pacific Premium Bottled Water Market, by Distribution Channel, 2016-2019 (USD Million)
      5. 4.5.5. China
        1. 4.5.5.1. China Market size and forecast, 2016-2019 (USD Million)
      6. 4.5.6. Japan
        1. 4.5.6.1. Japan Market size and forecast, 2016-2019 (USD Million)
      7. 4.5.7. India
        1. 4.5.7.1. India Market size and forecast, 2016-2019 (USD Million)
      8. 4.5.8. South Korea
        1. 4.5.8.1. South Korea Market size and forecast, 2016-2019 (USD Million)
      9. 4.5.9. South-East Asia
        1. 4.5.9.1. South-East Asia Market size and forecast, 2016-2019 (USD Million)
      10. 4.5.10. Rest of Asia Pacific
        1. 4.5.10.1. Rest of Asia Pacific Market size and forecast, 2016-2019 (USD Million)
    6. 4.6. Latin America
      1. 4.6.1. Latin America Premium Bottled Water Market size and forecast, 2016-2019
      2. 4.6.2. Latin America Premium Bottled Water Market, by Country, 2019 & 2026 (USD Million)
      3. 4.6.3. Latin America Premium Bottled Water Market, by Type, 2016-2019
        1. 4.6.3.1. Latin America Premium Bottled Water Market, by Type, 2016-2019 (USD Million)
      4. 4.6.4. Latin America Premium Bottled Water Market, by Distribution Channel, 2016-2019
        1. 4.6.4.1. Latin America Premium Bottled Water Market, by Distribution Channel, 2016-2019 (USD Million)
      5. 4.6.5. Brazil
        1. 4.6.5.1. Brazil Market size and forecast, 2016-2019 (USD Million)
      6. 4.6.6. Mexico
        1. 4.6.6.1. Mexico Market size and forecast, 2016-2019 (USD Million)
      7. 4.6.7. Rest of Latin America
        1. 4.6.7.1. Rest of Latin America Market size and forecast, 2016-2019 (USD Million)
    7. 4.7. The Middle-East and Africa
      1. 4.7.1. The Middle-East and Africa Premium Bottled Water Market size and forecast, 2016-2019
      2. 4.7.2. The Middle-East and Africa Premium Bottled Water Market, by Country, 2019 & 2026 (USD Million)
      3. 4.7.3. The Middle-East and Africa Premium Bottled Water Market, by Type, 2016-2019
        1. 4.7.3.1. The Middle-East and Africa Premium Bottled Water Market, by Type, 2016-2019 (USD Million)
      4. 4.7.4. The Middle-East and Africa Premium Bottled Water Market, by Distribution Channel, 2016-2019
        1. 4.7.4.1. The Middle-East and Africa Premium Bottled Water Market, by Distribution Channel, 2016-2019 (USD Million)
      5. 4.7.5. GCC Countries
        1. 4.7.5.1. GCC Countries Market size and forecast, 2016-2019 (USD Million)
      6. 4.7.6. South Africa
        1. 4.7.6.1. South Africa Market size and forecast, 2016-2019 (USD Million)
      7. 4.7.7. Rest of Middle-East Africa
        1. 4.7.7.1. Rest of Middle-East Africa Market size and forecast, 2016-2019 (USD Million)
  5. CHAPTER 5. Premium Bottled Water market – Competitive Landscape
    1. 5.1. Competitor Market Share – Revenue
    2. 5.2. Market Concentration Rate Analysis, Top 3 and Top 5 Players
    3. 5.3. Strategic Development
      1. 5.3.1. Acquisitions and Mergers
      2. 5.3.2. New Products
      3. 5.3.3. Research & Development Activities
  6. CHAPTER 6. Company Profiles
    1. 6.1. Danone
      1. 6.1.1. Company Overview
      2. 6.1.2. Danone Revenue and Gross Margin
      3. 6.1.3. Product portfolio
      4. 6.1.4. Recent initiatives
    2. 6.2. Pepsico
      1. 6.2.1. Company Overview
      2. 6.2.2. Pepsico Revenue and Gross Margin
      3. 6.2.3. Product portfolio
      4. 6.2.4. Recent initiatives
    3. 6.3. Nestle
      1. 6.3.1. Company Overview
      2. 6.3.2. Nestle Revenue and Gross Margin
      3. 6.3.3. Product portfolio
      4. 6.3.4. Recent initiatives
    4. 6.4. Hangzhou Wahaha Group Co. Ltd.
      1. 6.4.1. Company Overview
      2. 6.4.2. Hangzhou Wahaha Group Co. Ltd. Revenue and Gross Margin
      3. 6.4.3. Product portfolio
      4. 6.4.4. Recent initiatives
    5. 6.5. Nestlé Waters
      1. 6.5.1. Company Overview
      2. 6.5.2. Nestlé Waters Revenue and Gross Margin
      3. 6.5.3. Product portfolio
      4. 6.5.4. Recent initiatives
    6. 6.6. The Coca Cola Company
      1. 6.6.1. Company Overview
      2. 6.6.2. The Coca Cola Company Revenue and Gross Margin
      3. 6.6.3. Product portfolio
      4. 6.6.4. Recent initiatives
    7. 6.7. Natural Waters of Viti Ltd.
      1. 6.7.1. Company Overview
      2. 6.7.2. Natural Waters of Viti Ltd. Revenue and Gross Margin
      3. 6.7.3. Product portfolio
      4. 6.7.4. Recent initiatives
    8. 6.8. PepsiCo Inc.
      1. 6.8.1. Company Overview
      2. 6.8.2. PepsiCo Inc. Revenue and Gross Margin
      3. 6.8.3. Product portfolio
      4. 6.8.4. Recent initiatives
    9. 6.9. Mountain Valley Spring Company
      1. 6.9.1. Company Overview
      2. 6.9.2. Mountain Valley Spring Company Revenue and Gross Margin
      3. 6.9.3. Product portfolio
      4. 6.9.4. Recent initiatives
    10. 6.10. Dasani and Icelandic Glacial Inc.
      1. 6.10.1. Company Overview
      2. 6.10.2. Dasani and Icelandic Glacial Inc. Revenue and Gross Margin
      3. 6.10.3. Product portfolio
      4. 6.10.4. Recent initiatives
  7. CHAPTER 7. Premium Bottled Water — Industry Analysis
    1. 7.1. Premium Bottled Water Market – Key Trends
      1. 7.1.1. Market Drivers
      2. 7.1.2. Market Restraints
      3. 7.1.3. Market Opportunities
    2. 7.2. Value Chain Analysis
    3. 7.3. Technology Roadmap and Timeline
    4. 7.4. Premium Bottled Water Market – Attractiveness Analysis
      1. 7.4.1. By Type
      2. 7.4.2. By Distribution Channel
      3. 7.4.3. By Region
  8. CHAPTER 8. Marketing Strategy Analysis, Distributors
    1. 8.1. Marketing Channel
    2. 8.2. Direct Marketing
    3. 8.3. Indirect Marketing
    4. 8.4. Marketing Channel Development Trend
    5. 8.5. Economic/Political Environmental Change
  9. CHAPTER 9. Report Conclusion
  10. CHAPTER 10. Research Approach & Methodology
    1. 10.1. Report Description
    2. 10.2. Research Scope
    3. 10.3. Research Methodology
      1. 10.3.1. Secondary Research
      2. 10.3.2. Primary Research
      3. 10.3.3. Models
        1. 10.3.3.1. Company Share Analysis Model
        2. 10.3.3.2. Revenue Based Modeling
        3. 10.3.3.3. Research Limitations

        List of Figures

        FIG. 1 Global Premium Bottled Water Market, 2016-2019 (USD Million)
        FIG. 2 Global Premium Bottled Water Market Share, by Type, 2019 & 2026 (USD Million)
        FIG. 3 Global Flavored Premium Bottled Water Market, 2016-2019 (USD Million)
        FIG. 4 Global Unflavored Premium Bottled Water Market, 2016-2019 (USD Million)
        FIG. 5 Global Premium Bottled Water Market Share, by Distribution Channel, 2019 & 2026 (USD Million)
        FIG. 6 Global Supermarkets Premium Bottled Water Market, 2016-2019 (USD Million)
        FIG. 7 Global Convenience Stores Premium Bottled Water Market, 2016-2019 (USD Million)
        FIG. 8 Global Departmental Stores Premium Bottled Water Market, 2016-2019 (USD Million)
        FIG. 9 Global Others Premium Bottled Water Market, 2016-2019 (USD Million)
        FIG. 10 Global Premium Bottled Water Market Share, by Region, 2019 & 2026
        FIG. 11 North America Premium Bottled Water Market, 2016-2019
        FIG. 12 U.S. Premium Bottled Water Market, 2016-2019
        FIG. 13 Canada Premium Bottled Water Market, 2016-2019
        FIG. 14 Europe Premium Bottled Water Market, 2016-2019
        FIG. 15 Germany Premium Bottled Water Market, 2016-2019
        FIG. 16 France Premium Bottled Water Market, 2016-2019
        FIG. 17 U.K. Premium Bottled Water Market, 2016-2019
        FIG. 18 Italy Premium Bottled Water Market, 2016-2019
        FIG. 19 Spain Premium Bottled Water Market, 2016-2019
        FIG. 20 Rest of Europe Premium Bottled Water Market, 2016-2019
        FIG. 21 Asia Pacific Premium Bottled Water Market, 2016-2019
        FIG. 22 China Premium Bottled Water Market, 2016-2019
        FIG. 23 Japan Premium Bottled Water Market, 2016-2019
        FIG. 24 India Premium Bottled Water Market, 2016-2019
        FIG. 25 South  Korea Premium Bottled Water Market, 2016-2019
        FIG. 26 South-East Asia Premium Bottled Water Market, 2016-2019
        FIG. 27 Rest of Asia Pacific Premium Bottled Water Market, 2016-2019
        FIG. 28 Latin America Premium Bottled Water Market, 2016-2019
        FIG. 29 Brazil Premium Bottled Water Market, 2016-2019
        FIG. 30 Mexico Premium Bottled Water Market, 2016-2019
        FIG. 31 Rest of Latin America Premium Bottled Water Market, 2016-2019
        FIG. 32 The Middle-East and Africa Premium Bottled Water Market, 2016-2019
        FIG. 33 GCC Countries Premium Bottled Water Market, 2016-2019
        FIG. 34 South Africa Premium Bottled Water Market, 2016-2019
        FIG. 35 Rest of Middle-East Africa Premium Bottled Water Market, 2016-2019
        FIG. 36 Competitor Market Share – Revenue
        FIG. 37 Danone Revenue and Growth Rate
        FIG. 38 Danone Market Share
        FIG. 39 Pepsico Revenue and Growth Rate
        FIG. 40 Pepsico Market Share
        FIG. 41 Nestle Revenue and Growth Rate
        FIG. 42 Nestle Market Share
        FIG. 43 Hangzhou Wahaha Group Co. Ltd. Revenue and Growth Rate
        FIG. 44 Hangzhou Wahaha Group Co. Ltd. Market Share
        FIG. 45 Nestlé Waters Revenue and Growth Rate
        FIG. 46 Nestlé Waters Market Share
        FIG. 47 The Coca Cola Company Revenue and Growth Rate
        FIG. 48 The Coca Cola Company Market Share
        FIG. 49 Natural Waters of Viti Ltd. Revenue and Growth Rate
        FIG. 50 Natural Waters of Viti Ltd. Market Share
        FIG. 51 PepsiCo Inc. Revenue and Growth Rate
        FIG. 52 PepsiCo Inc. Market Share
        FIG. 53 Mountain Valley Spring Company Revenue and Growth Rate
        FIG. 54 Mountain Valley Spring Company Market Share
        FIG. 55 Dasani and Icelandic Glacial Inc. Revenue and Growth Rate
        FIG. 56 Dasani and Icelandic Glacial Inc. Market Share
        FIG. 57 Market Dynamics
        FIG. 58 Global Premium Bottled Water – Value Chain Analysis
        FIG. 59 Technology Roadmap and Timeline
        FIG. 60 Market Attractiveness Analysis – By Type
        FIG. 61 Market Attractiveness Analysis – By Distribution Channel
        FIG. 62 Market Attractiveness Analysis – By Region
        FIG. 63 Market Channel
        FIG. 64 Marketing Channel Development Trend
        FIG. 65 Growth in World Gross Product, 2008-2018

        List of Tables

        TABLE 1 Global Premium Bottled Water Market, 2019 & 2026 (USD Million)
        TABLE 2 Global Premium Bottled Water market, by Type, 2016-2019 (USD Million)
        TABLE 3 Global Premium Bottled Water market, by Distribution Channel, 2016-2019 (USD Million)
        TABLE 4 Global Premium Bottled Water market, by Region, 2016-2019 (USD Million)
        TABLE 5 North America Premium Bottled Water Market, by Type, 2016-2019 (USD Million)
        TABLE 6 North America Premium Bottled Water Market, by Distribution Channel, 2016-2019 (USD Million)
        TABLE 7 Europe Premium Bottled Water Market, by Type, 2016-2019 (USD Million)
        TABLE 8 Europe Premium Bottled Water Market, by Distribution Channel, 2016-2019 (USD Million)
        TABLE 9 Asia Pacific Premium Bottled Water Market, by Type, 2016-2019 (USD Million)
        TABLE 10 Asia Pacific Premium Bottled Water Market, by Distribution Channel, 2016-2019 (USD Million)
        TABLE 11 Latin America Premium Bottled Water Market, by Type, 2016-2019 (USD Million)
        TABLE 12 Latin America Premium Bottled Water Market, by Distribution Channel, 2016-2019 (USD Million)
        TABLE 13 The Middle-East and Africa Premium Bottled Water Market, by Type, 2016-2019 (USD Million)
        TABLE 14 The Middle-East and Africa Premium Bottled Water Market, by Distribution Channel, 2016-2019 (USD Million)
        TABLE 15 Global Premium Bottled Water Market - Company Revenue Analysis 2015-2025 (USD Million)
        TABLE 16 Global Premium Bottled Water Market - Company Revenue Share Analysis 2015-2025(%)
        TABLE 17 Acquisitions and Mergers
        TABLE 18 New Product/Service Launch
        TABLE 19 Research & Development Activities
        TABLE 20 Market Drivers
        TABLE 21 Market Restraints
        TABLE 22 Market Opportunities

Industry Major Market Players

  •  Danone
  •  Pepsico
  •  Nestle
  •  Hangzhou Wahaha Group Co. Ltd.
  •  Nestlé Waters
  •  The Coca Cola Company
  •  Natural Waters of Viti Ltd.
  •  PepsiCo Inc.
  •  Mountain Valley Spring Company
  •  Dasani and Icelandic Glacial Inc.