![]()
Search Market Research Report
Precision Farming Market Size, Share Global Analysis Report, 2024 – 2032

Precision Farming Market Size, Share, Growth Analysis Report By Offerings (Services, Software, And Hardware), By Technologies (Variable Rate Technology, Remote Sensing Technology, And Guidance Technology), By Applications (Financial Management, Farm Labor Management, Inventory Management, Tracking & Forecasting Variable Rates, Application Field Mapping, Crop Scouting, Yield Monitoring, And Others), And By Region - Global Industry Insights, Overview, Comprehensive Analysis, Trends, Statistical Research, Market Intelligence, Historical Data and Forecast 2024 – 2032
Industry Insights
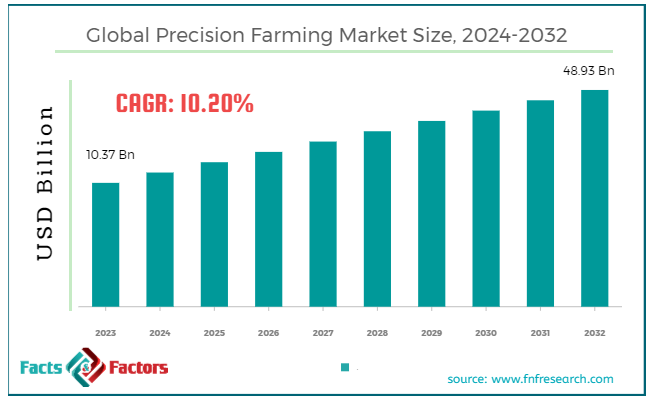
[217+ Pages Report] According to Facts & Factors, the global precision farming market size was valued at USD 10.37 billion in 2023 and is predicted to surpass USD 48.93 billion by the end of 2032. The precision farming industry is expected to grow by a CAGR of 10.20% between 2024 and 2032.
 Market Overview
Precision farming involves the application of advanced technologies to optimize agricultural practices. These help farmers manage and monitor crop production, thereby offering better output and higher yields at lower costs. It is a sustainable farming practice that is environmentally friendly as it does not involve the use of harmful chemicals to improve soil health and also aids in conserving resources like land and water.
Precision farming applications help farmers with more informed and data-driven decision-making capabilities based on real-time situations in their fields. Also, it helps in using the right amounts of inputs like fertilizers, water, and seeds to maximize crop production and eliminate waste.
Key Insights
- As per the analysis shared by our research analyst, the global precision farming market size is estimated to grow annually at a CAGR of around 10.20% over the forecast period (2024-2032).
- In terms of revenue, the global precision farming market size was valued at around USD 10.37 billion in 2023 and is projected to reach USD 48.93 billion by 2032.
- Growing demand for food production is driving the growth of the global precision farming market.
- Based on the offerings, the hardware segment is growing at a high rate and is projected to dominate the global market.
- Based on technologies, the variable rate technology segment is anticipated to grow with the highest CAGR in the global market.
- Based on the applications, the yield monitoring segment is projected to swipe the largest market share.
- Based on region, North America is expected to dominate the global market during the forecast period.
Growth Drivers
- Growing demand for food production is driving the growth of the global market.
The rising global population is driving high demand for food production, which is a major factor in the high growth rate of the global precision farming market. Precision farming helps farmers maximize their crop yields by addressing rising food concerns. It also assists farmers in efficiently utilizing resources like land, water, and fertilizers for higher productivity and less waste.
Additionally, technological advancements like the development of advanced sensors and drones are further expected to revolutionize the growth of the industry. These advancements help improve productivity and efficiency by offering real-time insights to farmers so they can make data-driven decisions.
Moreover, the launch of automated irrigation systems and tractors is expected to further support the growth trajectory of the industry. Governments across the globe are encouraging farmers to adopt precision agricultural technologies and practices, which is another crucial reason to fuel the growth of the industry. The government is offering grants, subsidies, and research initiatives to widen the scope of precision farming. For instance, Deere & Company took over Smart Apply Inc in 2023 to focus on high-value crop customers and dealers. The acquired company is the leading precision spraying equipment company.
Restraints
- High initial cost is expected to hinder the growth of the global market.
High upfront cost of precision farming technologies is expected to restrict the growth of the precision farming industry during the period. Moreover, the ongoing cost of system upgrades, technical support, software subscriptions, and many others further adds to the overall expenses. Therefore, it also deters small-medium sized farmers.
Opportunities
- Growing emphasis on sustainable agricultural practices is expected to foster growth opportunities in the global market.
There is a rising trend of adopting sustainable farming practices to lower the environmental impact of agriculture, which is expected to foster growth opportunities in the global precision farming market. Precision farming restricts the excessive use of inputs like pesticides and fertilizers, thereby optimizing the resources, which further helps in lowering the ecological footprint of agricultural practices. Also, the growing awareness regarding climate change and environmental degradation is further boosting the demand for precision agriculture technologies in the market.
Also, people are more inclined towards smart devices like sensors for soil moisture analysis to get actionable insights on crop conditions. Therefore, all these factors contribute immensely to the growth of the industry. For instance, AGCO Corporation successfully partnered with Bosch BASF Smart Farming in 2023 to come up with Smart Spraying technology.
Challenges
- Lack of technical expertise is a big challenge in the global market.
Precision farming technologies like automation, remote sensing, data analysis, and many others pose a huge requirement of skilled staff or personnel which is a big challenge in the precision farming industry. It is difficult for farmers to interpret and analyze the data generated by these technologies and tools.
Segmentation Analysis
The global precision farming market can be segmented into offerings, technologies, applications, and regions.
On the basis of offerings, the market can be segmented into services, software, and hardware. The hardware segment is likely to dominate the precision farming industry during the forecast period. Precision farming depends on hardware components like GPS systems, automated machines, drones, and sensors to collect information and offer actionable output. Increasing utilization of sensors and drones in agriculture is expected to accelerate the growth of the segment. Drones are widely used for crop health monitoring, surveillance, and aerial imagery.
Also, sensors help collect data on nutrient levels, temperature, soil, and other different aspects, which helps make important decisions in operations. The ongoing technological innovations like robotic harvesters, GPS-guided radars, self-driving tractors, and many others further foster growth in the segment. These machines eliminate labor costs and improve overall yield.
On the basis of technologies, the market can be segmented into variable rate technology, remote sensing technology, and guidance technology. Variable rate technology is the fastest-growing segment in the global precision farming market. Variable rate technology helps farmers optimize resources according to the requirements of soil and crop conditions.
Farmers can efficiently use the resources like fertilizers, seeds, water, and pesticides to improve the overall crop yield. This technology also helps save costs and increase profitability. Also, this technology is environmentally sustainable as it lowers the use of chemicals that harm the environment.
Additionally, it offers insights on using the right amount of resources in the regions where it is needed the most, thereby eliminating the possibility of wastage. Also, this technology is well integrated with precision farming tools like GPS sensors, drones, and satellite images to offer real-time information on field variability. The growing adoption of artificial intelligence and IoT in agriculture is further expected to revolutionize the market.
On the basis of applications, the market can be segmented into financial management, farm labor management, inventory management, tracking & forecasting variable rates, application field mapping, crop scouting, yield monitoring, and others. The yield monitoring segment accounts for the largest share of the precision farming industry during the forecast period. Yield monitoring is an important function of precision farming, and therefore, it is likely to fuel the growth of the segment.
The yield monitoring system helps with real-time insights into crop field status. End-users install these monitoring systems in harvesters to track the yields across different sections. It also helps in the optimization of farming practices as it helps in finding areas of the field that offer high output. It also pinpoints the specific areas requiring more attention or improved farming practices. Yield monitoring helps farmers increase productivity and profitability, thereby leading to better crop management decisions.
Additionally, advancements in sensor technology are further expected to revolutionize the market. Modern sensors can measure moisture content, crop weight, grain flow rate, and many other aspects, thereby offering deep insights into spatial variability. Integration of monitoring systems helps with better fertilization and irrigation strategies so that farmers can adjust their practices according to the weather to gain maximum yield.
Report Scope
Report Attribute |
Details |
Market Size in 2023 |
USD 10.37 Billion |
Projected Market Size in 2032 |
USD 48.93 Billion |
CAGR Growth Rate |
10.20% CAGR |
Base Year |
2023 |
Forecast Years |
2024-2032 |
Key Market Players |
The Climate Corporation, Proagrica, Grownetics Inc., Farmers Edge Inc., DICKEY-john Corporation, AgEagle Aerial Systems Inc., Topcon Corporation, Deere and Company, Raven Industries Inc., AGCO Corporation, Trimble Inc., CropMetrics LLC, and Others. |
Key Segment |
By Offerings, By Technologies, By Applications, and By Region |
Major Regions Covered |
North America, Europe, Asia Pacific, Latin America, and the Middle East &, Africa |
Purchase Options |
Request customized purchase options to meet your research needs. Explore purchase options |
Regional Analysis
- North America to dominate the global market.
North America is likely to account for the largest share of the global precision farming market during the forecast period. The US is the largest market in the region because of the ongoing innovations in agriculture. The widespread adoption of new technologies like artificial intelligence, IoT, sensors, and many others across North America is expected to revolutionize the farming sector in the region. Also, farmers in the region are using precision agriculture tools to improve their precision farming.
However, governments in North America are establishing favorable environments to support precision farming practices through financial initiatives and subsidies. Furthermore, the growing population in North America is fueling the demand for agricultural productivity. These solutions utilize resources to maximize yield and address the growing concerns regarding agriculture.
Asia Pacific is another major region in the precision farming industry that is likely to see significant growth in the coming years. The growing population in APAC, particularly in countries like India, China, and Japan, is strengthening food demand, further widening the regional market scope. Precision farming technologies help farmers maximize crop growth and improve farm productivity.
Additionally, the ongoing technological advancements in agriculture are also anticipated to revolutionize the market. These innovations are expected to address growing food security concerns by monitoring crops, automating farming practices, and optimizing inputs. Precision farming also helps with sustainable agricultural practices, which improve soil health and optimize water usage. It is also likely to address the rising environmental degradation issues in APAC.
Precision farming practices are widely adopted in the areas in APAC where water is scarce. India and Australia are major countries deploying precision irrigation technologies to check for soil moisture and optimize water usage. Therefore, all these factors contribute immensely to the growth of the regional market during the forecast period. For instance, MyAgData and Topcon came together to improve data sharing in order to offer a more streamlined workflow for farmers in 2022.
Competitive Analysis
The key players in the global precision farming market include:
- The Climate Corporation
- Proagrica
- Grownetics Inc.
- Farmers Edge Inc.
- DICKEY-john Corporation
- AgEagle Aerial Systems Inc.
- Topcon Corporation
- Deere and Company
- Raven Industries Inc.
- AGCO Corporation
- Trimble Inc.
- CropMetrics LLC
For instance, CLAAS and Trimble Inc collaborated with each other to introduce an advanced precision farming system in 2022. This precision farming comes with advanced CLAAS CEMIS 1200 smart display and many other unique features.
The global precision farming market is segmented as follows:
By Offerings Segment Analysis
- Services
- Software
- Hardware
By Technologies Segment Analysis
- Variable Rate Technology
- Remote Sensing Technology
- Guidance Technology
By Applications Segment Analysis
- Financial Management
- Farm Labor Management
- Inventory Management
- Tracking And Forecasting Variable Rates
- Application Field Mapping
- Crop Scouting
- Yield Monitoring
- Others
By Regional Segment Analysis
- North America
- The U.S.
- Canada
- Mexico
- Europe
- France
- The UK
- Spain
- Germany
- Italy
- Rest of Europe
- Asia Pacific
- China
- Japan
- India
- Australia
- Southeast Asia
- Rest of Asia Pacific
- The Middle East & Africa
- Saudi Arabia
- UAE
- Egypt
- Kuwait
- South Africa
- Rest of the Middle East & Africa
- Latin America
- Brazil
- Argentina
- Rest of Latin America
Table of Content
Industry Major Market Players
- The Climate Corporation
- Proagrica
- Grownetics Inc.
- Farmers Edge Inc.
- DICKEY-john Corporation
- AgEagle Aerial Systems Inc.
- Topcon Corporation
- Deere and Company
- Raven Industries Inc.
- AGCO Corporation
- Trimble Inc.
- CropMetrics LLC


Copyright © 2025 - 2026, All Rights Reserved, Facts and Factors