Search Market Research Report

Discover Our Latest Reports
Discover Our Featured Reports
Discover Top Selling Reports

Precious Metal Market Size, Share Global Analysis Report, 2021 – 2026

report img

Precious Metal Market By Product (Gold, Silver, & Platinum Group Metals (PGM)), By Application (Jewelry, Industrial, & Investment), And By Regions - Global & Regional Industry Perspective, Comprehensive Analysis, and Forecast 2021 – 2026

Industry Insights

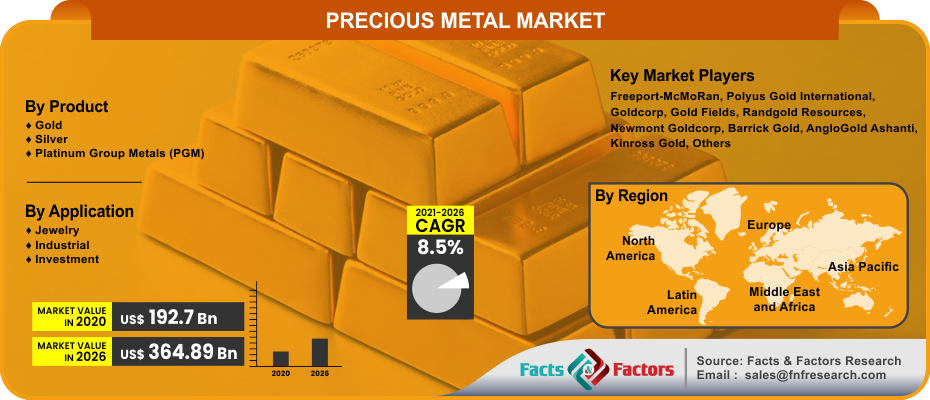
[197+ Pages Report] The latest finding surrounding the “Global Precious Metal Market” recently published by Facts & Factors offers a neatly packaged and comprehensive read. In this report, the global precious metal market will reach a projected value of USD 364.89 Billion by 2026 with a growth rate of 8.5% CAGR from an initial value of USD 192.7 Billion in the year 2020.

logoMarket Overview

Precious metals are the rare and naturally concurring metallic chemical elements of higher economic value and are often less reactive than most elements of the noble class. These metals often have a higher luster and shine. Precious metals have an interesting history and were often traded as currency and are now regarded as investment points in today’s day and age. Additionally, gold, silver, platinum, and palladium have a currency code of ISO 4217.

logoIndustry Growth Factors

The contributing factors that are responsible for the significant growth of the global precious metal market is the rising demand for the products in the jewelry based applications coupled with gold being used as a commodity in various religious beliefs in India and China to name a few. Additionally, the rising marriages in the subcontinent of India and China coupled with increased production of precious metals such as gold and platinum will increase the footprint of the global precious metal market during the advent of the forecast period. Moreover, properties such as higher ductility and machinability within precious metals will boost the growth of the global precious metal market during the advent of the forecast period to a considerable growth.

The global precious metal market will be driven by exchange of precious metals in stock markets coupled with increasing disposable income among consumers to name a few. Recycling of metals and rising consumer waste pertaining to home electronics is expected to give rise to a huge scrap of palladium. However, the advent of COVID-19, rising costs related to extractive measures and rising unemployment measures will hamper the growth of the global precious metal market during the advent of the forecast period.

Precious Metal Market

To know more about this report | Request Free Sample Copy

logoSegmentation Analysis

The global precious metal market is segmented into product, application, and region.

On the basis of product, the global precious metal market is  divided into gold, silver, and platinum group metals (PGM). The silver segment is expected to witness the largest market share during the advent of the forecast period owing to increased usage among the industrial and jewelry sector coupled with a much lower cost when compared to its counterparts to name a few. The segment pertaining to gold is expected to witness the fastest growing CAGR during the advent of the forecast period owing to higher trading prices coupled with increased production across a global purview to name a few. Based on application, the global precious metal market is classified into jewelry, industrial, and investment. The industrial segment is expected to witness the largest market share during the advent of the forecast period owing to increased usage among electrical and electronics sector coupled with rise in silver commodities across a wider applicable scale. The segment pertaining to jewelry is expected to occupy a substantial market share during the advent of the forecast period owing to steady consumption patterns coupled with increasing wedding sector amongst emerging economies to name a few.

logo Report Scope

Report Attribute

Details

Market Size in 2020

USD 192.7 Billion

Projected Market Size in 2026

USD 364.89 Billion

CAGR Growth Rate

8.5% CAGR

Base Year

2020

Forecast Years

2021-2026

Key Market Players

Freeport-McMoRan, Polyus Gold International, Goldcorp, Gold Fields, Randgold Resources, Newmont Goldcorp, Barrick Gold, AngloGold Ashanti, Kinross Gold, Newcrest Mining, First Quantum Minerals, North American Palladium Ltd, Harmony Gold Mining Limited, and GlencoreXstrata, and Others

Key Segments

Product, Application, and Region

Major Regions Covered

North America, Europe, Asia Pacific, Latin America, and Middle East & Africa

Purchase Options

Request customized purchase options to meet your research needs. Explore purchase options

logo Regional Analysis

Asia-Pacific is expected to witness the largest market share during the advent of the forecast period owing to rising demand from emerging economies such as India, China, Japan, and Malaysia coupled with the region being the home to strong manufacturing sectors to name a few. Additionally, factors such as India being the home to a strong consumer base pertaining to gold coupled with rising penetration of international players will increase the footprint of the precious metal market during the advent of the forecast period. Rising FDIs by foreign players in the region coupled with strong and favorable initiatives aimed at improving extraction and exploration of precious metals will further boost the growth of the precious metal market during the advent of the forecast period. North America will witness the fastest growing CAGR during the advent of the forecast duration owing to easy availability of silver based resources coupled with a stronger manufacturing base in the central region of United States to name a few.

logo Competitive Players

The key market participants for the global precious metal market are

  • Freeport-McMoRan
  • Polyus Gold International
  • Goldcorp
  • Gold Fields
  • Randgold Resources
  • Newmont Goldcorp
  • Barrick Gold
  • AngloGold Ashanti
  • Kinross Gold
  • Newcrest Mining
  • First Quantum Minerals
  • North American Palladium Ltd
  • Harmony Gold Mining Limited
  • GlencoreXstrata

logo By Product Segment Analysis

  • Gold
  • Silver
  • Platinum Group Metals (PGM)

logo By Application Segment Analysis

  • Jewelry
  • Industrial
  • Investment

logo By Regional Segment Analysis

  • North America
    • U.S.
    • Canada
  • Europe
    • UK
    • France
    • Germany
    • Italy
    • Spain
    • Rest of Europe
  • Asia Pacific
    • China
    • Japan
    • India
    • South Korea
    • Southeast Asia
    • Rest of Asia Pacific
  • Latin America
    • Brazil
    • Mexico
    • Rest of Latin America
  • Middle East and Africa
    • GCC Countries
    • South Africa
    • Rest of MEA

Table of Content

  1. Chapter 1 Executive Summary
    1. 1.1. Introduction of Precious Metal
    2. 1.2. Global Precious Metal Market, 2019 & 2026 (USD Billion)
    3. 1.3. Global Precious Metal Market, 2016 – 2026 (USD Billion)
    4. 1.4. Global Precious Metal Market Absolute Revenue Opportunity, 2016 – 2026 (USD Billion)
    5. 1.5. Global Precious Metal Market Incremental Revenue Opportunity, 2020 – 2026 (USD Billion)
  2. Chapter 2 Precious Metal Market – Product Analysis
    1. 2.1. Global Precious Metal Market – Product Overview
    2. 2.2. Global Precious Metal Market Share, by Product, 2019 & 2026 (USD Billion)
    3. 2.3. Gold
      1. 2.3.1. Global Gold Precious Metal Market, 2016 – 2026 (USD Billion)
    4. 2.4. Silver
      1. 2.4.1. Global Silver Precious Metal Market, 2016 – 2026 (USD Billion)
    5. 2.5. Platinum Group Metals (PGM)
      1. 2.5.1. Global Platinum Group Metals (PGM) Precious Metal Market, 2016 – 2026 (USD Billion)
  3. Chapter 3 Precious Metal Market – Application Analysis
    1. 3.1. Global Precious Metal Market – Application Overview
    2. 3.2. Global Precious Metal Market Share, by Application, 2019 & 2026 (USD Billion)
    3. 3.3. Jewelry
      1. 3.3.1. Global Jewelry Precious Metal Market, 2016 – 2026 (USD Billion)
    4. 3.4. Industrial
      1. 3.4.1. Global Industrial Precious Metal Market, 2016 – 2026 (USD Billion)
    5. 3.5. Investment
      1. 3.5.1. Global Investment Precious Metal Market, 2016 – 2026 (USD Billion)
  4. Chapter 4 Precious Metal Market – Regional Analysis
    1. 4.1. Global Precious Metal Market Regional Overview
    2. 4.2. Global Precious Metal Market Share, by Region, 2019 & 2026 (USD Billion)
    3. 4.3. North America
      1. 4.3.1. North America Precious Metal Market, 2016 – 2026 (USD Billion)
        1. 4.3.1.1. North America Precious Metal Market, by Country, 2016 - 2026 (USD Billion)
      2. 4.3.2. North America Precious Metal Market, by Product, 2016 – 2026
        1. 4.3.2.1. North America Precious Metal Market, by Product, 2016 – 2026 (USD Billion)
      3. 4.3.3. North America Precious Metal Market, by Application, 2016 – 2026
        1. 4.3.3.1. North America Precious Metal Market, by Application, 2016 – 2026 (USD Billion)
      4. 4.3.4. U.S.
        1. 4.3.4.1. U.S. Precious Metal Market, 2016 – 2026 (USD Billion)
      5. 4.3.5. Canada
        1. 4.3.5.1. Canada Precious Metal Market, 2016 – 2026 (USD Billion)
    4. 4.4. Europe
      1. 4.4.1. Europe Precious Metal Market, 2016 – 2026 (USD Billion)
        1. 4.4.1.1. Europe Precious Metal Market, by Country, 2016 - 2026 (USD Billion)
      2. 4.4.2. Europe Precious Metal Market, by Product, 2016 – 2026
        1. 4.4.2.1. Europe Precious Metal Market, by Product, 2016 – 2026 (USD Billion)
      3. 4.4.3. Europe Precious Metal Market, by Application, 2016 – 2026
        1. 4.4.3.1. Europe Precious Metal Market, by Application, 2016 – 2026 (USD Billion)
      4. 4.4.4. Germany
        1. 4.4.4.1. Germany Precious Metal Market, 2016 – 2026 (USD Billion)
      5. 4.4.5. France
        1. 4.4.5.1. France Precious Metal Market, 2016 – 2026 (USD Billion)
      6. 4.4.6. U.K.
        1. 4.4.6.1. U.K. Precious Metal Market, 2016 – 2026 (USD Billion)
      7. 4.4.7. Italy
        1. 4.4.7.1. Italy Precious Metal Market, 2016 – 2026 (USD Billion)
      8. 4.4.8. Spain
        1. 4.4.8.1. Spain Precious Metal Market, 2016 – 2026 (USD Billion)
      9. 4.4.9. Rest of Europe
        1. 4.4.9.1. Rest of Europe Precious Metal Market, 2016 – 2026 (USD Billion)
    5. 4.5. Asia Pacific
      1. 4.5.1. Asia Pacific Precious Metal Market, 2016 – 2026 (USD Billion)
        1. 4.5.1.1. Asia Pacific Precious Metal Market, by Country, 2016 - 2026 (USD Billion)
      2. 4.5.2. Asia Pacific Precious Metal Market, by Product, 2016 – 2026
        1. 4.5.2.1. Asia Pacific Precious Metal Market, by Product, 2016 – 2026 (USD Billion)
      3. 4.5.3. Asia Pacific Precious Metal Market, by Application, 2016 – 2026
        1. 4.5.3.1. Asia Pacific Precious Metal Market, by Application, 2016 – 2026 (USD Billion)
      4. 4.5.4. China
        1. 4.5.4.1. China Precious Metal Market, 2016 – 2026 (USD Billion)
      5. 4.5.5. Japan
        1. 4.5.5.1. Japan Precious Metal Market, 2016 – 2026 (USD Billion)
      6. 4.5.6. India
        1. 4.5.6.1. India Precious Metal Market, 2016 – 2026 (USD Billion)
      7. 4.5.7. South Korea
        1. 4.5.7.1. South Korea Precious Metal Market, 2016 – 2026 (USD Billion)
      8. 4.5.8. South-East Asia
        1. 4.5.8.1. South-East Asia Precious Metal Market, 2016 – 2026 (USD Billion)
      9. 4.5.9. Rest of Asia Pacific
        1. 4.5.9.1. Rest of Asia Pacific Precious Metal Market, 2016 – 2026 (USD Billion)
    6. 4.6. Latin America
      1. 4.6.1. Latin America Precious Metal Market, 2016 – 2026 (USD Billion)
        1. 4.6.1.1. Latin America Precious Metal Market, by Country, 2016 - 2026 (USD Billion)
      2. 4.6.2. Latin America Precious Metal Market, by Product, 2016 – 2026
        1. 4.6.2.1. Latin America Precious Metal Market, by Product, 2016 – 2026 (USD Billion)
      3. 4.6.3. Latin America Precious Metal Market, by Application, 2016 – 2026
        1. 4.6.3.1. Latin America Precious Metal Market, by Application, 2016 – 2026 (USD Billion)
      4. 4.6.4. Brazil
        1. 4.6.4.1. Brazil Precious Metal Market, 2016 – 2026 (USD Billion)
      5. 4.6.5. Mexico
        1. 4.6.5.1. Mexico Precious Metal Market, 2016 – 2026 (USD Billion)
      6. 4.6.6. Rest of Latin America
        1. 4.6.6.1. Rest of Latin America Precious Metal Market, 2016 – 2026 (USD Billion)
    7. 4.7. The Middle-East and Africa
      1. 4.7.1. The Middle-East and Africa Precious Metal Market, 2016 – 2026 (USD Billion)
        1. 4.7.1.1. The Middle-East and Africa Precious Metal Market, by Country, 2016 - 2026 (USD Billion)
      2. 4.7.2. The Middle-East and Africa Precious Metal Market, by Product, 2016 – 2026
        1. 4.7.2.1. The Middle-East and Africa Precious Metal Market, by Product, 2016 – 2026 (USD Billion)
      3. 4.7.3. The Middle-East and Africa Precious Metal Market, by Application, 2016 – 2026
        1. 4.7.3.1. The Middle-East and Africa Precious Metal Market, by Application, 2016 – 2026 (USD Billion)
      4. 4.7.4. GCC Countries
        1. 4.7.4.1. GCC Countries Precious Metal Market, 2016 – 2026 (USD Billion)
      5. 4.7.5. South Africa
        1. 4.7.5.1. South Africa Precious Metal Market, 2016 – 2026 (USD Billion)
      6. 4.7.6. Rest of Middle-East Africa
        1. 4.7.6.1. Rest of Middle-East Africa Precious Metal Market, 2016 – 2026 (USD Billion)
  5. Chapter 5 Precious Metal Market – Competitive Landscape
    1. 5.1. Competitor Market Share – Revenue
    2. 5.2. Market Concentration Rate Analysis, Top 3 and Top 5 Players
    3. 5.3. Strategic Developments
      1. 5.3.1. Acquisitions and Mergers
      2. 5.3.2. New Products
      3. 5.3.3. Research & Development Activities
  6. Chapter 6 Company Profiles
    1. 6.1. Freeport-McMoRan
      1. 6.1.1. Company Overview
      2. 6.1.2. Product/Service Portfolio
      3. 6.1.3. Freeport-McMoRan Sales, Revenue, and Gross Margin
      4. 6.1.4. Freeport-McMoRan Revenue and Growth Rate
      5. 6.1.5. Freeport-McMoRan Market Share
      6. 6.1.6. Recent Initiatives, Funding/VC Activities, and Technological Innovations
    2. 6.2. Polyus Gold International
      1. 6.2.1. Company Overview
      2. 6.2.2. Product/Service Portfolio
      3. 6.2.3. Polyus Gold International Sales, Revenue, and Gross Margin
      4. 6.2.4. Polyus Gold International Revenue and Growth Rate
      5. 6.2.5. Polyus Gold International Market Share
      6. 6.2.6. Recent Initiatives, Funding/VC Activities, and Technological Innovations
    3. 6.3. Goldcorp
      1. 6.3.1. Company Overview
      2. 6.3.2. Product/Service Portfolio
      3. 6.3.3. Goldcorp Sales, Revenue, and Gross Margin
      4. 6.3.4. Goldcorp Revenue and Growth Rate
      5. 6.3.5. Goldcorp Market Share
      6. 6.3.6. Recent Initiatives, Funding/VC Activities, and Technological Innovations
    4. 6.4. Gold Fields
      1. 6.4.1. Company Overview
      2. 6.4.2. Product/Service Portfolio
      3. 6.4.3. Gold Fields Sales, Revenue, and Gross Margin
      4. 6.4.4. Gold Fields Revenue and Growth Rate
      5. 6.4.5. Gold Fields Market Share
      6. 6.4.6. Recent Initiatives, Funding/VC Activities, and Technological Innovations
    5. 6.5. Randgold Resources
      1. 6.5.1. Company Overview
      2. 6.5.2. Product/Service Portfolio
      3. 6.5.3. Randgold Resources Sales, Revenue, and Gross Margin
      4. 6.5.4. Randgold Resources Revenue and Growth Rate
      5. 6.5.5. Randgold Resources Market Share
      6. 6.5.6. Recent Initiatives, Funding/VC Activities, and Technological Innovations
    6. 6.6. Newmont Goldcorp
      1. 6.6.1. Company Overview
      2. 6.6.2. Product/Service Portfolio
      3. 6.6.3. Newmont Goldcorp Sales, Revenue, and Gross Margin
      4. 6.6.4. Newmont Goldcorp Revenue and Growth Rate
      5. 6.6.5. Newmont Goldcorp Market Share
      6. 6.6.6. Recent Initiatives, Funding/VC Activities, and Technological Innovations
    7. 6.7. Barrick Gold
      1. 6.7.1. Company Overview
      2. 6.7.2. Product/Service Portfolio
      3. 6.7.3. Barrick Gold Sales, Revenue, and Gross Margin
      4. 6.7.4. Barrick Gold Revenue and Growth Rate
      5. 6.7.5. Barrick Gold Market Share
      6. 6.7.6. Recent Initiatives, Funding/VC Activities, and Technological Innovations
    8. 6.8. AngloGold Ashanti
      1. 6.8.1. Company Overview
      2. 6.8.2. Product/Service Portfolio
      3. 6.8.3. AngloGold Ashanti Sales, Revenue, and Gross Margin
      4. 6.8.4. AngloGold Ashanti Revenue and Growth Rate
      5. 6.8.5. AngloGold Ashanti Market Share
      6. 6.8.6. Recent Initiatives, Funding/VC Activities, and Technological Innovations
    9. 6.9. Kinross Gold
      1. 6.9.1. Company Overview
      2. 6.9.2. Product/Service Portfolio
      3. 6.9.3. Kinross Gold Sales, Revenue, and Gross Margin
      4. 6.9.4. Kinross Gold Revenue and Growth Rate
      5. 6.9.5. Kinross Gold Market Share
      6. 6.9.6. Recent Initiatives, Funding/VC Activities, and Technological Innovations
    10. 6.10. Newcrest Mining
      1. 6.10.1. Company Overview
      2. 6.10.2. Product/Service Portfolio
      3. 6.10.3. Newcrest Mining Sales, Revenue, and Gross Margin
      4. 6.10.4. Newcrest Mining Revenue and Growth Rate
      5. 6.10.5. Newcrest Mining Market Share
      6. 6.10.6. Recent Initiatives, Funding/VC Activities, and Technological Innovations
    11. 6.11. First Quantum Minerals
      1. 6.11.1. Company Overview
      2. 6.11.2. Product/Service Portfolio
      3. 6.11.3. First Quantum Minerals Sales, Revenue, and Gross Margin
      4. 6.11.4. First Quantum Minerals Revenue and Growth Rate
      5. 6.11.5. First Quantum Minerals Market Share
      6. 6.11.6. Recent Initiatives, Funding/VC Activities, and Technological Innovations
    12. 6.12. North American Palladium Ltd
      1. 6.12.1. Company Overview
      2. 6.12.2. Product/Service Portfolio
      3. 6.12.3. North American Palladium Ltd Sales, Revenue, and Gross Margin
      4. 6.12.4. North American Palladium Ltd Revenue and Growth Rate
      5. 6.12.5. North American Palladium Ltd Market Share
      6. 6.12.6. Recent Initiatives, Funding/VC Activities, and Technological Innovations
    13. 6.13. Harmony Gold Mining Limited
      1. 6.13.1. Company Overview
      2. 6.13.2. Product/Service Portfolio
      3. 6.13.3. Harmony Gold Mining Limited Sales, Revenue, and Gross Margin
      4. 6.13.4. Harmony Gold Mining Limited Revenue and Growth Rate
      5. 6.13.5. Harmony Gold Mining Limited Market Share
      6. 6.13.6. Recent Initiatives, Funding/VC Activities, and Technological Innovations
    14. 6.14. GlencoreXstrata
      1. 6.14.1. Company Overview
      2. 6.14.2. Product/Service Portfolio
      3. 6.14.3. GlencoreXstrata Sales, Revenue, and Gross Margin
      4. 6.14.4. GlencoreXstrata Revenue and Growth Rate
      5. 6.14.5. GlencoreXstrata Market Share
      6. 6.14.6. Recent Initiatives, Funding/VC Activities, and Technological Innovations
  7. Chapter 7 Precious Metal — Industry Analysis
    1. 7.1. Introduction and Taxonomy
    2. 7.2. Precious Metal Market – Key Trends
      1. 7.2.1. Market Drivers
      2. 7.2.2. Market Restraints
      3. 7.2.3. Market Opportunities
    3. 7.3. Value Chain Analysis
    4. 7.4. Key Mandates and Regulations
    5. 7.5. Technology Roadmap and Timeline
    6. 7.6. Precious Metal Market – Attractiveness Analysis
      1. 7.6.1. By Product
      2. 7.6.2. By Application
      3. 7.6.3. By Region
  8. Chapter 8 Industrial Chain, Sourcing Strategy, and Downstream Buyers
    1. 8.1. Precious Metal Industrial Chain Analysis
    2. 8.2. Downstream Buyers
    3. 8.3. Distributors/Traders List
  9. Chapter 9 Marketing Strategy Analysis
    1. 9.1. Marketing Channel
    2. 9.2. Direct Marketing
    3. 9.3. Indirect Marketing
    4. 9.4. Marketing Channel Development Trends
    5. 9.5. Economic/Political Environmental Change
  10. Chapter 10 Report Conclusion & Key Insights
    1. 10.1. Key Insights from Primary Interviews & Surveys Respondents
    2. 10.2. Key Takeaways from Analysts, Consultants, and Industry Leaders
  11. Chapter 11 Research Approach & Methodology
    1. 11.1. Report Description
    2. 11.2. Research Scope
    3. 11.3. Research Methodology
      1. 11.3.1. Secondary Research
      2. 11.3.2. Primary Research
      3. 11.3.3. Statistical Models
        1. 11.3.3.1. Company Share Analysis Model
        2. 11.3.3.2. Revenue Based Modeling
      4. 11.3.4. Research Limitations

      List of Figures

      Fig.1	Product Picture of Precious Metal
      Fig.2	Global Precious Metal Market, 2016 – 2026 (USD Billion)
      Fig.3	Global Precious Metal Market Absolute Revenue Opportunity, 2016 – 2026 (USD Billion)
      Fig.4	Global Precious Metal Market Incremental Revenue Opportunity, 2020 – 2026 (USD Billion)
      Fig.5	Global Precious Metal Market Share, by Product, 2019 & 2026 (USD Billion)
      Fig.6	Global Gold Precious Metal Market, 2016 – 2026 (USD Billion)
      Fig.7	Global Silver  Precious Metal Market, 2016 – 2026 (USD Billion)
      Fig.8	Global Platinum Group Metals (PGM) Precious Metal Market, 2016 – 2026 (USD Billion)
      Fig.9	Global Precious Metal Market Share, by Application, 2019 & 2026 (USD Billion)
      Fig.10	Global Jewelry  Precious Metal Market, 2016 – 2026 (USD Billion)
      Fig.11	Global Industrial  Precious Metal Market, 2016 – 2026 (USD Billion)
      Fig.12	Global Investment Precious Metal Market, 2016 – 2026 (USD Billion)
      Fig.13	Global Precious Metal Market Share, by Region, 2019 & 2026 (USD Billion)
      Fig.14	North America Precious Metal Market, 2016 – 2026 (USD Billion)
      Fig.15	U.S. Precious Metal Market, 2016 – 2026 (USD Billion)
      Fig.16	Canada Precious Metal Market, 2016 – 2026 (USD Billion)
      Fig.17	Europe Precious Metal Market, 2016 – 2026 (USD Billion)
      Fig.18	Germany Precious Metal Market, 2016 – 2026 (USD Billion)
      Fig.19	France Precious Metal Market, 2016 – 2026 (USD Billion)
      Fig.20	U.K. Precious Metal Market, 2016 – 2026 (USD Billion)
      Fig.21	Italy Precious Metal Market, 2016 – 2026 (USD Billion)
      Fig.22	Spain Precious Metal Market, 2016 – 2026 (USD Billion)
      Fig.23	Rest of Europe Precious Metal Market, 2016 – 2026 (USD Billion)
      Fig.24	Asia Pacific Precious Metal Market, 2016 – 2026 (USD Billion)
      Fig.25	China Precious Metal Market, 2016 – 2026 (USD Billion)
      Fig.26	Japan Precious Metal Market, 2016 – 2026 (USD Billion)
      Fig.27	India Precious Metal Market, 2016 – 2026 (USD Billion)
      Fig.28	South  Korea Precious Metal Market, 2016 – 2026 (USD Billion)
      Fig.29	South-East Asia Precious Metal Market, 2016 – 2026 (USD Billion)
      Fig.30	Rest of Asia Pacific Precious Metal Market, 2016 – 2026 (USD Billion)
      Fig.31	Latin America Precious Metal Market, 2016 – 2026 (USD Billion)
      Fig.32	Brazil Precious Metal Market, 2016 – 2026 (USD Billion)
      Fig.33	Mexico Precious Metal Market, 2016 – 2026 (USD Billion)
      Fig.34	Rest of Latin America Precious Metal Market, 2016 – 2026 (USD Billion)
      Fig.35	The Middle-East and Africa Precious Metal Market, 2016 – 2026 (USD Billion)
      Fig.36	GCC Countries Precious Metal Market, 2016 – 2026 (USD Billion)
      Fig.37	South Africa Precious Metal Market, 2016 – 2026 (USD Billion)
      Fig.38	Rest of Middle-East Africa Precious Metal Market, 2016 – 2026 (USD Billion)
      Fig.39	Competitor Market Share – Revenue
      Fig.40	Freeport-McMoRan Revenue and Growth Rate
      Fig.41	Freeport-McMoRan Market Share
      Fig.42	Polyus Gold International Revenue and Growth Rate
      Fig.43	Polyus Gold International Market Share
      Fig.44	Goldcorp Revenue and Growth Rate
      Fig.45	Goldcorp Market Share
      Fig.46	Gold Fields Revenue and Growth Rate
      Fig.47	Gold Fields Market Share
      Fig.48	Randgold Resources Revenue and Growth Rate
      Fig.49	Randgold Resources Market Share
      Fig.50	Newmont Goldcorp Revenue and Growth Rate
      Fig.51	Newmont Goldcorp Market Share
      Fig.52	Barrick Gold Revenue and Growth Rate
      Fig.53	Barrick Gold Market Share
      Fig.54	AngloGold Ashanti Revenue and Growth Rate
      Fig.55	AngloGold Ashanti Market Share
      Fig.56	Kinross Gold Revenue and Growth Rate
      Fig.57	Kinross Gold Market Share
      Fig.58	Newcrest Mining Revenue and Growth Rate
      Fig.59	Newcrest Mining Market Share
      Fig.60	First Quantum Minerals Revenue and Growth Rate
      Fig.61	First Quantum Minerals Market Share
      Fig.62	North American Palladium Ltd Revenue and Growth Rate
      Fig.63	North American Palladium Ltd Market Share
      Fig.64	Harmony Gold Mining Limited Revenue and Growth Rate
      Fig.65	Harmony Gold Mining Limited Market Share
      Fig.66	GlencoreXstrata Revenue and Growth Rate
      Fig.67	GlencoreXstrata Market Share
      Fig.68	Market Dynamics
      Fig.69	Global Precious Metal – Value Chain Analysis
      Fig.70	Key Mandates and Regulations
      Fig.71	Technology Roadmap and Timeline
      Fig.72	Market Attractiveness Analysis – By Product
      Fig.73	Market Attractiveness Analysis – By Application
      Fig.74	Market Attractiveness Analysis – By Region
      Fig.75	Precious Metal Industrial Chain Analysis
      Fig.76	Market Channels
      Fig.77	Marketing Channel Development Trend
      Fig.78	Growth in World Gross Product, 2008-2018
      

      List of Tables

      Table 1	Global Precious Metal Market, 2019 & 2026 (USD Billion)
      Table 2	Global Precious Metal Market, by Product, 2016 – 2026 (USD Billion)
      Table 3	Global Precious Metal Market, by Application, 2016 – 2026 (USD Billion)
      Table 4	Global Precious Metal Market, by Region, 2016 – 2026 (USD Billion)
      Table 5	North America Precious Metal Market, by Country, 2016 – 2026 (USD Billion)
      Table 6	North America Precious Metal Market, by Product, 2016 – 2026 (USD Billion)
      Table 7	North America Precious Metal Market, by Application, 2016 – 2026 (USD Billion)
      Table 8	Europe Precious Metal Market, by Country, 2016 – 2026 (USD Billion)
      Table 9	Europe Precious Metal Market, by Product, 2016 – 2026 (USD Billion)
      Table 10 Europe Precious Metal Market, by Application, 2016 – 2026 (USD Billion)
      Table 11 Asia Pacific Precious Metal Market, by Country, 2016 – 2026 (USD Billion)
      Table 12 Asia Pacific Precious Metal Market, by Product, 2016 – 2026 (USD Billion)
      Table 13 Asia Pacific Precious Metal Market, by Application, 2016 – 2026 (USD Billion)
      Table 14 Latin America Precious Metal Market, by Country, 2016 – 2026 (USD Billion)
      Table 15 Latin America Precious Metal Market, by Product, 2016 – 2026 (USD Billion)
      Table 16 Latin America Precious Metal Market, by Application, 2016 – 2026 (USD Billion)
      Table 17 The Middle-East and Africa Precious Metal Market, by Country, 2016 – 2026 (USD Billion)
      Table 18 The Middle-East and Africa Precious Metal Market, by Product, 2016 – 2026 (USD Billion)
      Table 19 The Middle-East and Africa Precious Metal Market, by Application, 2016 – 2026 (USD Billion)
      Table 20 Global Precious Metal Market - Company Revenue Analysis, 2016 – 2019 (USD Billion)
      Table 21 Global Precious Metal Market - Company Revenue Share Analysis, 2016 – 2019 (%)
      Table 22 Acquisitions and Mergers
      Table 23 Market Drivers – Impact Analysis
      Table 24 Market Restraints
      Table 25 Market Opportunities
      Table 26 Major Buyers of Precious Metal
      Table 27 Distributors/Traders of Precious Metal by Region
      

Industry Major Market Players

  • Freeport-McMoRan
  • Polyus Gold International
  • Goldcorp
  • Gold Fields
  • Randgold Resources
  • Newmont Goldcorp
  • Barrick Gold
  • AngloGold Ashanti
  • Kinross Gold
  • Newcrest Mining
  • First Quantum Minerals
  • North American Palladium Ltd
  • Harmony Gold Mining Limited
  • GlencoreXstrata