Search Market Research Report

Discover Our Latest Reports
Discover Our Featured Reports
Discover Top Selling Reports

POS Terminal Market Size, Share Global Analysis Report, 2020–2026

report img

POS Terminal Market By Type (Mobile POS Terminal, and Fixed POS Terminal), By Deployment (0n-Premise, and Cloud-Based), By Component (Hardware, Software, and Services) and By Application (Retail, Hospitals, Restaurants, and Others): Global Industry Outlook, Market Size, Business Intelligence, Consumer Preferences, Statistical Surveys, Comprehensive Analysis, Historical Developments, Current Trends, and Forecast 2020–2026

Industry Insights

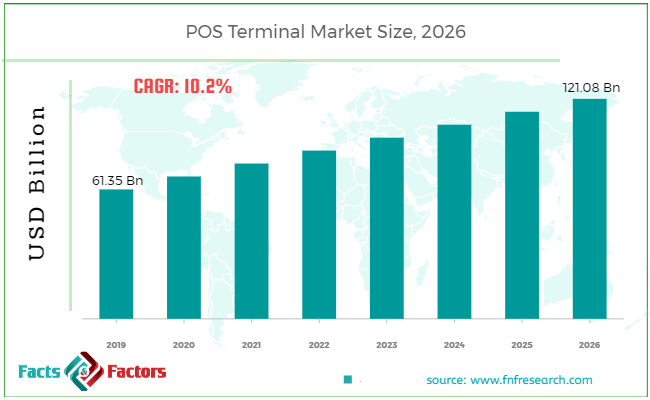
[190+ Pages Report] According to the report published by Facts Factors, the global POS terminal market size was worth around USD 61.35 billion in 2019 and is predicted to grow to around USD 121.08 billion by 2026 with a compound annual growth rate (CAGR) of roughly 10.2% between 2020 and 2026. The report analyzes the global POS terminal market drivers, restraints/challenges, and the effect they have on the demands during the projection period. In addition, the report explores emerging opportunities in the POS terminal market.

POS Terminal Market

To know more about this report | Request Free Sample Copy

The POS terminal market report analyzes and notifies the industry statistics at the global as well as regional and country levels in order to acquire a thorough perspective of the entire POS terminal market. The historical and past insights are provided for FY 2016 to FY 2019 whereas projected trends are delivered for FY 2020 to FY 2026. The quantitative and numerical data is represented in terms of value (USD Billion) and volume (K Units) from FY 2016 – 2026. 


logoKey Insights from Primary Research

  • According to the primary CXOs of the global POS terminal market, the market is estimated to witness a substantial growth of nearly 10.2% over the forecast period.
  • The market was valued at USD 61.35 billion, in 2019 and is expected to be valued at over USD 121.08 billion.
  • On the basis of the component segment, software dominated the global POS terminal market in 2019. In terms of revenue, it accounted for more than a 35% share of the total market in 2019.
  • Application-wise, the retail segment was the largest of the global POS terminal market in 2019. It accounted for more than 30% of the total market share in 2019.
  • By geography, the North American region headed the market with a share of above 28%, in 2019.

logoKey Recommendations from Analysts

  • According to our analyst, emerging digitization in developing countries including India, China, Southeast countries, and so on would likely open new opportunities for the POS terminal market in the years to come.
  • According to industry expertise, the increase in the use of advanced technologies such as near-field communication (NFC) devices in contactless transactions is expected to drive the demand for POS terminals over the future years.
  • Our analysts recommend that the demand for convenience features like invoice management, image scanner, and inventory management drives the demand for POS terminals in retail, healthcare, and restaurants.
  • Advancing technology and software upgrades are expected to see high growth potential for the segment in the coming years.
  • Easy accessibility and high portability is expected to accelerate the demand for POS terminal in the various end-use industries during the years to come.

The quantitative data is further underlined and reinforced by comprehensive qualitative data which comprises various across-the-board market dynamics. The rationales which directly or indirectly impact the POS terminal industry are exemplified through parameters such as growth drivers, restraints, challenges, and opportunities among other impacting factors.

Throughout our research report, we have encompassed all the proven models and tools of industry analysis and extensively illustrated all the key business strategies and business models adopted in the POS terminal industry. The report provides an all-inclusive and detailed competitive landscape prevalent in the POS terminal market.

The report utilizes established industry analysis tools and models such as Porter’s Five Forces framework to analyze and recognize critical business strategies adopted by various stakeholders involved in the entire value chain of the POS terminal industry. The POS terminal market report additionally employs SWOT analysis and PESTLE analysis models for further in-depth analysis.

The report study further includes an in-depth analysis of industry players' market shares and provides an overview of leading players' market position in the POS terminal sector. Key strategic developments in the POS terminal market competitive landscape such as acquisitions & mergers, inaugurations of different products and services, partnerships & joint ventures, MoU agreements, VC & funding activities, R&D activities, and geographic expansion among other noteworthy activities by key players of the POS terminal market are appropriately highlighted in the report.

The POS terminal market research report delivers an acute valuation and taxonomy of the POS terminal industry by practically splitting the market on the basis of different types, applications, and regions. Through the analysis of the historical and projected trends, all the segments and sub-segments were evaluated through the bottom-up approach, and different market sizes have been projected for FY 2020 to FY 2026.

logoReport Scope

Report Attribute

Details

Market Size in 2019

USD 61.35 Billion

Projected Market Size in 2026

USD 121.08 Billion

CAGR Growth Rate

10.2% CAGR

Base Year

2019

Forecast Years

2020-2026

Key Market Players

Panasonic Corporation, PAX Technology Limited, Toshiba Corporation, Ingenico S.A., VeriFone Systems Inc., NEC Corporation, Cisco Systems Inc., Hewlett-Packard Company, MICROS Systems Inc., Samsung Electronics Co., Ltd., and Others

Key Segment

By Type, Deployment, Component, Application, and Region

Major Regions Covered

North America, Europe, Asia Pacific, Latin America, and the Middle East & Africa

Purchase Options

Request customized purchase options to meet your research needs. Explore purchase options

The regional segmentation of the POS terminal industry includes the complete classification of all the major continents including North America, Latin America, Europe, Asia Pacific, and the Middle East & Africa. Further, country-wise data for the POS terminal industry is provided for the leading economies of the world.

POS terminal is a software and hardware tool. It is an electronic device used to read money transfer credit or debit card information for the customer. On the POS terminals of any retail store, shopping mall, restaurant, hotel, hospital, cinema hall, etc., this kind of transformation is performed after buying any product or service. The POS terminal saves time and performs transactions faster. So over the forecast period, it is projected to rise at a faster pace.

The global market for POS terminals is categorized by size, deployment, component, application, and region. The global POS terminal, based on size, is divided into mobile POS terminals and fixed POS terminals. The main deployment mode of the global POS terminal market is on-premise and cloud-based. Software, hardware, and services are key market segments in terms of components. Retail, restaurants, hospitals, and others are major global POS terminal industry applications.

logoSome of the essential players operating in the POS terminal market, but not restricted to include

  • Panasonic Corporation
  • PAX Technology Limited
  • Toshiba Corporation
  • Ingenico S.A.
  • VeriFone Systems Inc.
  • NEC Corporation
  • Cisco Systems Inc.
  • Hewlett-Packard Company
  • MICROS Systems Inc.
  • Samsung Electronics Co. Ltd.

The taxonomy of the POS terminal industry by its scope and segmentation is as follows:

logo By Type Segmentation Analysis

  • Mobile POS Terminal
  • Fixed POS Terminal

logo By Deployment Segmentation Analysis

  • On-Premise
  • Cloud Based

logo By Component Segmentation Analysis

  • Hardware
  • Software
  • Services

logo By Application Segmentation Analysis

  • Hospitals
  • Retail
  • Restaurants
  • Others

logo Regional Segmentation Analysis

  • North America
    • The U.S.
    • Canada
  • Europe
    • Germany
    • The UK
    • France
    • Spain
    • Italy
    • Rest of Europe
  • Asia Pacific
    • China
    • Japan
    • India
    • South Korea
    • Southeast Asia
    • Rest of Asia Pacific
  • Latin America
    • Brazil
    • Mexico
    • Rest of Latin America
  • Middle East & Africa
    • GCC
    • South Africa
    • Rest of Middle East & Africa

Table of Content

  1. CHAPTER 1. Executive Summary
  2. CHAPTER 2. POS Terminal market – Type Analysis
    1. 2.1. Global POS Terminal Market–TypeOverview
    2. 2.2. Global POS TerminalMarketShare, by Type, 2019 & 2026 (USD Billion)
    3. 2.3. Global POS Terminal Market share, by Type, 2019 & 2026 (K Units)
    4. 2.4. Mobile POS Terminal
      1. 2.4.1. Global Mobile POS TerminalPOS TerminalMarket,2016-2026 (USD Billion)
      2. 2.4.2. Global Mobile POS TerminalPOS Terminal Market, 2016-2026 (K Units)
    5. 2.5. Fixed POS Terminal
      1. 2.5.1. Global Fixed POS TerminalPOS TerminalMarket,2016-2026 (USD Billion)
      2. 2.5.2. Global Fixed POS TerminalPOS Terminal Market, 2016-2026 (K Units)
  3. CHAPTER 3. POS Terminal market – Deployment Analysis
    1. 3.1. Global POS Terminal Market–DeploymentOverview
    2. 3.2. Global POS TerminalMarketShare, by Deployment, 2019 & 2026 (USD Billion)
    3. 3.3. Global POS Terminal Market share, by Deployment, 2019 & 2026 (K Units)
    4. 3.4. Cloud-Based
      1. 3.4.1. Global Cloud-BasedPOS TerminalMarket,2016-2026 (USD Billion)
      2. 3.4.2. Global Cloud-BasedPOS Terminal Market, 2016-2026 (K Units)
    5. 3.5. 0n-Premise
      1. 3.5.1. Global 0n-PremisePOS TerminalMarket,2016-2026 (USD Billion)
      2. 3.5.2. Global 0n-PremisePOS Terminal Market, 2016-2026 (K Units)
  4. CHAPTER 4. POS Terminal market – Component Analysis
    1. 4.1. Global POS Terminal Market–ComponentOverview
    2. 4.2. Global POS TerminalMarketShare, by Component, 2019 & 2026 (USD Billion)
    3. 4.3. Global POS Terminal Market share, by Component, 2019 & 2026 (K Units)
    4. 4.4. Hardware
      1. 4.4.1. Global HardwarePOS TerminalMarket,2016-2026 (USD Billion)
      2. 4.4.2. Global HardwarePOS Terminal Market, 2016-2026 (K Units)
    5. 4.5. Software
      1. 4.5.1. Global SoftwarePOS TerminalMarket,2016-2026 (USD Billion)
      2. 4.5.2. Global SoftwarePOS Terminal Market, 2016-2026 (K Units)
    6. 4.6. Services
      1. 4.6.1. Global ServicesPOS TerminalMarket,2016-2026 (USD Billion)
      2. 4.6.2. Global ServicesPOS Terminal Market, 2016-2026 (K Units)
  5. CHAPTER 5. POS Terminal market – Application Analysis
    1. 5.1. Global POS Terminal Market–ApplicationOverview
    2. 5.2. Global POS TerminalMarketShare, by Application, 2019 & 2026 (USD Billion)
    3. 5.3. Global POS Terminal Market share, by Application, 2019 & 2026 (K Units)
    4. 5.4. Retail
      1. 5.4.1. Global RetailPOS TerminalMarket,2016-2026 (USD Billion)
      2. 5.4.2. Global RetailPOS Terminal Market, 2016-2026 (K Units)
    5. 5.5. Hospitals
      1. 5.5.1. Global HospitalsPOS TerminalMarket,2016-2026 (USD Billion)
      2. 5.5.2. Global HospitalsPOS Terminal Market, 2016-2026 (K Units)
    6. 5.6. Restaurants
      1. 5.6.1. Global RestaurantsPOS TerminalMarket,2016-2026 (USD Billion)
      2. 5.6.2. Global RestaurantsPOS Terminal Market, 2016-2026 (K Units)
    7. 5.7. Others
      1. 5.7.1. Global OthersPOS TerminalMarket,2016-2026 (USD Billion)
      2. 5.7.2. Global OthersPOS Terminal Market, 2016-2026 (K Units)
  6. CHAPTER 6. POS Terminal market – Regional Analysis
    1. 6.1. Global POS Terminal MarketRegionalOverview
    2. 6.2. Global POS TerminalMarketShare, by Region, 2019 & 2026 (Value)
    3. 6.3. Global POS Terminal Market Share, by Region, 2019 & 2026 (Volume)
    4. 6.4. North America
      1. 6.4.1. North AmericaPOS Terminal Market size and forecast, 2016-2026
      2. 6.4.2. North AmericaPOS Terminal Market, by Country, 2019 - 2026 (USD Billion)
      3. 6.4.3. North America Market size and forecast, 2016-2026 (K Units)
      4. 6.4.4. North AmericaPOS Terminal Market, by Country, 2019 - 2026 (K Units)
      5. 6.4.5. North AmericaPOS Terminal Market, by Type, 2016-2026
        1. 6.4.5.1. North AmericaPOS Terminal Market, by Type, 2016-2026 (USD Billion)
        2. 6.4.5.2. North AmericaPOS Terminal Market, by Type, 2016-2026 (K Units)
      6. 6.4.6. North AmericaPOS Terminal Market, by Deployment, 2016-2026
        1. 6.4.6.1. North AmericaPOS Terminal Market, by Deployment, 2016-2026 (USD Billion)
        2. 6.4.6.2. North AmericaPOS Terminal Market, by Deployment, 2016-2026 (K Units)
      7. 6.4.7. North AmericaPOS Terminal Market, by Component, 2016-2026
        1. 6.4.7.1. North AmericaPOS Terminal Market, by Component, 2016-2026 (USD Billion)
        2. 6.4.7.2. North AmericaPOS Terminal Market, by Component, 2016-2026 (K Units)
      8. 6.4.8. North AmericaPOS Terminal Market, by Application, 2016-2026
        1. 6.4.8.1. North AmericaPOS Terminal Market, by Application, 2016-2026 (USD Billion)
        2. 6.4.8.2. North AmericaPOS Terminal Market, by Application, 2016-2026 (K Units)
      9. 6.4.9. U.S.
        1. 6.4.9.1. U.S. Market size and forecast, 2016-2026 (USD Billion)
        2. 6.4.9.2. U.S. Market size and forecast, 2016-2026 (K Units)
      10. 6.4.10. Canada
        1. 6.4.10.1. Canada Market size and forecast, 2016-2026 (USD Billion)
        2. 6.4.10.2. Canada Market size and forecast, 2016-2026 (K Units)
    5. 6.5. Europe
      1. 6.5.1. EuropePOS Terminal Market size and forecast, 2016-2026
      2. 6.5.2. EuropePOS Terminal Market, by Country, 2019 - 2026 (USD Billion)
      3. 6.5.3. Europe Market size and forecast, 2016-2026 (K Units)
      4. 6.5.4. EuropePOS Terminal Market, by Country, 2019 - 2026 (K Units)
      5. 6.5.5. EuropePOS Terminal Market, by Type, 2016-2026
        1. 6.5.5.1. EuropePOS Terminal Market, by Type, 2016-2026 (USD Billion)
        2. 6.5.5.2. EuropePOS Terminal Market, by Type, 2016-2026 (K Units)
      6. 6.5.6. EuropePOS Terminal Market, by Deployment, 2016-2026
        1. 6.5.6.1. EuropePOS Terminal Market, by Deployment, 2016-2026 (USD Billion)
        2. 6.5.6.2. EuropePOS Terminal Market, by Deployment, 2016-2026 (K Units)
      7. 6.5.7. EuropePOS Terminal Market, by Component, 2016-2026
        1. 6.5.7.1. EuropePOS Terminal Market, by Component, 2016-2026 (USD Billion)
        2. 6.5.7.2. EuropePOS Terminal Market, by Component, 2016-2026 (K Units)
      8. 6.5.8. EuropePOS Terminal Market, by Application, 2016-2026
        1. 6.5.8.1. EuropePOS Terminal Market, by Application, 2016-2026 (USD Billion)
        2. 6.5.8.2. EuropePOS Terminal Market, by Application, 2016-2026 (K Units)
      9. 6.5.9. Germany
        1. 6.5.9.1. Germany Market size and forecast, 2016-2026 (USD Billion)
        2. 6.5.9.2. Germany Market size and forecast, 2016-2026 (K Units)
      10. 6.5.10. France
        1. 6.5.10.1. France Market size and forecast, 2016-2026 (USD Billion)
        2. 6.5.10.2. France Market size and forecast, 2016-2026 (K Units)
      11. 6.5.11. U.K.
        1. 6.5.11.1. U.K. Market size and forecast, 2016-2026 (USD Billion)
        2. 6.5.11.2. U.K. Market size and forecast, 2016-2026 (K Units)
      12. 6.5.12. Italy
        1. 6.5.12.1. Italy Market size and forecast, 2016-2026 (USD Billion)
        2. 6.5.12.2. Italy Market size and forecast, 2016-2026 (K Units)
      13. 6.5.13. Spain
        1. 6.5.13.1. Spain Market size and forecast, 2016-2026 (USD Billion)
        2. 6.5.13.2. Spain Market size and forecast, 2016-2026 (K Units)
      14. 6.5.14. Rest of Europe
        1. 6.5.14.1. Rest of Europe Market size and forecast, 2016-2026 (USD Billion)
        2. 6.5.14.2. Rest of Europe Market size and forecast, 2016-2026 (K Units)
    6. 6.6. Asia Pacific
      1. 6.6.1. Asia PacificPOS Terminal Market size and forecast, 2016-2026
      2. 6.6.2. Asia PacificPOS Terminal Market, by Country, 2019 - 2026 (USD Billion)
      3. 6.6.3. Asia Pacific Market size and forecast, 2016-2026 (K Units)
      4. 6.6.4. Asia PacificPOS Terminal Market, by Country, 2019 - 2026 (K Units)
      5. 6.6.5. Asia PacificPOS Terminal Market, by Type, 2016-2026
        1. 6.6.5.1. Asia PacificPOS Terminal Market, by Type, 2016-2026 (USD Billion)
        2. 6.6.5.2. Asia PacificPOS Terminal Market, by Type, 2016-2026 (K Units)
      6. 6.6.6. Asia PacificPOS Terminal Market, by Deployment, 2016-2026
        1. 6.6.6.1. Asia PacificPOS Terminal Market, by Deployment, 2016-2026 (USD Billion)
        2. 6.6.6.2. Asia PacificPOS Terminal Market, by Deployment, 2016-2026 (K Units)
      7. 6.6.7. Asia PacificPOS Terminal Market, by Component, 2016-2026
        1. 6.6.7.1. Asia PacificPOS Terminal Market, by Component, 2016-2026 (USD Billion)
        2. 6.6.7.2. Asia PacificPOS Terminal Market, by Component, 2016-2026 (K Units)
      8. 6.6.8. Asia PacificPOS Terminal Market, by Application, 2016-2026
        1. 6.6.8.1. Asia PacificPOS Terminal Market, by Application, 2016-2026 (USD Billion)
        2. 6.6.8.2. Asia PacificPOS Terminal Market, by Application, 2016-2026 (K Units)
      9. 6.6.9. China
        1. 6.6.9.1. China Market size and forecast, 2016-2026 (USD Billion)
        2. 6.6.9.2. China Market size and forecast, 2016-2026 (K Units)
      10. 6.6.10. Japan
        1. 6.6.10.1. Japan Market size and forecast, 2016-2026 (USD Billion)
        2. 6.6.10.2. Japan Market size and forecast, 2016-2026 (K Units)
      11. 6.6.11. India
        1. 6.6.11.1. India Market size and forecast, 2016-2026 (USD Billion)
        2. 6.6.11.2. India Market size and forecast, 2016-2026 (K Units)
      12. 6.6.12. South Korea
        1. 6.6.12.1. South Korea Market size and forecast, 2016-2026 (USD Billion)
        2. 6.6.12.2. South Korea Market size and forecast, 2016-2026 (K Units)
      13. 6.6.13. South-East Asia
        1. 6.6.13.1. South-East Asia Market size and forecast, 2016-2026 (USD Billion)
        2. 6.6.13.2. South-East Asia Market size and forecast, 2016-2026 (K Units)
      14. 6.6.14. Rest of Asia Pacific
        1. 6.6.14.1. Rest of Asia Pacific Market size and forecast, 2016-2026 (USD Billion)
        2. 6.6.14.2. Rest of Asia Pacific Market size and forecast, 2016-2026 (K Units)
    7. 6.7. Latin America
      1. 6.7.1. Latin AmericaPOS Terminal Market size and forecast, 2016-2026
      2. 6.7.2. Latin AmericaPOS Terminal Market, by Country, 2019 - 2026 (USD Billion)
      3. 6.7.3. Latin America Market size and forecast, 2016-2026 (K Units)
      4. 6.7.4. Latin AmericaPOS Terminal Market, by Country, 2019 - 2026 (K Units)
      5. 6.7.5. Latin AmericaPOS Terminal Market, by Type, 2016-2026
        1. 6.7.5.1. Latin AmericaPOS Terminal Market, by Type, 2016-2026 (USD Billion)
        2. 6.7.5.2. Latin AmericaPOS Terminal Market, by Type, 2016-2026 (K Units)
      6. 6.7.6. Latin AmericaPOS Terminal Market, by Deployment, 2016-2026
        1. 6.7.6.1. Latin AmericaPOS Terminal Market, by Deployment, 2016-2026 (USD Billion)
        2. 6.7.6.2. Latin AmericaPOS Terminal Market, by Deployment, 2016-2026 (K Units)
      7. 6.7.7. Latin AmericaPOS Terminal Market, by Component, 2016-2026
        1. 6.7.7.1. Latin AmericaPOS Terminal Market, by Component, 2016-2026 (USD Billion)
        2. 6.7.7.2. Latin AmericaPOS Terminal Market, by Component, 2016-2026 (K Units)
      8. 6.7.8. Latin AmericaPOS Terminal Market, by Application, 2016-2026
        1. 6.7.8.1. Latin AmericaPOS Terminal Market, by Application, 2016-2026 (USD Billion)
        2. 6.7.8.2. Latin AmericaPOS Terminal Market, by Application, 2016-2026 (K Units)
      9. 6.7.9. Brazil
        1. 6.7.9.1. Brazil Market size and forecast, 2016-2026 (USD Billion)
        2. 6.7.9.2. Brazil Market size and forecast, 2016-2026 (K Units)
      10. 6.7.10. Mexico
        1. 6.7.10.1. Mexico Market size and forecast, 2016-2026 (USD Billion)
        2. 6.7.10.2. Mexico Market size and forecast, 2016-2026 (K Units)
      11. 6.7.11. Rest of Latin America
        1. 6.7.11.1. Rest of Latin America Market size and forecast, 2016-2026 (USD Billion)
        2. 6.7.11.2. Rest of Latin America Market size and forecast, 2016-2026 (K Units)
    8. 6.8. The Middle-East and Africa
      1. 6.8.1. The Middle-East and AfricaPOS Terminal Market size and forecast, 2016-2026
      2. 6.8.2. The Middle-East and AfricaPOS Terminal Market, by Country, 2019 - 2026 (USD Billion)
      3. 6.8.3. The Middle-East and Africa Market size and forecast, 2016-2026 (K Units)
      4. 6.8.4. The Middle-East and AfricaPOS Terminal Market, by Country, 2019 - 2026 (K Units)
      5. 6.8.5. The Middle-East and AfricaPOS Terminal Market, by Type, 2016-2026
        1. 6.8.5.1. The Middle-East and AfricaPOS Terminal Market, by Type, 2016-2026 (USD Billion)
        2. 6.8.5.2. The Middle-East and AfricaPOS Terminal Market, by Type, 2016-2026 (K Units)
      6. 6.8.6. The Middle-East and AfricaPOS Terminal Market, by Deployment, 2016-2026
        1. 6.8.6.1. The Middle-East and AfricaPOS Terminal Market, by Deployment, 2016-2026 (USD Billion)
        2. 6.8.6.2. The Middle-East and AfricaPOS Terminal Market, by Deployment, 2016-2026 (K Units)
      7. 6.8.7. The Middle-East and AfricaPOS Terminal Market, by Component, 2016-2026
        1. 6.8.7.1. The Middle-East and AfricaPOS Terminal Market, by Component, 2016-2026 (USD Billion)
        2. 6.8.7.2. The Middle-East and AfricaPOS Terminal Market, by Component, 2016-2026 (K Units)
      8. 6.8.8. The Middle-East and AfricaPOS Terminal Market, by Application, 2016-2026
        1. 6.8.8.1. The Middle-East and AfricaPOS Terminal Market, by Application, 2016-2026 (USD Billion)
        2. 6.8.8.2. The Middle-East and AfricaPOS Terminal Market, by Application, 2016-2026 (K Units)
      9. 6.8.9. GCC Countries
        1. 6.8.9.1. GCC Countries Market size and forecast, 2016-2026 (USD Billion)
        2. 6.8.9.2. GCC Countries Market size and forecast, 2016-2026 (K Units)
      10. 6.8.10. South Africa
        1. 6.8.10.1. South Africa Market size and forecast, 2016-2026 (USD Billion)
        2. 6.8.10.2. South Africa Market size and forecast, 2016-2026 (K Units)
      11. 6.8.11. Rest of Middle-East Africa
        1. 6.8.11.1. Rest of Middle-East Africa Market size and forecast, 2016-2026 (USD Billion)
        2. 6.8.11.2. Rest of Middle-East Africa Market size and forecast, 2016-2026 (K Units)
  7. CHAPTER 7. POS TerminalProduction, Consumption, Export, Import by Regions
    1. 7.1. Global POS Terminal production and revenue, 2016-2026 (USD Billion) (K Units)
    2. 7.2. Global Import and Export Analysis, by Region
  8. CHAPTER 8. POS Terminal market – Competitive Landscape
    1. 8.1. Competitor Market Share – Revenue
    2. 8.2. Market Concentration Rate Analysis, Top 3 and Top 5 Players
    3. 8.3. Competitor Market Share – Volume
    4. 8.4. Strategic Development
      1. 8.4.1. Acquisitions and Mergers
      2. 8.4.2. New Products
      3. 8.4.3. Research & Development Activities
  9. CHAPTER 9. Company Profiles
    1. 9.1. Panasonic Corporation
      1. 9.1.1. Company Overview
      2. 9.1.2. Panasonic Corporation Sales, Revenue, Price, and Gross Margin
      3. 9.1.3. Product portfolio
      4. 9.1.4. Recent initiatives
    2. 9.2. PAX Technology Limited
      1. 9.2.1. Company Overview
      2. 9.2.2. PAX Technology Limited Sales, Revenue, Price, and Gross Margin
      3. 9.2.3. Product portfolio
      4. 9.2.4. Recent initiatives
    3. 9.3. Toshiba Corporation
      1. 9.3.1. Company Overview
      2. 9.3.2. Toshiba Corporation Sales, Revenue, Price, and Gross Margin
      3. 9.3.3. Product portfolio
      4. 9.3.4. Recent initiatives
    4. 9.4. Ingenico S.A.
      1. 9.4.1. Company Overview
      2. 9.4.2. Ingenico S.A. Sales, Revenue, Price, and Gross Margin
      3. 9.4.3. Product portfolio
      4. 9.4.4. Recent initiatives
    5. 9.5. VeriFone Systems Inc.
      1. 9.5.1. Company Overview
      2. 9.5.2. VeriFone Systems Inc. Sales, Revenue, Price, and Gross Margin
      3. 9.5.3. Product portfolio
      4. 9.5.4. Recent initiatives
    6. 9.6. NEC Corporation
      1. 9.6.1. Company Overview
      2. 9.6.2. NEC Corporation Sales, Revenue, Price, and Gross Margin
      3. 9.6.3. Product portfolio
      4. 9.6.4. Recent initiatives
    7. 9.7. Cisco Systems Inc.
      1. 9.7.1. Company Overview
      2. 9.7.2. Cisco Systems Inc. Sales, Revenue, Price, and Gross Margin
      3. 9.7.3. Product portfolio
      4. 9.7.4. Recent initiatives
    8. 9.8. Hewlett-Packard Company
      1. 9.8.1. Company Overview
      2. 9.8.2. Hewlett-Packard Company Sales, Revenue, Price, and Gross Margin
      3. 9.8.3. Product portfolio
      4. 9.8.4. Recent initiatives
    9. 9.9. MICROS Systems Inc.
      1. 9.9.1. Company Overview
      2. 9.9.2. MICROS Systems Inc. Sales, Revenue, Price, and Gross Margin
      3. 9.9.3. Product portfolio
      4. 9.9.4. Recent initiatives
    10. 9.10. Samsung Electronics Co.
      1. 9.10.1. Company Overview
      2. 9.10.2. Samsung Electronics Co. Sales, Revenue, Price, and Gross Margin
      3. 9.10.3. Product portfolio
      4. 9.10.4. Recent initiatives
    11. 9.11. Ltd.
      1. 9.11.1. Company Overview
      2. 9.11.2. Ltd. Sales, Revenue, Price, and Gross Margin
      3. 9.11.3. Product portfolio
      4. 9.11.4. Recent initiatives
  10. CHAPTER 10. POS Terminal — Industry Analysis
    1. 10.1. Introduction and Taxonomy
    2. 10.2. POS Terminal Market – Key Trends
      1. 10.2.1. Market Drivers
      2. 10.2.2. Market Restraints
      3. 10.2.3. Market Opportunities
    3. 10.3. Value Chain Analysis
    4. 10.4. Key Mandates and Regulations
    5. 10.5. Technology Roadmap and Timeline
    6. 10.6. POS Terminal market – Attractiveness Analysis
      1. 10.6.1. By Type
      2. 10.6.2. By Deployment
      3. 10.6.3. By Component
      4. 10.6.4. By Application
      5. 10.6.5. By Region
  11. CHAPTER 11. Raw Material analysis
    1. 11.1. POS Terminal Key Raw Material Analysis
      1. 11.1.1. Key Raw Materials
      2. 11.1.2. Price Trend of Key Raw Materials
    2. 11.2. Key Suppliers of Raw Materials
    3. 11.3. Proportion of Manufacturing Cost Structure
      1. 11.3.1. Raw Materials
      2. 11.3.2. Labor Cost
    4. 11.4. Manufacturing Expenses Analysis of POS Terminal
  12. CHAPTER 12. Industrial Chain, Sourcing Strategy and Downstream Buyers
    1. 12.1. POS Terminal Industrial Chain Analysis
    2. 12.2. Upstream Raw Materials Sourcing
      1. 12.2.1. Risk Mitigation:
      2. 12.2.2. Supplier Relationships:
      3. 12.2.3. Business Processes:
      4. 12.2.4. Securing the Product:
    3. 12.3. Raw Materials Sources of POS Terminal Major Manufacturers in 2016
    4. 12.4. Downstream Buyers
    5. 12.5. Distributors/Traders List
  13. CHAPTER 13. Marketing Strategy Analysis, Distributors
    1. 13.1. Marketing Channel
    2. 13.2. Direct Marketing
    3. 13.3. Indirect Marketing
    4. 13.4. Marketing Channel Development Trend
    5. 13.5. Economic/Political Environmental Change
  14. CHAPTER 14. Report Conclusion
  15. CHAPTER 15. Research Approach & Methodology
    1. 15.1. Report Description
    2. 15.2. Research Scope
    3. 15.3. Research Methodology
      1. 15.3.1. Secondary Research
      2. 15.3.2. Primary Research
      3. 15.3.3. Models
        1. 15.3.3.1. Company Share Analysis Model
        2. 15.3.3.2. Revenue Based Modeling
        3. 15.3.3.3. Research Limitations

        List of Figures

        FIG. 1 Global POS Terminal Market, 2016-2026(USD Billion)
        FIG. 2 Global POS Terminal MarketShare, by Type, 2019 & 2026 (USD Billion)
        FIG. 3 Global POS Terminal Market share, by Type, 2019 & 2026 (K Units)
        FIG. 4 Global Mobile POS TerminalPOS TerminalMarket,2016-2026 (USD Billion)
        FIG. 5 Global Mobile POS TerminalPOS Terminal  Market, 2016-2026 (K Units)
        FIG. 6 Global Fixed POS TerminalPOS TerminalMarket,2016-2026 (USD Billion)
        FIG. 7 Global Fixed POS TerminalPOS Terminal  Market, 2016-2026 (K Units)
        FIG. 8 Global POS Terminal MarketShare, by Deployment, 2019 & 2026 (USD Billion)
        FIG. 9 Global POS Terminal Market share, by Deployment, 2019 & 2026 (K Units)
        FIG. 10 Global Cloud-BasedPOS TerminalMarket,2016-2026 (USD Billion)
        FIG. 11 Global Cloud-BasedPOS Terminal  Market, 2016-2026 (K Units)
        FIG. 12 Global 0n-PremisePOS TerminalMarket,2016-2026 (USD Billion)
        FIG. 13 Global 0n-PremisePOS Terminal  Market, 2016-2026 (K Units)
        FIG. 14 Global POS Terminal MarketShare, by Component, 2019 & 2026 (USD Billion)
        FIG. 15 Global POS Terminal Market share, by Component, 2019 & 2026 (K Units)
        FIG. 16 Global HardwarePOS TerminalMarket,2016-2026 (USD Billion)
        FIG. 17 Global HardwarePOS Terminal  Market, 2016-2026 (K Units)
        FIG. 18 Global SoftwarePOS TerminalMarket,2016-2026 (USD Billion)
        FIG. 19 Global SoftwarePOS Terminal  Market, 2016-2026 (K Units)
        FIG. 20 Global ServicesPOS TerminalMarket,2016-2026 (USD Billion)
        FIG. 21 Global ServicesPOS Terminal  Market, 2016-2026 (K Units)
        FIG. 22 Global POS Terminal MarketShare, by Application, 2019 & 2026 (USD Billion)
        FIG. 23 Global POS Terminal Market share, by Application, 2019 & 2026 (K Units)
        FIG. 24 Global RetailPOS TerminalMarket,2016-2026 (USD Billion)
        FIG. 25 Global RetailPOS Terminal  Market, 2016-2026 (K Units)
        FIG. 26 Global HospitalsPOS TerminalMarket,2016-2026 (USD Billion)
        FIG. 27 Global HospitalsPOS Terminal  Market, 2016-2026 (K Units)
        FIG. 28 Global RestaurantsPOS TerminalMarket,2016-2026 (USD Billion)
        FIG. 29 Global RestaurantsPOS Terminal  Market, 2016-2026 (K Units)
        FIG. 30 Global OthersPOS TerminalMarket,2016-2026 (USD Billion)
        FIG. 31 Global OthersPOS Terminal  Market, 2016-2026 (K Units)
        FIG. 32 Global POS Terminal MarketShare, by Region, 2019 & 2026
        FIG. 33 Global POS Terminal MarketShare, by Region, 2019 & 2026
        FIG. 34 North AmericaPOS Terminal Market, 2016-2026
        FIG. 35 North AmericaPOS Terminal  Market, 2016-2026 (K Units)
        FIG. 36 U.S.POS Terminal Market, 2016-2026
        FIG. 37 U.S.POS Terminal  Market, 2016-2026 (K Units)
        FIG. 38 CanadaPOS Terminal Market, 2016-2026
        FIG. 39 CanadaPOS Terminal  Market, 2016-2026 (K Units)
        FIG. 40 EuropePOS Terminal Market, 2016-2026
        FIG. 41 EuropePOS Terminal  Market, 2016-2026 (K Units)
        FIG. 42 GermanyPOS Terminal Market, 2016-2026
        FIG. 43 GermanyPOS Terminal  Market, 2016-2026 (K Units)
        FIG. 44 FrancePOS Terminal Market, 2016-2026
        FIG. 45 FrancePOS Terminal  Market, 2016-2026 (K Units)
        FIG. 46 U.K.POS Terminal Market, 2016-2026
        FIG. 47 U.K.POS Terminal  Market, 2016-2026 (K Units)
        FIG. 48 ItalyPOS Terminal Market, 2016-2026
        FIG. 49 ItalyPOS Terminal  Market, 2016-2026 (K Units)
        FIG. 50 SpainPOS Terminal Market, 2016-2026
        FIG. 51 SpainPOS Terminal  Market, 2016-2026 (K Units)
        FIG. 52 Rest of EuropePOS Terminal Market, 2016-2026
        FIG. 53 Rest of EuropePOS Terminal  Market, 2016-2026 (K Units)
        FIG. 54 Asia PacificPOS Terminal Market, 2016-2026
        FIG. 55 Asia PacificPOS Terminal  Market, 2016-2026 (K Units)
        FIG. 56 ChinaPOS Terminal Market, 2016-2026
        FIG. 57 ChinaPOS Terminal  Market, 2016-2026 (K Units)
        FIG. 58 JapanPOS Terminal Market, 2016-2026
        FIG. 59 JapanPOS Terminal  Market, 2016-2026 (K Units)
        FIG. 60 IndiaPOS Terminal Market, 2016-2026
        FIG. 61 IndiaPOS Terminal  Market, 2016-2026 (K Units)
        FIG. 62 South  KoreaPOS Terminal Market, 2016-2026
        FIG. 63 South  KoreaPOS Terminal  Market, 2016-2026 (K Units)
        FIG. 64 South-East AsiaPOS Terminal Market, 2016-2026
        FIG. 65 South-East AsiaPOS Terminal  Market, 2016-2026 (K Units)
        FIG. 66 Rest of Asia PacificPOS Terminal Market, 2016-2026
        FIG. 67 Rest of Asia PacificPOS Terminal  Market, 2016-2026 (K Units)
        FIG. 68 Latin AmericaPOS Terminal Market, 2016-2026
        FIG. 69 Latin AmericaPOS Terminal  Market, 2016-2026 (K Units)
        FIG. 70 BrazilPOS Terminal Market, 2016-2026
        FIG. 71 BrazilPOS Terminal  Market, 2016-2026 (K Units)
        FIG. 72 MexicoPOS Terminal Market, 2016-2026
        FIG. 73 MexicoPOS Terminal  Market, 2016-2026 (K Units)
        FIG. 74 Rest of Latin AmericaPOS Terminal Market, 2016-2026
        FIG. 75 Rest of Latin AmericaPOS Terminal  Market, 2016-2026 (K Units)
        FIG. 76 The Middle-East and AfricaPOS Terminal Market, 2016-2026
        FIG. 77 The Middle-East and AfricaPOS Terminal  Market, 2016-2026 (K Units)
        FIG. 78 GCC CountriesPOS Terminal Market, 2016-2026
        FIG. 79 GCC CountriesPOS Terminal  Market, 2016-2026 (K Units)
        FIG. 80 South AfricaPOS Terminal Market, 2016-2026
        FIG. 81 South AfricaPOS Terminal  Market, 2016-2026 (K Units)
        FIG. 82 Rest of Middle-East AfricaPOS Terminal Market, 2016-2026
        FIG. 83 Rest of Middle-East AfricaPOS Terminal  Market, 2016-2026 (K Units)
        FIG. 84 Global POS Terminal production and revenue, 2016-2026 (USD Billion) (K Units)
        FIG. 85 North AmericaPOS Terminal production and revenue, 2016-2026 (USD Billion) (K Units)
        FIG. 86 EuropePOS Terminal production and revenue, 2016-2026 (USD Billion) (K Units)
        FIG. 87 Asia Pacific POS Terminal production and revenue, 2016-2026 (USD Billion) (K Units)
        FIG. 88 Latin America POS Terminal production and revenue, 2016-2026 (USD Billion) (K Units)
        FIG. 89 Middle East and Africa POS Terminal production and revenue, 2016-2026 (USD Billion) (K Units)
        FIG. 90 Competitor Market Share – Revenue
        FIG. 91 Competitor Market Share – Volume
        FIG. 92 Panasonic Corporation Revenue and Growth Rate
        FIG. 93 Panasonic Corporation Market Share
        FIG. 94 PAX Technology Limited Revenue and Growth Rate
        FIG. 95 PAX Technology Limited Market Share
        FIG. 96 Toshiba Corporation Revenue and Growth Rate
        FIG. 97 Toshiba Corporation Market Share
        FIG. 98 Ingenico S.A. Revenue and Growth Rate
        FIG. 99 Ingenico S.A. Market Share
        FIG. 100 VeriFone Systems Inc. Revenue and Growth Rate
        FIG. 101 VeriFone Systems Inc. Market Share
        FIG. 102 NEC Corporation Revenue and Growth Rate
        FIG. 103 NEC Corporation Market Share
        FIG. 104 Cisco Systems Inc. Revenue and Growth Rate
        FIG. 105 Cisco Systems Inc. Market Share
        FIG. 106 Hewlett-Packard Company Revenue and Growth Rate
        FIG. 107 Hewlett-Packard Company Market Share
        FIG. 108 MICROS Systems Inc. Revenue and Growth Rate
        FIG. 109 MICROS Systems Inc. Market Share
        FIG. 110 Samsung Electronics Co. Revenue and Growth Rate
        FIG. 111 Samsung Electronics Co. Market Share
        FIG. 112 Ltd. Revenue and Growth Rate
        FIG. 113 Ltd. Market Share
        FIG. 114 Market Dynamics
        FIG. 115 Global POS Terminal – Value Chain Analysis
        FIG. 116 Key Mandates and Regulations
        FIG. 117 Technology Roadmap and Timeline
        FIG. 118 Market Attractiveness Analysis – By Type
        FIG. 119 Market Attractiveness Analysis – By Deployment
        FIG. 120 Market Attractiveness Analysis – By Component
        FIG. 121 Market Attractiveness Analysis – By Application
        FIG. 122 Market Attractiveness Analysis – By Region
        FIG. 123 Manufacturing Cost Structure of POS Terminal
        FIG. 124 POS Terminal Industrial Chain Analysis
        FIG. 125 Market Channel
        FIG. 126 Marketing Channel Development Trend
        FIG. 127 Growth in World Gross Product, 2008-2019

        List of Tables

        TABLE 1 Global POS Terminal market, 2019& 2026 (USD Billion)
        TABLE 2 Global POS Terminal market, by Type, 2016-2026 (USD Billion)
        TABLE 3 Global POS Terminal market, by Type, 2016-2026 (K Units)
        TABLE 4 Global POS Terminal market, by Deployment, 2016-2026 (USD Billion)
        TABLE 5 Global POS Terminal market, by Deployment, 2016-2026 (K Units)
        TABLE 6 Global POS Terminal market, by Component, 2016-2026 (USD Billion)
        TABLE 7 Global POS Terminal market, by Component, 2016-2026 (K Units)
        TABLE 8 Global POS Terminal market, by Application, 2016-2026 (USD Billion)
        TABLE 9 Global POS Terminal market, by Application, 2016-2026 (K Units)
        TABLE 10 Global POS Terminal market, by region, 2016-2026 (USD Billion)
        TABLE 11 Global POS Terminal market, by region, 2016-2026 (K Units)
        TABLE 12 North AmericaPOS Terminal Market, by Type, 2016-2026 (USD Billion)
        TABLE 13 North AmericaPOS Terminal Market, by Type, 2016-2026 (K Units)
        TABLE 14 North AmericaPOS Terminal Market, by Deployment, 2016-2026 (USD Billion)
        TABLE 15 North AmericaPOS Terminal Market, by Deployment, 2016-2026 (K Units)
        TABLE 16 North AmericaPOS Terminal Market, by Component, 2016-2026 (USD Billion)
        TABLE 17 North AmericaPOS Terminal Market, by Component, 2016-2026 (K Units)
        TABLE 18 North AmericaPOS Terminal Market, by Application, 2016-2026 (USD Billion)
        TABLE 19 North AmericaPOS Terminal Market, by Application, 2016-2026 (K Units)
        TABLE 20 EuropePOS Terminal Market, by Type, 2016-2026 (USD Billion)
        TABLE 21 EuropePOS Terminal Market, by Type, 2016-2026 (K Units)
        TABLE 22 EuropePOS Terminal Market, by Deployment, 2016-2026 (USD Billion)
        TABLE 23 EuropePOS Terminal Market, by Deployment, 2016-2026 (K Units)
        TABLE 24 EuropePOS Terminal Market, by Component, 2016-2026 (USD Billion)
        TABLE 25 EuropePOS Terminal Market, by Component, 2016-2026 (K Units)
        TABLE 26 EuropePOS Terminal Market, by Application, 2016-2026 (USD Billion)
        TABLE 27 EuropePOS Terminal Market, by Application, 2016-2026 (K Units)
        TABLE 28 Asia PacificPOS Terminal Market, by Type, 2016-2026 (USD Billion)
        TABLE 29 Asia PacificPOS Terminal Market, by Type, 2016-2026 (K Units)
        TABLE 30 Asia PacificPOS Terminal Market, by Deployment, 2016-2026 (USD Billion)
        TABLE 31 Asia PacificPOS Terminal Market, by Deployment, 2016-2026 (K Units)
        TABLE 32 Asia PacificPOS Terminal Market, by Component, 2016-2026 (USD Billion)
        TABLE 33 Asia PacificPOS Terminal Market, by Component, 2016-2026 (K Units)
        TABLE 34 Asia PacificPOS Terminal Market, by Application, 2016-2026 (USD Billion)
        TABLE 35 Asia PacificPOS Terminal Market, by Application, 2016-2026 (K Units)
        TABLE 36 Latin AmericaPOS Terminal Market, by Type, 2016-2026 (USD Billion)
        TABLE 37 Latin AmericaPOS Terminal Market, by Type, 2016-2026 (K Units)
        TABLE 38 Latin AmericaPOS Terminal Market, by Deployment, 2016-2026 (USD Billion)
        TABLE 39 Latin AmericaPOS Terminal Market, by Deployment, 2016-2026 (K Units)
        TABLE 40 Latin AmericaPOS Terminal Market, by Component, 2016-2026 (USD Billion)
        TABLE 41 Latin AmericaPOS Terminal Market, by Component, 2016-2026 (K Units)
        TABLE 42 Latin AmericaPOS Terminal Market, by Application, 2016-2026 (USD Billion)
        TABLE 43 Latin AmericaPOS Terminal Market, by Application, 2016-2026 (K Units)
        TABLE 44 The Middle-East and AfricaPOS Terminal Market, by Type, 2016-2026 (USD Billion)
        TABLE 45 The Middle-East and AfricaPOS Terminal Market, by Type, 2016-2026 (K Units)
        TABLE 46 The Middle-East and AfricaPOS Terminal Market, by Deployment, 2016-2026 (USD Billion)
        TABLE 47 The Middle-East and AfricaPOS Terminal Market, by Deployment, 2016-2026 (K Units)
        TABLE 48 The Middle-East and AfricaPOS Terminal Market, by Component, 2016-2026 (USD Billion)
        TABLE 49 The Middle-East and AfricaPOS Terminal Market, by Component, 2016-2026 (K Units)
        TABLE 50 The Middle-East and AfricaPOS Terminal Market, by Application, 2016-2026 (USD Billion)
        TABLE 51 The Middle-East and AfricaPOS Terminal Market, by Application, 2016-2026 (K Units)
        TABLE 52 North America POS TerminalProduction, Consumption, Export, Import, 2016-2019
        TABLE 53 Europe POS TerminalProduction, Consumption, Export, Import, 2016-2019
        TABLE 54 Asia Pacific POS TerminalProduction, Consumption, Export, Import, 2016-2019
        TABLE 55 Latin America POS TerminalProduction, Consumption, Export, Import, 2016-2019
        TABLE 56 Middle East & Africa POS TerminalProduction, Consumption, Export, Import, 2016-2019
        TABLE 57 Global POS Terminal Market - Company Revenue Analysis 2016-2019 (USD Billion)
        TABLE 58 Global POS Terminal Market - Company Revenue Share Analysis 2016-2019(%)
        TABLE 59 Global POS Terminal Market - Company Volume Analysis 2016-2019 (K Units)
        TABLE 60 Global POS Terminal Market - Company Volume Share Analysis 2016-2019(%)
        TABLE 61 Acquisitions and Mergers
        TABLE 62 New Product/Service Launch
        TABLE 63 Research & Development Activities
        TABLE 64 Market Drivers
        TABLE 65 Market Restraints
        TABLE 66 Market Opportunities
        TABLE 67 Production Base and Market Concentration Rate of Raw Material
        TABLE 68 Key Suppliers of Raw Materials
        TABLE 69 Raw Materials Sources of POS Terminal Major Manufacturers in 2016
        TABLE 70 Major Buyers of POS Terminal
        TABLE 71 Distributors/Traders of POS Terminal by Region

Industry Major Market Players

  • Panasonic Corporation
  • PAX Technology Limited
  • Toshiba Corporation
  • Ingenico S.A.
  • VeriFone Systems Inc.
  • NEC Corporation
  • Cisco Systems Inc.
  • Hewlett-Packard Company
  • MICROS Systems Inc.
  • Samsung Electronics Co. Ltd.