Search Market Research Report

Discover Our Latest Reports
Discover Our Featured Reports
Discover Top Selling Reports

Port Equipment Market Size, Share Global Analysis Report, 2021 – 2026

report img

Port Equipment Market By Application (Container Handling, Bulk Handling, Ship Handling, & Others), By Equipment Type (Tugboats, Cranes, Mooring System, Ship Loaders, Reach Stackers, Automated Guide Vehicles, Container Lift Trucks, Terminal Tractors, Straddle Carriers, & Others), By Type (Diesel, Electric, & Hybrid), And By Regions - Global & Regional Industry Perspective, Comprehensive Analysis, and Forecast 2021 – 2026

Industry Insights

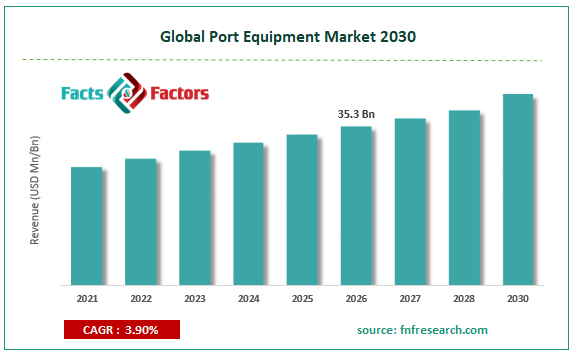
[197+ Pages Report] Facts & Factors recently published the latest finding surrounding the Global Port Equipment Market. In the current study, the global port equipment market surrounding port equipment is expected to reach a projected value of USD 35.3 Billion in the year 2026 with a growth rate of 3.9% CAGR from an initial value of USD 30.2 Billion in the year 2020.

Global Port Equipment Market Size

To know more about this report | Request Free Sample Copy

logoMarket Overview

Port equipment is the set of physical infrastructure that aid in assisting a litany of tasks in a maritime facility that compromises of one or more loading areas and discharges cargo and passengers. These locations are often on a seacoast or estuary and can be further found inland in some regions. The primary purpose of port equipment is to provide a rapid and accessible point of entry between ships and land-based models for the purpose of the transfer.

logoIndustry Growth Factors

The contributing factors for the global port equipment market during the forecast period can be attributed to the rising number of container shipments across the global overview coupled with the rising number of vessel count and trade volume to name a few. Additionally, the rising focus of emerging economies on developing new ports coupled with increasing trading routes for heavy and bulk goods is expected to increase the footprint of the global port equipment market during the forecast period. Moreover, factors pertaining to large cargo space availability, economical and safety-based measures are expected to boost the global port equipment market during the forecast period.

The global port equipment market is expected to be driven by factors contributing to rising investment measures by the private and public sectors coupled with the integration of smart solutions such as optimized operations reduced logistics costs and rising efficiency measures to name a few. However, the advent of COVID-19 is expected to hamper the growth of the global port equipment market during the advent of the forecast.

logoSegmentation Analysis

The global port equipment market is segmented into application, equipment type, type, and region.

The global port equipment market is divided into container handling, bulk handling, ship handling, and others on the basis of application. The segment pertaining to container handling is expected to witness the largest market share during the advent of the forecast owing to increased functionality in terms of stacking, bulk handling, scrap handling, heavy lifting, and general cargo loading and unloading to name a few. The global port equipment market is categorized into tugboats, cranes, mooring systems, ship loaders, reach stackers, automated guide vehicles, container lift trucks, terminal tractors, straddle carriers, and others on the basis of equipment type. The crane's category is expected to witness the largest market share during the advent of the forecast owing to decreasing the cost per move coupled with the rising number of superior efficiency and rising number of harbors to name a few. On the basis of type, the global port equipment market is classified into diesel, electric, and hybrid. The diesel category is expected to witness the largest market share during the advent of the forecast owing to larger fuel efficiency, power, performance, and reliability.

logo Report Scope

Report Attribute

Details

Market Size in 2020

USD 30.2 Billion

Projected Market Size in 2026

USD 35.3 Billion

CAGR Growth Rate

3.9% CAGR

Base Year

2020

Forecast Years

2021-2026

Key Market Players

Liebherr, TTS, Kalmar, Konecranes, Sany, Shanghai Zhenhua Heavy Industries, Hyster, Lonking, CVS Ferrari, Anhui Heli, Famur Famak, American Crane & Equipment, ABB, and SANMAR, among others.

Key Segments

Applications, Equipment Types, Types, and Region

Major Regions Covered

North America, Europe, Asia Pacific, Latin America, and Middle East & Africa

Purchase Options

Request customized purchase options to meet your research needs. Explore purchase options

logo Regional Analysis

North America is expected to witness the largest market share during the advent of the forecast owing to the rising number of products by the key market participants in the region coupled with the development of advanced technologies to name a few. The region of Europe is expected to occupy a substantial amount of market share during the advent of the forecast owing to a healthier economy coupled with penetration of international players towards the region to name a few. The region of Asia-Pacific is expected to witness the fastest growing CAGR market share during the advent of the forecast owing to the rising number of port equipment being launched in the region and increasing demand of greenfield-based projects to name a few.

logo Competitive Players

The key market participants in the global port equipment market are:

  • Liebherr
  • TTS
  • Kalmar
  • Konecranes
  • Sany
  • Shanghai Zhenhua Heavy Industries
  • Hyster
  • Lonking
  • CVS Ferrari
  • Anhui Heli
  • Famur Famak
  • American Crane & Equipment
  • ABB
  • SANMAR

logo By Application Segment Analysis

  • Container Handling
  • Bulk Handling
  • Ship Handling
  • Others

logo By Equipment Type Segment Analysis

  • Tugboats
  • Cranes
  • Mooring System
  • Ship Loaders
  • Reach Stackers
  • Automated Guide Vehicles
  • Container Lift Trucks
  • Terminal Tractors
  • Straddle Carriers
  • Others

logo By Type Segment Analysis

  • Diesel
  • Electric
  • Hybrid

Table of Content

  1. Chapter 1 Executive Summary
    1. 1.1. Introduction of Port Equipment
    2. 1.2. Global Port Equipment Market, 2019 & 2026 (USD Billion)
    3. 1.3. Global Port Equipment Market, 2016 – 2026 (USD Billion)
    4. 1.4. Global Port Equipment Market Absolute Revenue Opportunity, 2016 – 2026 (USD Billion)
    5. 1.5. Global Port Equipment Market Incremental Revenue Opportunity, 2020 – 2026 (USD Billion)
  2. Chapter 2 Port Equipment Market – Application Analysis
    1. 2.1. Global Port Equipment Market – Application Overview
    2. 2.2. Global Port Equipment Market Share, by Application, 2019 & 2026 (USD Billion)
    3. 2.3. Container Handling
      1. 2.3.1. Global Container Handling Port Equipment Market, 2016 – 2026 (USD Billion)
    4. 2.4. Bulk Handling
      1. 2.4.1. Global Bulk Handling Port Equipment Market, 2016 – 2026 (USD Billion)
    5. 2.5. Ship Handling
      1. 2.5.1. Global Ship Handling Port Equipment Market, 2016 – 2026 (USD Billion)
    6. 2.6. Others
      1. 2.6.1. Global Others Port Equipment Market, 2016 – 2026 (USD Billion)
  3. Chapter 3 Port Equipment Market – Equipment Type Analysis
    1. 3.1. Global Port Equipment Market – Equipment Type Overview
    2. 3.2. Global Port Equipment Market Share, by Equipment Type, 2019 & 2026 (USD Billion)
    3. 3.3. Tugboats
      1. 3.3.1. Global Tugboats Port Equipment Market, 2016 – 2026 (USD Billion)
    4. 3.4. Cranes
      1. 3.4.1. Global Cranes Port Equipment Market, 2016 – 2026 (USD Billion)
    5. 3.5. Mooring System
      1. 3.5.1. Global Mooring System Port Equipment Market, 2016 – 2026 (USD Billion)
    6. 3.6. Ship Loaders
      1. 3.6.1. Global Ship Loaders Port Equipment Market, 2016 – 2026 (USD Billion)
    7. 3.7. Reach Stackers
      1. 3.7.1. Global Reach Stackers Port Equipment Market, 2016 – 2026 (USD Billion)
    8. 3.8. Automated Guide Vehicles
      1. 3.8.1. Global Automated Guide Vehicles Port Equipment Market, 2016 – 2026 (USD Billion)
    9. 3.9. Container Lift Trucks
      1. 3.9.1. Global Container Lift Trucks Port Equipment Market, 2016 – 2026 (USD Billion)
    10. 3.10. Terminal Tractors
      1. 3.10.1. Global Terminal Tractors Port Equipment Market, 2016 – 2026 (USD Billion)
    11. 3.11. Straddle Carriers
      1. 3.11.1. Global Straddle Carriers Port Equipment Market, 2016 – 2026 (USD Billion)
    12. 3.12. Others
      1. 3.12.1. Global Others Port Equipment Market, 2016 – 2026 (USD Billion)
  4. Chapter 4 Port Equipment Market – Type Analysis
    1. 4.1. Global Port Equipment Market – Type Overview
    2. 4.2. Global Port Equipment Market Share, by Type, 2019 & 2026 (USD Billion)
    3. 4.3. Diesel
      1. 4.3.1. Global Diesel Port Equipment Market, 2016 – 2026 (USD Billion)
    4. 4.4. Electric
      1. 4.4.1. Global Electric Port Equipment Market, 2016 – 2026 (USD Billion)
    5. 4.5. Hybrid
      1. 4.5.1. Global Hybrid Port Equipment Market, 2016 – 2026 (USD Billion)
  5. Chapter 5 Port Equipment Market – Regional Analysis
    1. 5.1. Global Port Equipment Market Regional Overview
    2. 5.2. Global Port Equipment Market Share, by Region, 2019 & 2026 (USD Billion)
    3. 5.3. North America
      1. 5.3.1. North America Port Equipment Market, 2016 – 2026 (USD Billion)
        1. 5.3.1.1. North America Port Equipment Market, by Country, 2016 - 2026 (USD Billion)
      2. 5.3.2. North America Port Equipment Market, by Application, 2016 – 2026
        1. 5.3.2.1. North America Port Equipment Market, by Application, 2016 – 2026 (USD Billion)
      3. 5.3.3. North America Port Equipment Market, by Equipment Type, 2016 – 2026
        1. 5.3.3.1. North America Port Equipment Market, by Equipment Type, 2016 – 2026 (USD Billion)
      4. 5.3.4. North America Port Equipment Market, by Type, 2016 – 2026
        1. 5.3.4.1. North America Port Equipment Market, by Type, 2016 – 2026 (USD Billion)
      5. 5.3.5. U.S.
        1. 5.3.5.1. U.S. Port Equipment Market, 2016 – 2026 (USD Billion)
      6. 5.3.6. Canada
        1. 5.3.6.1. Canada Port Equipment Market, 2016 – 2026 (USD Billion)
    4. 5.4. Europe
      1. 5.4.1. Europe Port Equipment Market, 2016 – 2026 (USD Billion)
        1. 5.4.1.1. Europe Port Equipment Market, by Country, 2016 - 2026 (USD Billion)
      2. 5.4.2. Europe Port Equipment Market, by Application, 2016 – 2026
        1. 5.4.2.1. Europe Port Equipment Market, by Application, 2016 – 2026 (USD Billion)
      3. 5.4.3. Europe Port Equipment Market, by Equipment Type, 2016 – 2026
        1. 5.4.3.1. Europe Port Equipment Market, by Equipment Type, 2016 – 2026 (USD Billion)
      4. 5.4.4. Europe Port Equipment Market, by Type, 2016 – 2026
        1. 5.4.4.1. Europe Port Equipment Market, by Type, 2016 – 2026 (USD Billion)
      5. 5.4.5. Germany
        1. 5.4.5.1. Germany Port Equipment Market, 2016 – 2026 (USD Billion)
      6. 5.4.6. France
        1. 5.4.6.1. France Port Equipment Market, 2016 – 2026 (USD Billion)
      7. 5.4.7. U.K.
        1. 5.4.7.1. U.K. Port Equipment Market, 2016 – 2026 (USD Billion)
      8. 5.4.8. Italy
        1. 5.4.8.1. Italy Port Equipment Market, 2016 – 2026 (USD Billion)
      9. 5.4.9. Spain
        1. 5.4.9.1. Spain Port Equipment Market, 2016 – 2026 (USD Billion)
      10. 5.4.10. Rest of Europe
        1. 5.4.10.1. Rest of Europe Port Equipment Market, 2016 – 2026 (USD Billion)
    5. 5.5. Asia Pacific
      1. 5.5.1. Asia Pacific Port Equipment Market, 2016 – 2026 (USD Billion)
        1. 5.5.1.1. Asia Pacific Port Equipment Market, by Country, 2016 - 2026 (USD Billion)
      2. 5.5.2. Asia Pacific Port Equipment Market, by Application, 2016 – 2026
        1. 5.5.2.1. Asia Pacific Port Equipment Market, by Application, 2016 – 2026 (USD Billion)
      3. 5.5.3. Asia Pacific Port Equipment Market, by Equipment Type, 2016 – 2026
        1. 5.5.3.1. Asia Pacific Port Equipment Market, by Equipment Type, 2016 – 2026 (USD Billion)
      4. 5.5.4. Asia Pacific Port Equipment Market, by Type, 2016 – 2026
        1. 5.5.4.1. Asia Pacific Port Equipment Market, by Type, 2016 – 2026 (USD Billion)
      5. 5.5.5. China
        1. 5.5.5.1. China Port Equipment Market, 2016 – 2026 (USD Billion)
      6. 5.5.6. Japan
        1. 5.5.6.1. Japan Port Equipment Market, 2016 – 2026 (USD Billion)
      7. 5.5.7. India
        1. 5.5.7.1. India Port Equipment Market, 2016 – 2026 (USD Billion)
      8. 5.5.8. South Korea
        1. 5.5.8.1. South Korea Port Equipment Market, 2016 – 2026 (USD Billion)
      9. 5.5.9. South-East Asia
        1. 5.5.9.1. South-East Asia Port Equipment Market, 2016 – 2026 (USD Billion)
      10. 5.5.10. Rest of Asia Pacific
        1. 5.5.10.1. Rest of Asia Pacific Port Equipment Market, 2016 – 2026 (USD Billion)
    6. 5.6. Latin America
      1. 5.6.1. Latin America Port Equipment Market, 2016 – 2026 (USD Billion)
        1. 5.6.1.1. Latin America Port Equipment Market, by Country, 2016 - 2026 (USD Billion)
      2. 5.6.2. Latin America Port Equipment Market, by Application, 2016 – 2026
        1. 5.6.2.1. Latin America Port Equipment Market, by Application, 2016 – 2026 (USD Billion)
      3. 5.6.3. Latin America Port Equipment Market, by Equipment Type, 2016 – 2026
        1. 5.6.3.1. Latin America Port Equipment Market, by Equipment Type, 2016 – 2026 (USD Billion)
      4. 5.6.4. Latin America Port Equipment Market, by Type, 2016 – 2026
        1. 5.6.4.1. Latin America Port Equipment Market, by Type, 2016 – 2026 (USD Billion)
      5. 5.6.5. Brazil
        1. 5.6.5.1. Brazil Port Equipment Market, 2016 – 2026 (USD Billion)
      6. 5.6.6. Mexico
        1. 5.6.6.1. Mexico Port Equipment Market, 2016 – 2026 (USD Billion)
      7. 5.6.7. Rest of Latin America
        1. 5.6.7.1. Rest of Latin America Port Equipment Market, 2016 – 2026 (USD Billion)
    7. 5.7. The Middle-East and Africa
      1. 5.7.1. The Middle-East and Africa Port Equipment Market, 2016 – 2026 (USD Billion)
        1. 5.7.1.1. The Middle-East and Africa Port Equipment Market, by Country, 2016 - 2026 (USD Billion)
      2. 5.7.2. The Middle-East and Africa Port Equipment Market, by Application, 2016 – 2026
        1. 5.7.2.1. The Middle-East and Africa Port Equipment Market, by Application, 2016 – 2026 (USD Billion)
      3. 5.7.3. The Middle-East and Africa Port Equipment Market, by Equipment Type, 2016 – 2026
        1. 5.7.3.1. The Middle-East and Africa Port Equipment Market, by Equipment Type, 2016 – 2026 (USD Billion)
      4. 5.7.4. The Middle-East and Africa Port Equipment Market, by Type, 2016 – 2026
        1. 5.7.4.1. The Middle-East and Africa Port Equipment Market, by Type, 2016 – 2026 (USD Billion)
      5. 5.7.5. GCC Countries
        1. 5.7.5.1. GCC Countries Port Equipment Market, 2016 – 2026 (USD Billion)
      6. 5.7.6. South Africa
        1. 5.7.6.1. South Africa Port Equipment Market, 2016 – 2026 (USD Billion)
      7. 5.7.7. Rest of Middle-East Africa
        1. 5.7.7.1. Rest of Middle-East Africa Port Equipment Market, 2016 – 2026 (USD Billion)
  6. Chapter 6 Port Equipment Market – Competitive Landscape
    1. 6.1. Competitor Market Share – Revenue
    2. 6.2. Market Concentration Rate Analysis, Top 3 and Top 5 Players
    3. 6.3. Strategic Developments
      1. 6.3.1. Acquisitions and Mergers
      2. 6.3.2. New Products
      3. 6.3.3. Research & Development Activities
  7. Chapter 7 Company Profiles
    1. 7.1. Liebherr
      1. 7.1.1. Company Overview
      2. 7.1.2. Product/Service Portfolio
      3. 7.1.3. Liebherr Sales, Revenue, and Gross Margin
      4. 7.1.4. Liebherr Revenue and Growth Rate
      5. 7.1.5. Liebherr Market Share
      6. 7.1.6. Recent Initiatives, Funding/VC Activities, and Technological Innovations
    2. 7.2. TTS
      1. 7.2.1. Company Overview
      2. 7.2.2. Product/Service Portfolio
      3. 7.2.3. TTS Sales, Revenue, and Gross Margin
      4. 7.2.4. TTS Revenue and Growth Rate
      5. 7.2.5. TTS Market Share
      6. 7.2.6. Recent Initiatives, Funding/VC Activities, and Technological Innovations
    3. 7.3. Kalmar
      1. 7.3.1. Company Overview
      2. 7.3.2. Product/Service Portfolio
      3. 7.3.3. Kalmar Sales, Revenue, and Gross Margin
      4. 7.3.4. Kalmar Revenue and Growth Rate
      5. 7.3.5. Kalmar Market Share
      6. 7.3.6. Recent Initiatives, Funding/VC Activities, and Technological Innovations
    4. 7.4. Konecranes
      1. 7.4.1. Company Overview
      2. 7.4.2. Product/Service Portfolio
      3. 7.4.3. Konecranes Sales, Revenue, and Gross Margin
      4. 7.4.4. Konecranes Revenue and Growth Rate
      5. 7.4.5. Konecranes Market Share
      6. 7.4.6. Recent Initiatives, Funding/VC Activities, and Technological Innovations
    5. 7.5. Sany
      1. 7.5.1. Company Overview
      2. 7.5.2. Product/Service Portfolio
      3. 7.5.3. Sany Sales, Revenue, and Gross Margin
      4. 7.5.4. Sany Revenue and Growth Rate
      5. 7.5.5. Sany Market Share
      6. 7.5.6. Recent Initiatives, Funding/VC Activities, and Technological Innovations
    6. 7.6. Shanghai Zhenhua Heavy Industries
      1. 7.6.1. Company Overview
      2. 7.6.2. Product/Service Portfolio
      3. 7.6.3. Shanghai Zhenhua Heavy Industries Sales, Revenue, and Gross Margin
      4. 7.6.4. Shanghai Zhenhua Heavy Industries Revenue and Growth Rate
      5. 7.6.5. Shanghai Zhenhua Heavy Industries Market Share
      6. 7.6.6. Recent Initiatives, Funding/VC Activities, and Technological Innovations
    7. 7.7. Hyster
      1. 7.7.1. Company Overview
      2. 7.7.2. Product/Service Portfolio
      3. 7.7.3. Hyster Sales, Revenue, and Gross Margin
      4. 7.7.4. Hyster Revenue and Growth Rate
      5. 7.7.5. Hyster Market Share
      6. 7.7.6. Recent Initiatives, Funding/VC Activities, and Technological Innovations
    8. 7.8. Lonking
      1. 7.8.1. Company Overview
      2. 7.8.2. Product/Service Portfolio
      3. 7.8.3. Lonking Sales, Revenue, and Gross Margin
      4. 7.8.4. Lonking Revenue and Growth Rate
      5. 7.8.5. Lonking Market Share
      6. 7.8.6. Recent Initiatives, Funding/VC Activities, and Technological Innovations
    9. 7.9. CVS Ferrari
      1. 7.9.1. Company Overview
      2. 7.9.2. Product/Service Portfolio
      3. 7.9.3. CVS Ferrari Sales, Revenue, and Gross Margin
      4. 7.9.4. CVS Ferrari Revenue and Growth Rate
      5. 7.9.5. CVS Ferrari Market Share
      6. 7.9.6. Recent Initiatives, Funding/VC Activities, and Technological Innovations
    10. 7.10. Anhui Heli
      1. 7.10.1. Company Overview
      2. 7.10.2. Product/Service Portfolio
      3. 7.10.3. Anhui Heli Sales, Revenue, and Gross Margin
      4. 7.10.4. Anhui Heli Revenue and Growth Rate
      5. 7.10.5. Anhui Heli Market Share
      6. 7.10.6. Recent Initiatives, Funding/VC Activities, and Technological Innovations
    11. 7.11. Famur Famak
      1. 7.11.1. Company Overview
      2. 7.11.2. Product/Service Portfolio
      3. 7.11.3. Famur Famak Sales, Revenue, and Gross Margin
      4. 7.11.4. Famur Famak Revenue and Growth Rate
      5. 7.11.5. Famur Famak Market Share
      6. 7.11.6. Recent Initiatives, Funding/VC Activities, and Technological Innovations
    12. 7.12. American Crane & Equipment
      1. 7.12.1. Company Overview
      2. 7.12.2. Product/Service Portfolio
      3. 7.12.3. American Crane & Equipment Sales, Revenue, and Gross Margin
      4. 7.12.4. American Crane & Equipment Revenue and Growth Rate
      5. 7.12.5. American Crane & Equipment Market Share
      6. 7.12.6. Recent Initiatives, Funding/VC Activities, and Technological Innovations
    13. 7.13. ABB
      1. 7.13.1. Company Overview
      2. 7.13.2. Product/Service Portfolio
      3. 7.13.3. ABB Sales, Revenue, and Gross Margin
      4. 7.13.4. ABB Revenue and Growth Rate
      5. 7.13.5. ABB Market Share
      6. 7.13.6. Recent Initiatives, Funding/VC Activities, and Technological Innovations
    14. 7.14. SANMAR
      1. 7.14.1. Company Overview
      2. 7.14.2. Product/Service Portfolio
      3. 7.14.3. SANMAR Sales, Revenue, and Gross Margin
      4. 7.14.4. SANMAR Revenue and Growth Rate
      5. 7.14.5. SANMAR Market Share
      6. 7.14.6. Recent Initiatives, Funding/VC Activities, and Technological Innovations
  8. Chapter 8 Port Equipment — Industry Analysis
    1. 8.1. Introduction and Taxonomy
    2. 8.2. Port Equipment Market – Key Trends
      1. 8.2.1. Market Drivers
      2. 8.2.2. Market Restraints
      3. 8.2.3. Market Opportunities
    3. 8.3. Value Chain Analysis
    4. 8.4. Key Mandates and Regulations
    5. 8.5. Technology Roadmap and Timeline
    6. 8.6. Port Equipment Market – Attractiveness Analysis
      1. 8.6.1. By Application
      2. 8.6.2. By Equipment Type
      3. 8.6.3. By Type
      4. 8.6.4. By Region
  9. Chapter 9 Industrial Chain, Sourcing Strategy, and Downstream Buyers
    1. 9.1. Port Equipment Industrial Chain Analysis
    2. 9.2. Downstream Buyers
    3. 9.3. Distributors/Traders List
  10. Chapter 10 Marketing Strategy Analysis
    1. 10.1. Marketing Channel
    2. 10.2. Direct Marketing
    3. 10.3. Indirect Marketing
    4. 10.4. Marketing Channel Development Trends
    5. 10.5. Economic/Political Environmental Change
  11. Chapter 11 Report Conclusion & Key Insights
    1. 11.1. Key Insights from Primary Interviews & Surveys Respondents
    2. 11.2. Key Takeaways from Analysts, Consultants, and Industry Leaders
  12. Chapter 12 Research Approach & Methodology
    1. 12.1. Report Description
    2. 12.2. Research Scope
    3. 12.3. Research Methodology
      1. 12.3.1. Secondary Research
      2. 12.3.2. Primary Research
      3. 12.3.3. Statistical Models
        1. 12.3.3.1. Company Share Analysis Model
        2. 12.3.3.2. Revenue Based Modeling
      4. 12.3.4. Research Limitations

      List of Figures

      Fig.1	Product Picture of Port Equipment
      Fig.2	Global Port Equipment Market, 2016 – 2026 (USD Billion)
      Fig.3	Global Port Equipment Market Absolute Revenue Opportunity, 2016 – 2026 (USD Billion)
      Fig.4	Global Port Equipment Market Incremental Revenue Opportunity, 2020 – 2026 (USD Billion)
      Fig.5	Global Port Equipment Market Share, by Application, 2019 & 2026 (USD Billion)
      Fig.6	Global Container Handling Port Equipment Market, 2016 – 2026 (USD Billion)
      Fig.7	Global Bulk Handling Port Equipment Market, 2016 – 2026 (USD Billion)
      Fig.8	Global Ship Handling  Port Equipment Market, 2016 – 2026 (USD Billion)
      Fig.9	Global Others Port Equipment Market, 2016 – 2026 (USD Billion)
      Fig.10	Global Port Equipment Market Share, by Equipment Type, 2019 & 2026 (USD Billion)
      Fig.11	Global Tugboats Port Equipment Market, 2016 – 2026 (USD Billion)
      Fig.12	Global Cranes Port Equipment Market, 2016 – 2026 (USD Billion)
      Fig.13	Global Mooring System Port Equipment Market, 2016 – 2026 (USD Billion)
      Fig.14	Global Ship Loaders Port Equipment Market, 2016 – 2026 (USD Billion)
      Fig.15	Global Reach Stackers Port Equipment Market, 2016 – 2026 (USD Billion)
      Fig.16	Global Automated Guide Vehicles Port Equipment Market, 2016 – 2026 (USD Billion)
      Fig.17	Global Container Lift Trucks  Port Equipment Market, 2016 – 2026 (USD Billion)
      Fig.18	Global Terminal Tractors Port Equipment Market, 2016 – 2026 (USD Billion)
      Fig.19	Global Straddle Carriers Port Equipment Market, 2016 – 2026 (USD Billion)
      Fig.20	Global Others Port Equipment Market, 2016 – 2026 (USD Billion)
      Fig.21	Global Port Equipment Market Share, by Type, 2019 & 2026 (USD Billion)
      Fig.22	Global Diesel  Port Equipment Market, 2016 – 2026 (USD Billion)
      Fig.23	Global Electric  Port Equipment Market, 2016 – 2026 (USD Billion)
      Fig.24	Global Hybrid Port Equipment Market, 2016 – 2026 (USD Billion)
      Fig.25	Global Port Equipment Market Share, by Region, 2019 & 2026 (USD Billion)
      Fig.26	North America Port Equipment Market, 2016 – 2026 (USD Billion)
      Fig.27	U.S. Port Equipment Market, 2016 – 2026 (USD Billion)
      Fig.28	Canada Port Equipment Market, 2016 – 2026 (USD Billion)
      Fig.29	Europe Port Equipment Market, 2016 – 2026 (USD Billion)
      Fig.30	Germany Port Equipment Market, 2016 – 2026 (USD Billion)
      Fig.31	France Port Equipment Market, 2016 – 2026 (USD Billion)
      Fig.32	U.K. Port Equipment Market, 2016 – 2026 (USD Billion)
      Fig.33	Italy Port Equipment Market, 2016 – 2026 (USD Billion)
      Fig.34	Spain Port Equipment Market, 2016 – 2026 (USD Billion)
      Fig.35	Rest of Europe Port Equipment Market, 2016 – 2026 (USD Billion)
      Fig.36	Asia Pacific Port Equipment Market, 2016 – 2026 (USD Billion)
      Fig.37	China Port Equipment Market, 2016 – 2026 (USD Billion)
      Fig.38	Japan Port Equipment Market, 2016 – 2026 (USD Billion)
      Fig.39	India Port Equipment Market, 2016 – 2026 (USD Billion)
      Fig.40	South  Korea Port Equipment Market, 2016 – 2026 (USD Billion)
      Fig.41	South-East Asia Port Equipment Market, 2016 – 2026 (USD Billion)
      Fig.42	Rest of Asia Pacific Port Equipment Market, 2016 – 2026 (USD Billion)
      Fig.43	Latin America Port Equipment Market, 2016 – 2026 (USD Billion)
      Fig.44	Brazil Port Equipment Market, 2016 – 2026 (USD Billion)
      Fig.45	Mexico Port Equipment Market, 2016 – 2026 (USD Billion)
      Fig.46	Rest of Latin America Port Equipment Market, 2016 – 2026 (USD Billion)
      Fig.47	The Middle-East and Africa Port Equipment Market, 2016 – 2026 (USD Billion)
      Fig.48	GCC Countries Port Equipment Market, 2016 – 2026 (USD Billion)
      Fig.49	South Africa Port Equipment Market, 2016 – 2026 (USD Billion)
      Fig.50	Rest of Middle-East Africa Port Equipment Market, 2016 – 2026 (USD Billion)
      Fig.51	Competitor Market Share – Revenue
      Fig.52	Liebherr Revenue and Growth Rate
      Fig.53	Liebherr Market Share
      Fig.54	TTS Revenue and Growth Rate
      Fig.55	TTS Market Share
      Fig.56	Kalmar Revenue and Growth Rate
      Fig.57	Kalmar Market Share
      Fig.58	Konecranes Revenue and Growth Rate
      Fig.59	Konecranes Market Share
      Fig.60	Sany Revenue and Growth Rate
      Fig.61	Sany Market Share
      Fig.62	Shanghai Zhenhua Heavy Industries Revenue and Growth Rate
      Fig.63	Shanghai Zhenhua Heavy Industries Market Share
      Fig.64	Hyster Revenue and Growth Rate
      Fig.65	Hyster Market Share
      Fig.66	Lonking Revenue and Growth Rate
      Fig.67	Lonking Market Share
      Fig.68	CVS Ferrari Revenue and Growth Rate
      Fig.69	CVS Ferrari Market Share
      Fig.70	Anhui Heli Revenue and Growth Rate
      Fig.71	Anhui Heli Market Share
      Fig.72	Famur Famak Revenue and Growth Rate
      Fig.73	Famur Famak Market Share
      Fig.74	American Crane & Equipment Revenue and Growth Rate
      Fig.75	American Crane & Equipment Market Share
      Fig.76	ABB Revenue and Growth Rate
      Fig.77	ABB Market Share
      Fig.78	SANMAR Revenue and Growth Rate
      Fig.79	SANMAR Market Share
      Fig.80	Market Dynamics
      Fig.81	Global Port Equipment – Value Chain Analysis
      Fig.82	Key Mandates and Regulations
      Fig.83	Technology Roadmap and Timeline
      Fig.84	Market Attractiveness Analysis – By Application
      Fig.85	Market Attractiveness Analysis – By Equipment Type
      Fig.86	Market Attractiveness Analysis – By Type
      Fig.87	Market Attractiveness Analysis – By Region
      Fig.88	Port Equipment Industrial Chain Analysis
      Fig.89	Market Channels
      Fig.90	Marketing Channel Development Trend
      Fig.91	Growth in World Gross Product, 2008-2018
      

      List of Tables

      Table 1	Global Port Equipment Market, 2019 & 2026 (USD Billion)
      Table 2	Global Port Equipment Market, by Application, 2016 – 2026 (USD Billion)
      Table 3	Global Port Equipment Market, by Equipment Type, 2016 – 2026 (USD Billion)
      Table 4	Global Port Equipment Market, by Type, 2016 – 2026 (USD Billion)
      Table 5	Global Port Equipment Market, by Region, 2016 – 2026 (USD Billion)
      Table 6	North America Port Equipment Market, by Country, 2016 – 2026 (USD Billion)
      Table 7	North America Port Equipment Market, by Application, 2016 – 2026 (USD Billion)
      Table 8	North America Port Equipment Market, by Equipment Type, 2016 – 2026 (USD Billion)
      Table 9	North America Port Equipment Market, by Type, 2016 – 2026 (USD Billion)
      Table 10 Europe Port Equipment Market, by Country, 2016 – 2026 (USD Billion)
      Table 11 Europe Port Equipment Market, by Application, 2016 – 2026 (USD Billion)
      Table 12 Europe Port Equipment Market, by Equipment Type, 2016 – 2026 (USD Billion)
      Table 13 Europe Port Equipment Market, by Type, 2016 – 2026 (USD Billion)
      Table 14 Asia Pacific Port Equipment Market, by Country, 2016 – 2026 (USD Billion)
      Table 15 Asia Pacific Port Equipment Market, by Application, 2016 – 2026 (USD Billion)
      Table 16 Asia Pacific Port Equipment Market, by Equipment Type, 2016 – 2026 (USD Billion)
      Table 17 Asia Pacific Port Equipment Market, by Type, 2016 – 2026 (USD Billion)
      Table 18 Latin America Port Equipment Market, by Country, 2016 – 2026 (USD Billion)
      Table 19 Latin America Port Equipment Market, by Application, 2016 – 2026 (USD Billion)
      Table 20 Latin America Port Equipment Market, by Equipment Type, 2016 – 2026 (USD Billion)
      Table 21 Latin America Port Equipment Market, by Type, 2016 – 2026 (USD Billion)
      Table 22 The Middle-East and Africa Port Equipment Market, by Country, 2016 – 2026 (USD Billion)
      Table 23 The Middle-East and Africa Port Equipment Market, by Application, 2016 – 2026 (USD Billion)
      Table 24 The Middle-East and Africa Port Equipment Market, by Equipment Type, 2016 – 2026 (USD Billion)
      Table 25 The Middle-East and Africa Port Equipment Market, by Type, 2016 – 2026 (USD Billion)
      Table 26 Global Port Equipment Market - Company Revenue Analysis, 2016 – 2019 (USD Billion)
      Table 27 Global Port Equipment Market - Company Revenue Share Analysis, 2016 – 2019 (%)
      Table 28 Acquisitions and Mergers
      Table 29 Market Drivers – Impact Analysis
      Table 30 Market Restraints
      Table 31 Market Opportunities
      Table 32 Major Buyers of Port Equipment
      Table 33 Distributors/Traders of Port Equipment by Region
      

Industry Major Market Players

  • Liebherr
  • TTS
  • Kalmar
  • Konecranes
  • Sany
  • Shanghai Zhenhua Heavy Industries
  • Hyster
  • Lonking
  • CVS Ferrari
  • Anhui Heli
  • Famur Famak
  • American Crane & Equipment
  • ABB
  • SANMAR