Search Market Research Report

Discover Our Latest Reports
Discover Our Featured Reports
Discover Top Selling Reports

Pneumatic Fenders Market Size, Share Global Analysis Report, 2020–2026

report img

Pneumatic Fenders Market By Type (Rubber Mat-Wire Net, Tire-Chain Net and Fiber Net); By Application (Ports, Ships, and Others): Global Industry Outlook, Market Size, Business Intelligence, Consumer Preferences, Statistical Surveys, Comprehensive Analysis, Historical Developments, Current Trends, and Forecast 2020–2026

Industry Insights

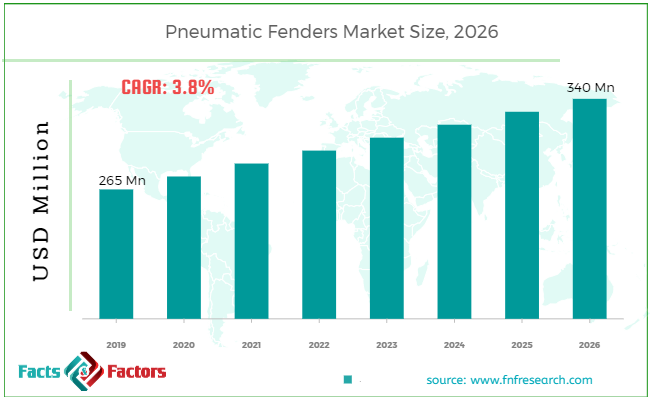
[197+ Pages Report] According to the report published by Facts Factors, the global pneumatic fenders market size was worth around USD 265.0 million in 2019 and is predicted to grow to around USD 340.63 million by 2026 with a compound annual growth rate (CAGR) of roughly 3.8% between 2020 and 2026. The report analyzes the global pneumatic fenders market drivers, restraints/challenges, and the effect they have on the demands during the projection period. In addition, the report explores emerging opportunities in the pneumatic fenders market.

Pneumatic Fenders Market Size

To know more about this report | Request Free Sample Copy

This specialized and expertise-oriented industry research report scrutinizes the technical and commercial business outlook of the pneumatic fenders industry. The report analyzes and declares the historical and current trends analysis of the pneumatic fenders industry and subsequently recommends the projected trends anticipated to be observed in the pneumatic fenders market in the upcoming years.

The pneumatic fenders market report analyzes and notifies the industry statistics at the global as well as regional and country levels in order to acquire a thorough perspective of the entire pneumatic fenders market. The historical and past insights are provided for FY 2016 to FY 2019 whereas projected trends are delivered for FY 2020 to FY 2026. The quantitative and numerical data is represented in terms of both volumes (Units) and value (USD Million) from FY 2016 – 2026.


logoKey Insights from Primary Research        

  • As per primary respondents, the global pneumatic fenders market is set to grow annually at a CAGR rate of 4.0%. In 2019, the market is valued at around USD 270.16 Million and is expected to reach at around USD 355.99 Million by 2026.
  • On basis of type segment, ‘tire-chain net’ dominated the global pneumatic fender market in 2019. The tire-chain net segment will grow at a CAGR rate of 4.3% over the forecast period.
  • On basis of the application segment, ‘ships’ dominated the global pneumatic fender market in 2019. This segment will be the fastest-growing segment in the next few years.
  • As per primary respondents, China is the leading market in 2019. It has accounted the USD 60.7 Million in 2019. It is due to the huge presence of a large number of pneumatic fenders that have led the market share in China region.
  • It was established through primary research, that increasing trade activities is accelerating the demand for pneumatic fenders.

logoKey Recommendations from Analysts

  • As per our analysts, the global pneumatic fenders market is expected to grow significantly over the forecast period.
  • As per analysts, the high cost associated with pneumatic fenders is anticipated to deter market growth during the forecast period.
  • As per our analysts, increasing trade activities across the globe are triggering the demand for pneumatic fenders. Moreover, the establishment of automated terminals will fuel the market growth over the projected years.
  • The strategic and competitive advantage provided by the globalization trend is estimated to drive this market globally.
  • Our research team has identified, that the Asia Pacific region registers highest CAGR over the projected years owing to rise in construction activities in this region.

The quantitative data is further underlined and reinforced by comprehensive qualitative data which comprises various across-the-board market dynamics. The rationales which directly or indirectly impact the pneumatic fenders industry are exemplified through parameters such as growth drivers, restraints, challenges, and opportunities among other impacting factors.

Throughout our research report, we have encompassed all the proven models and tools of industry analysis and extensively illustrated all the key business strategies and business models adopted in the pneumatic fenders industry. The report provides an all-inclusive and detailed competitive landscape prevalent in the pneumatic fenders market.

The report utilizes established industry analysis tools and models such as Porter’s Five Forces framework to analyze and recognize critical business strategies adopted by various stakeholders involved in the entire value chain of the pneumatic fenders industry. The pneumatic fenders market report additionally employs SWOT analysis and PESTLE analysis models for further in-depth analysis.

The report study further includes an in-depth analysis of industry players' market shares and provides an overview of leading players' market position in the pneumatic fenders sector. Key strategic developments in the pneumatic fenders market competitive landscape such as acquisitions & mergers, inaugurations of different products and services, partnerships & joint ventures, MoU agreements, VC & funding activities, R&D activities, and geographic expansion among other noteworthy activities by key players of the pneumatic fenders market are appropriately highlighted in the report.

Increasing trade operations owing to globalization is triggering the pneumatic fenders market growth in recent years. For instance, as per the survey, in 2018, the world's shipbuilding industry amounted to approximately USD 114.3 billion. The market is expected to reach USD 175 billion by 2025. This indicates that there will be a rise in shipbuilding products, which will boost the sales of the marine fender market over the forecast period. However, the high cost associated with a marine fender is estimated to deter the growth of the market.

Furthermore, massive investment initiatives taken by marine fender manufacturers in the Asia Pacific and Europe region are anticipated to propel the market growth. For instance, in 2019, Trelleborg, a Europe-based polymer solutions provider, and Cavotec SA automated connection and electrification system provider together installed automated mooring systems at Old City Harbour at Port of Tallinn in Estonia. Eckerö Line’s vessel and Tallink’s shuttle ships will be able to use the automated system. Thereby, certain factors are expected to fuel the pneumatic fenders market growth in the upcoming years.

The pneumatic fenders market research report delivers an acute valuation and taxonomy of the pneumatic fenders industry by practically splitting the market on the basis of different types, applications, and regions. Through the analysis of the historical and projected trends, all the segments and sub-segments were evaluated through the bottom-up approach, and different market sizes have been projected for FY 2020 to FY 2026.

logoReport Scope

Report Attribute

Details

Market Size in 2019

USD 265.0 Million

Projected Market Size in 2026

USD 340.63 Million

CAGR Growth Rate

3.8% CAGR

Base Year

2019

Forecast Years

2020-2026

Key Market Players

Trelleborg Marine and Infrastructure, PALFINGER AG, ShibataFenderTeam AG, THE YOKOHAMA RUBBER CO., LTD., Qingdao Jier Engineering Rubber Co., Ltd., Shandong Nanhai Airbag Engineering Co., Ltd, Qingdao Evergreen Maritime Co., Ltd, Qingdao Tiandun Rubber Co., Ltd, Sumitomo Rubber Industries, Ltd., ANCHOR MARINE & SUPPLY, INC., and IRM Offshore and Marine Engineers Pvt. Ltd., and Others

Key Segment

By Type, Application, Distribution, and Region

Major Regions Covered

North America, Europe, Asia Pacific, Latin America, and the Middle East & Africa

Purchase Options

Request customized purchase options to meet your research needs.Explore purchase options

The regional segmentation of the pneumatic fenders industry includes the complete classification of all the major continents including North America, Latin America, Europe, Asia Pacific, and the Middle East & Africa. Further, country-wise data for the pneumatic fenders industry is provided for the leading economies of the world.

The global pneumatic fenders market has been segmented into type and applications. The type has been segmented into rubber mat-wire net, tire-chain net, and fiber net. The application has been categorized into ports, ships, and others.

logoSome of the essential players operating in the global pneumatic fenders market, but not restricted to include

  • Trelleborg Marine and Infrastructure
  •  PALFINGER AG
  •  ShibataFenderTeam AG
  •  THE YOKOHAMA RUBBER CO. Ltd.
  •  Qingdao Jier Engineering Rubber Co. Ltd.
  •  Shandong Nanhai Airbag Engineering Co. Ltd
  •  Qingdao Evergreen Maritime Co. Ltd
  •  Qingdao Tiandun Rubber Co. Ltd
  •  Sumitomo Rubber Industries Ltd.
  •  ANCHOR MARINE & SUPPLY Inc.
  •  IRM Offshore and Marine Engineers Pvt. Ltd

The taxonomy of the pneumatic fenders industry by its scope and segmentation is as follows:

logo By Type Segmentation Analysis

  • Rubber Mat-Wire Net
  • Tire-Chain Net
  • Fiber Net

logo By Application Segmentation Analysis

  • Ports
  • Ships
  • Others

logoBy Regional Segmentation Analysis

  • North America
    • The U.S.
    • Canada
  • Europe
    • Germany
    • The UK
    • France
    • Spain
    • Italy
    • Rest of Europe
  • Asia Pacific
    • China
    • Japan
    • India
    • South Korea
    • Southeast Asia
    • Rest of Asia Pacific
  • Latin America
    • Brazil
    • Mexico
    • Rest of Latin America
  • Middle East & Africa
    • GCC
    • South Africa
    • Rest of Middle East & Africa

Table of Content

  1. Chapter 1 Executive Summary
    1. 1.1. Introduction of Pneumatic Fenders
    2. 1.2. Global Pneumatic Fenders Market, 2019 & 2026 (USD Million)
    3. 1.3. Global Pneumatic Fenders Market, 2016 – 2026 (USD Million) (Units)
    4. 1.4. Global Pneumatic Fenders Market Absolute Revenue Opportunity, 2016 – 2026 (USD Million)
    5. 1.5. Global Pneumatic Fenders Market Incremental Revenue Opportunity, 2020 – 2026 (USD Million)
  2. Chapter 2 Pneumatic Fenders Market – Type Analysis
    1. 2.1. Global Pneumatic Fenders Market – Type Overview
    2. 2.2. Global Pneumatic Fenders Market Share, by Type, 2019 & 2026 (USD Million)
    3. 2.3. Global Pneumatic Fenders Market share, by Type, 2019 & 2026 (Units)
    4. 2.4. Rubber Mat-Wire Net
      1. 2.4.1. Global Rubber Mat-Wire Net Pneumatic Fenders Market, 2016 – 2026 (USD Million)
      2. 2.4.2. Global Rubber Mat-Wire Net Pneumatic Fenders Market, 2016 – 2026 (Units)
    5. 2.5. Tire-Chain Net
      1. 2.5.1. Global Tire-Chain Net Pneumatic Fenders Market, 2016 – 2026 (USD Million)
      2. 2.5.2. Global Tire-Chain Net Pneumatic Fenders Market, 2016 – 2026 (Units)
    6. 2.6. Fiber Net
      1. 2.6.1. Global Fiber Net Pneumatic Fenders Market, 2016 – 2026 (USD Million)
      2. 2.6.2. Global Fiber Net Pneumatic Fenders Market, 2016 – 2026 (Units)
  3. Chapter 3 Pneumatic Fenders Market – Application Analysis
    1. 3.1. Global Pneumatic Fenders Market – Application Overview
    2. 3.2. Global Pneumatic Fenders Market Share, by Application, 2019 & 2026 (USD Million)
    3. 3.3. Global Pneumatic Fenders Market share, by Application, 2019 & 2026 (Units)
    4. 3.4. Ports
      1. 3.4.1. Global Ports Pneumatic Fenders Market, 2016 – 2026 (USD Million)
      2. 3.4.2. Global Ports Pneumatic Fenders Market, 2016 – 2026 (Units)
    5. 3.5. Ships
      1. 3.5.1. Global Ships Pneumatic Fenders Market, 2016 – 2026 (USD Million)
      2. 3.5.2. Global Ships Pneumatic Fenders Market, 2016 – 2026 (Units)
    6. 3.6. Others
      1. 3.6.1. Global Others Pneumatic Fenders Market, 2016 – 2026 (USD Million)
      2. 3.6.2. Global Others Pneumatic Fenders Market, 2016 – 2026 (Units)
  4. Chapter 4 Pneumatic Fenders Market – Regional Analysis
    1. 4.1. Global Pneumatic Fenders Market Regional Overview
    2. 4.2. Global Pneumatic Fenders Market Share, by Region, 2019 & 2026 (USD Million)
    3. 4.3. Global Pneumatic Fenders Market Share, by Region, 2019 & 2026 (Units)
    4. 4.4. North America
      1. 4.4.1. North America Pneumatic Fenders Market, 2016 – 2026 (USD Million)
        1. 4.4.1.1. North America Pneumatic Fenders Market, by Country, 2016 – 2026 (USD Million)
      2. 4.4.2. North America Market, 2016 – 2026 (Units)
        1. 4.4.2.1. North America Pneumatic Fenders Market, by Country, 2016 – 2026 (Units)
      3. 4.4.3. North America Pneumatic Fenders Market, by Type, 2016 – 2026
        1. 4.4.3.1. North America Pneumatic Fenders Market, by Type, 2016 – 2026 (USD Million)
        2. 4.4.3.2. North America Pneumatic Fenders Market, by Type, 2016 – 2026 (Units)
      4. 4.4.4. North America Pneumatic Fenders Market, by Application, 2016 – 2026
        1. 4.4.4.1. North America Pneumatic Fenders Market, by Application, 2016 – 2026 (USD Million)
        2. 4.4.4.2. North America Pneumatic Fenders Market, by Application, 2016 – 2026 (Units)
      5. 4.4.5. U.S.
        1. 4.4.5.1. U.S. Pneumatic Fenders Market, 2016 – 2026 (USD Million)
        2. 4.4.5.2. U.S. Pneumatic Fenders Market, 2016 – 2026 (Units)
      6. 4.4.6. Canada
        1. 4.4.6.1. Canada Pneumatic Fenders Market, 2016 – 2026 (USD Million)
        2. 4.4.6.2. Canada Pneumatic Fenders Market, 2016 – 2026 (Units)
    5. 4.5. Europe
      1. 4.5.1. Europe Pneumatic Fenders Market, 2016 – 2026 (USD Million)
        1. 4.5.1.1. Europe Pneumatic Fenders Market, by Country, 2016 – 2026 (USD Million)
      2. 4.5.2. Europe Market, 2016 – 2026 (Units)
        1. 4.5.2.1. Europe Pneumatic Fenders Market, by Country, 2016 – 2026 (Units)
      3. 4.5.3. Europe Pneumatic Fenders Market, by Type, 2016 – 2026
        1. 4.5.3.1. Europe Pneumatic Fenders Market, by Type, 2016 – 2026 (USD Million)
        2. 4.5.3.2. Europe Pneumatic Fenders Market, by Type, 2016 – 2026 (Units)
      4. 4.5.4. Europe Pneumatic Fenders Market, by Application, 2016 – 2026
        1. 4.5.4.1. Europe Pneumatic Fenders Market, by Application, 2016 – 2026 (USD Million)
        2. 4.5.4.2. Europe Pneumatic Fenders Market, by Application, 2016 – 2026 (Units)
      5. 4.5.5. Germany
        1. 4.5.5.1. Germany Pneumatic Fenders Market, 2016 – 2026 (USD Million)
        2. 4.5.5.2. Germany Pneumatic Fenders Market, 2016 – 2026 (Units)
      6. 4.5.6. France
        1. 4.5.6.1. France Pneumatic Fenders Market, 2016 – 2026 (USD Million)
        2. 4.5.6.2. France Pneumatic Fenders Market, 2016 – 2026 (Units)
      7. 4.5.7. U.K.
        1. 4.5.7.1. U.K. Pneumatic Fenders Market, 2016 – 2026 (USD Million)
        2. 4.5.7.2. U.K. Pneumatic Fenders Market, 2016 – 2026 (Units)
      8. 4.5.8. Italy
        1. 4.5.8.1. Italy Pneumatic Fenders Market, 2016 – 2026 (USD Million)
        2. 4.5.8.2. Italy Pneumatic Fenders Market, 2016 – 2026 (Units)
      9. 4.5.9. Spain
        1. 4.5.9.1. Spain Pneumatic Fenders Market, 2016 – 2026 (USD Million)
        2. 4.5.9.2. Spain Pneumatic Fenders Market, 2016 – 2026 (Units)
      10. 4.5.10. Rest of Europe
        1. 4.5.10.1. Rest of Europe Pneumatic Fenders Market, 2016 – 2026 (USD Million)
        2. 4.5.10.2. Rest of Europe Pneumatic Fenders Market, 2016 – 2026 (Units)
    6. 4.6. Asia Pacific
      1. 4.6.1. Asia Pacific Pneumatic Fenders Market, 2016 – 2026 (USD Million)
        1. 4.6.1.1. Asia Pacific Pneumatic Fenders Market, by Country, 2016 – 2026 (USD Million)
      2. 4.6.2. Asia Pacific Market, 2016 – 2026 (Units)
        1. 4.6.2.1. Asia Pacific Pneumatic Fenders Market, by Country, 2016 – 2026 (Units)
      3. 4.6.3. Asia Pacific Pneumatic Fenders Market, by Type, 2016 – 2026
        1. 4.6.3.1. Asia Pacific Pneumatic Fenders Market, by Type, 2016 – 2026 (USD Million)
        2. 4.6.3.2. Asia Pacific Pneumatic Fenders Market, by Type, 2016 – 2026 (Units)
      4. 4.6.4. Asia Pacific Pneumatic Fenders Market, by Application, 2016 – 2026
        1. 4.6.4.1. Asia Pacific Pneumatic Fenders Market, by Application, 2016 – 2026 (USD Million)
        2. 4.6.4.2. Asia Pacific Pneumatic Fenders Market, by Application, 2016 – 2026 (Units)
      5. 4.6.5. China
        1. 4.6.5.1. China Pneumatic Fenders Market, 2016 – 2026 (USD Million)
        2. 4.6.5.2. China Pneumatic Fenders Market, 2016 – 2026 (Units)
      6. 4.6.6. Japan
        1. 4.6.6.1. Japan Pneumatic Fenders Market, 2016 – 2026 (USD Million)
        2. 4.6.6.2. Japan Pneumatic Fenders Market, 2016 – 2026 (Units)
      7. 4.6.7. India
        1. 4.6.7.1. India Pneumatic Fenders Market, 2016 – 2026 (USD Million)
        2. 4.6.7.2. India Pneumatic Fenders Market, 2016 – 2026 (Units)
      8. 4.6.8. South Korea
        1. 4.6.8.1. South Korea Pneumatic Fenders Market, 2016 – 2026 (USD Million)
        2. 4.6.8.2. South Korea Pneumatic Fenders Market, 2016 – 2026 (Units)
      9. 4.6.9. South-East Asia
        1. 4.6.9.1. South-East Asia Pneumatic Fenders Market, 2016 – 2026 (USD Million)
        2. 4.6.9.2. South-East Asia Pneumatic Fenders Market, 2016 – 2026 (Units)
      10. 4.6.10. Rest of Asia Pacific
        1. 4.6.10.1. Rest of Asia Pacific Pneumatic Fenders Market, 2016 – 2026 (USD Million)
        2. 4.6.10.2. Rest of Asia Pacific Pneumatic Fenders Market, 2016 – 2026 (Units)
    7. 4.7. Latin America
      1. 4.7.1. Latin America Pneumatic Fenders Market, 2016 – 2026 (USD Million)
        1. 4.7.1.1. Latin America Pneumatic Fenders Market, by Country, 2016 – 2026 (USD Million)
      2. 4.7.2. Latin America Market, 2016 – 2026 (Units)
        1. 4.7.2.1. Latin America Pneumatic Fenders Market, by Country, 2016 – 2026 (Units)
      3. 4.7.3. Latin America Pneumatic Fenders Market, by Type, 2016 – 2026
        1. 4.7.3.1. Latin America Pneumatic Fenders Market, by Type, 2016 – 2026 (USD Million)
        2. 4.7.3.2. Latin America Pneumatic Fenders Market, by Type, 2016 – 2026 (Units)
      4. 4.7.4. Latin America Pneumatic Fenders Market, by Application, 2016 – 2026
        1. 4.7.4.1. Latin America Pneumatic Fenders Market, by Application, 2016 – 2026 (USD Million)
        2. 4.7.4.2. Latin America Pneumatic Fenders Market, by Application, 2016 – 2026 (Units)
      5. 4.7.5. Brazil
        1. 4.7.5.1. Brazil Pneumatic Fenders Market, 2016 – 2026 (USD Million)
        2. 4.7.5.2. Brazil Pneumatic Fenders Market, 2016 – 2026 (Units)
      6. 4.7.6. Mexico
        1. 4.7.6.1. Mexico Pneumatic Fenders Market, 2016 – 2026 (USD Million)
        2. 4.7.6.2. Mexico Pneumatic Fenders Market, 2016 – 2026 (Units)
      7. 4.7.7. Rest of Latin America
        1. 4.7.7.1. Rest of Latin America Pneumatic Fenders Market, 2016 – 2026 (USD Million)
        2. 4.7.7.2. Rest of Latin America Pneumatic Fenders Market, 2016 – 2026 (Units)
    8. 4.8. The Middle-East and Africa
      1. 4.8.1. The Middle-East and Africa Pneumatic Fenders Market, 2016 – 2026 (USD Million)
        1. 4.8.1.1. The Middle-East and Africa Pneumatic Fenders Market, by Country, 2016 – 2026 (USD Million)
      2. 4.8.2. The Middle-East and Africa Market, 2016 – 2026 (Units)
        1. 4.8.2.1. The Middle-East and Africa Pneumatic Fenders Market, by Country, 2016 – 2026 (Units)
      3. 4.8.3. The Middle-East and Africa Pneumatic Fenders Market, by Type, 2016 – 2026
        1. 4.8.3.1. The Middle-East and Africa Pneumatic Fenders Market, by Type, 2016 – 2026 (USD Million)
        2. 4.8.3.2. The Middle-East and Africa Pneumatic Fenders Market, by Type, 2016 – 2026 (Units)
      4. 4.8.4. The Middle-East and Africa Pneumatic Fenders Market, by Application, 2016 – 2026
        1. 4.8.4.1. The Middle-East and Africa Pneumatic Fenders Market, by Application, 2016 – 2026 (USD Million)
        2. 4.8.4.2. The Middle-East and Africa Pneumatic Fenders Market, by Application, 2016 – 2026 (Units)
      5. 4.8.5. GCC Countries
        1. 4.8.5.1. GCC Countries Pneumatic Fenders Market, 2016 – 2026 (USD Million)
        2. 4.8.5.2. GCC Countries Pneumatic Fenders Market, 2016 – 2026 (Units)
      6. 4.8.6. South Africa
        1. 4.8.6.1. South Africa Pneumatic Fenders Market, 2016 – 2026 (USD Million)
        2. 4.8.6.2. South Africa Pneumatic Fenders Market, 2016 – 2026 (Units)
      7. 4.8.7. Rest of Middle-East Africa
        1. 4.8.7.1. Rest of Middle-East Africa Pneumatic Fenders Market, 2016 – 2026 (USD Million)
        2. 4.8.7.2. Rest of Middle-East Africa Pneumatic Fenders Market, 2016 – 2026 (Units)
  5. Chapter 5 Pneumatic Fenders Production, Consumption, Export, Import by Regions
    1. 5.1. Global Pneumatic Fenders Production and Consumption, 2016 – 2026 (Units)
    2. 5.2. Global Import and Export Analysis, by Region
  6. Chapter 6 Pneumatic Fenders Market – Competitive Landscape
    1. 6.1. Competitor Market Share – Revenue
    2. 6.2. Market Concentration Rate Analysis, Top 3 and Top 5 Players
    3. 6.3. Competitor Market Share – Volume
    4. 6.4. Strategic Developments
      1. 6.4.1. Acquisitions and Mergers
      2. 6.4.2. New Products
      3. 6.4.3. Research & Development Activities
  7. Chapter 7 Company Profiles
    1. 7.1. Trelleborg Marine and Infrastructure
      1. 7.1.1. Company Overview
      2. 7.1.2. Product/Service Portfolio
      3. 7.1.3. Trelleborg Marine and Infrastructure Sales, Revenue, Price, and Gross Margin
      4. 7.1.4. Trelleborg Marine and Infrastructure Revenue and Growth Rate
      5. 7.1.5. Trelleborg Marine and Infrastructure Market Share
      6. 7.1.6. Recent Initiatives, Funding/VC Activities, and Technological Innovations
    2. 7.2. PALFINGER AG
      1. 7.2.1. Company Overview
      2. 7.2.2. Product/Service Portfolio
      3. 7.2.3. PALFINGER AG Sales, Revenue, Price, and Gross Margin
      4. 7.2.4. PALFINGER AG Revenue and Growth Rate
      5. 7.2.5. PALFINGER AG Market Share
      6. 7.2.6. Recent Initiatives, Funding/VC Activities, and Technological Innovations
    3. 7.3. ShibataFenderTeam AG
      1. 7.3.1. Company Overview
      2. 7.3.2. Product/Service Portfolio
      3. 7.3.3. ShibataFenderTeam AG Sales, Revenue, Price, and Gross Margin
      4. 7.3.4. ShibataFenderTeam AG Revenue and Growth Rate
      5. 7.3.5. ShibataFenderTeam AG Market Share
      6. 7.3.6. Recent Initiatives, Funding/VC Activities, and Technological Innovations
    4. 7.4. THE YOKOHAMA RUBBER CO., LTD.
      1. 7.4.1. Company Overview
      2. 7.4.2. Product/Service Portfolio
      3. 7.4.3. THE YOKOHAMA RUBBER CO., LTD. Sales, Revenue, Price, and Gross Margin
      4. 7.4.4. THE YOKOHAMA RUBBER CO., LTD. Revenue and Growth Rate
      5. 7.4.5. THE YOKOHAMA RUBBER CO., LTD. Market Share
      6. 7.4.6. Recent Initiatives, Funding/VC Activities, and Technological Innovations
    5. 7.5. Qingdao Jier Engineering Rubber Co., Ltd.
      1. 7.5.1. Company Overview
      2. 7.5.2. Product/Service Portfolio
      3. 7.5.3. Qingdao Jier Engineering Rubber Co., Ltd. Sales, Revenue, Price, and Gross Margin
      4. 7.5.4. Qingdao Jier Engineering Rubber Co., Ltd. Revenue and Growth Rate
      5. 7.5.5. Qingdao Jier Engineering Rubber Co., Ltd. Market Share
      6. 7.5.6. Recent Initiatives, Funding/VC Activities, and Technological Innovations
    6. 7.6. Shandong Nanhai Airbag Engineering Co ., Ltd
      1. 7.6.1. Company Overview
      2. 7.6.2. Product/Service Portfolio
      3. 7.6.3. Shandong Nanhai Airbag Engineering Co ., Ltd Sales, Revenue, Price, and Gross Margin
      4. 7.6.4. Shandong Nanhai Airbag Engineering Co ., Ltd Revenue and Growth Rate
      5. 7.6.5. Shandong Nanhai Airbag Engineering Co ., Ltd Market Share
      6. 7.6.6. Recent Initiatives, Funding/VC Activities, and Technological Innovations
    7. 7.7. Qingdao Evergreen Maritime Co., Ltd
      1. 7.7.1. Company Overview
      2. 7.7.2. Product/Service Portfolio
      3. 7.7.3. Qingdao Evergreen Maritime Co., Ltd Sales, Revenue, Price, and Gross Margin
      4. 7.7.4. Qingdao Evergreen Maritime Co., Ltd Revenue and Growth Rate
      5. 7.7.5. Qingdao Evergreen Maritime Co., Ltd Market Share
      6. 7.7.6. Recent Initiatives, Funding/VC Activities, and Technological Innovations
    8. 7.8. Qingdao Tiandun Rubber Co.,Ltd
      1. 7.8.1. Company Overview
      2. 7.8.2. Product/Service Portfolio
      3. 7.8.3. Qingdao Tiandun Rubber Co.,Ltd Sales, Revenue, Price, and Gross Margin
      4. 7.8.4. Qingdao Tiandun Rubber Co.,Ltd Revenue and Growth Rate
      5. 7.8.5. Qingdao Tiandun Rubber Co.,Ltd Market Share
      6. 7.8.6. Recent Initiatives, Funding/VC Activities, and Technological Innovations
    9. 7.9. Sumitomo Rubber Industries, Ltd.
      1. 7.9.1. Company Overview
      2. 7.9.2. Product/Service Portfolio
      3. 7.9.3. Sumitomo Rubber Industries, Ltd. Sales, Revenue, Price, and Gross Margin
      4. 7.9.4. Sumitomo Rubber Industries, Ltd. Revenue and Growth Rate
      5. 7.9.5. Sumitomo Rubber Industries, Ltd. Market Share
      6. 7.9.6. Recent Initiatives, Funding/VC Activities, and Technological Innovations
    10. 7.10. ANCHOR MARINE & SUPPLY, INC.
      1. 7.10.1. Company Overview
      2. 7.10.2. Product/Service Portfolio
      3. 7.10.3. ANCHOR MARINE & SUPPLY, INC. Sales, Revenue, Price, and Gross Margin
      4. 7.10.4. ANCHOR MARINE & SUPPLY, INC. Revenue and Growth Rate
      5. 7.10.5. ANCHOR MARINE & SUPPLY, INC. Market Share
      6. 7.10.6. Recent Initiatives, Funding/VC Activities, and Technological Innovations
    11. 7.11. IRM Offshore and Marine Engineers Pvt. Ltd.
      1. 7.11.1. Company Overview
      2. 7.11.2. Product/Service Portfolio
      3. 7.11.3. IRM Offshore and Marine Engineers Pvt. Ltd. Sales, Revenue, Price, and Gross Margin
      4. 7.11.4. IRM Offshore and Marine Engineers Pvt. Ltd. Revenue and Growth Rate
      5. 7.11.5. IRM Offshore and Marine Engineers Pvt. Ltd. Market Share
      6. 7.11.6. Recent Initiatives, Funding/VC Activities, and Technological Innovations
  8. Chapter 8 Pneumatic Fenders — Industry Analysis
    1. 8.1. Introduction and Taxonomy
    2. 8.2. Pneumatic Fenders Market – Key Trends
      1. 8.2.1. Market Drivers
      2. 8.2.2. Market Restraints
      3. 8.2.3. Market Opportunities
    3. 8.3. Value Chain Analysis
    4. 8.4. Key Mandates and Regulations
    5. 8.5. Technology Roadmap and Timeline
    6. 8.6. Pneumatic Fenders Market – Attractiveness Analysis
      1. 8.6.1. By Type
      2. 8.6.2. By Application
      3. 8.6.3. By Region
  9. Chapter 9 Raw Material Analysis
    1. 9.1. Pneumatic Fenders Key Raw Material Analysis
      1. 9.1.1. Key Raw Materials
      2. 9.1.2. Price Trend of Key Raw Materials
    2. 9.2. Key Suppliers of Raw Materials
    3. 9.3. Proportion of Manufacturing Cost Structure
      1. 9.3.1. Raw Materials Cost
      2. 9.3.2. Labor Cost
      3. 9.3.3. Manufacturing Expenses
      4. 9.3.4. Miscellaneous Expenses
    4. 9.4. Manufacturing Cost Analysis of Pneumatic Fenders
  10. Chapter 10 Industrial Chain, Sourcing Strategy, and Downstream Buyers
    1. 10.1. Pneumatic Fenders Industrial Chain Analysis
    2. 10.2. Upstream Raw Materials Sourcing
      1. 10.2.1. Risk Mitigation:
      2. 10.2.2. Supplier Relationships:
      3. 10.2.3. Business Processes:
      4. 10.2.4. Securing the Product:
    3. 10.3. Raw Materials Sources of Pneumatic Fenders Major Manufacturers
    4. 10.4. Downstream Buyers
    5. 10.5. Distributors/Traders List
  11. Chapter 11 Marketing Strategy Analysis, Distributors
    1. 11.1. Marketing Channel
    2. 11.2. Direct Marketing
    3. 11.3. Indirect Marketing
    4. 11.4. Marketing Channel Development Trends
    5. 11.5. Economic/Political Environmental Change
  12. Chapter 12 Report Conclusion & Key Insights
    1. 12.1. Key Insights from Primary Interviews & Surveys Respondents
    2. 12.2. Key Takeaways from Analysts, Consultants, and Industry Leaders
  13. Chapter 13 Research Approach & Methodology
    1. 13.1. Report Description
    2. 13.2. Research Scope
    3. 13.3. Research Methodology
      1. 13.3.1. Secondary Research
      2. 13.3.2. Primary Research
      3. 13.3.3. Statistical Models
        1. 13.3.3.1. Company Share Analysis Model
        2. 13.3.3.2. Revenue Based Modeling
      4. 13.3.4. Research Limitations

      List of Figures

      Fig.1 Product Picture of Pneumatic Fenders
      Fig.2 Global Pneumatic Fenders Market, 2016 – 2026 (USD Million)
      Fig.3 Global Pneumatic Fenders Market, 2016 – 2026 (Units)
      Fig.4 Global Pneumatic Fenders Market Absolute Revenue Opportunity, 2016 – 2026 (USD Million)
      Fig.5 Global Pneumatic Fenders Market Incremental Revenue Opportunity, 2020 – 2026 (USD Million)
      Fig.6 Global Pneumatic Fenders Market Share, by Type, 2019 & 2026 (USD Million)
      Fig.7 Global Pneumatic Fenders Market Share, by Type, 2019 & 2026 (Units)
      Fig.8 Global Rubber Mat-Wire Net Pneumatic Fenders Market, 2016 – 2026 (USD Million)
      Fig.9 Global Rubber Mat-Wire Net Pneumatic Fenders Market, 2016 – 2026 (Units)
      Fig.10 Global Tire-Chain Net Pneumatic Fenders Market, 2016 – 2026 (USD Million)
      Fig.11 Global Tire-Chain Net Pneumatic Fenders Market, 2016 – 2026 (Units)
      Fig.12 Global Fiber Net Pneumatic Fenders Market, 2016 – 2026 (USD Million)
      Fig.13 Global Fiber Net Pneumatic Fenders Market, 2016 – 2026 (Units)
      Fig.14 Global Pneumatic Fenders Market Share, by Application, 2019 & 2026 (USD Million)
      Fig.15 Global Pneumatic Fenders Market Share, by Application, 2019 & 2026 (Units)
      Fig.16 Global Ports Pneumatic Fenders Market, 2016 – 2026 (USD Million)
      Fig.17 Global Ports Pneumatic Fenders Market, 2016 – 2026 (Units)
      Fig.18 Global Ships Pneumatic Fenders Market, 2016 – 2026 (USD Million)
      Fig.19 Global Ships Pneumatic Fenders Market, 2016 – 2026 (Units)
      Fig.20 Global Others Pneumatic Fenders Market, 2016 – 2026 (USD Million)
      Fig.21 Global Others Pneumatic Fenders Market, 2016 – 2026 (Units)
      Fig.22 Global Pneumatic Fenders Market Share, by Region, 2019 & 2026 (USD Million)
      Fig.23 Global Pneumatic Fenders Market Share, by Region, 2019 & 2026 (Units)
      Fig.24 North America Pneumatic Fenders Market, 2016 – 2026 (USD Million)
      Fig.25 North America Pneumatic Fenders Market, 2016 – 2026 (Units)
      Fig.26 U.S. Pneumatic Fenders Market, 2016 – 2026 (USD Million)
      Fig.27 U.S. Pneumatic Fenders  Market, 2016 – 2026 (Units)
      Fig.28 Canada Pneumatic Fenders Market, 2016 – 2026 (USD Million)
      Fig.29 Canada Pneumatic Fenders  Market, 2016 – 2026 (Units)
      Fig.30 Europe Pneumatic Fenders Market, 2016 – 2026 (USD Million)
      Fig.31 Europe Pneumatic Fenders Market, 2016 – 2026 (Units)
      Fig.32 Germany Pneumatic Fenders Market, 2016 – 2026 (USD Million)
      Fig.33 Germany Pneumatic Fenders  Market, 2016 – 2026 (Units)
      Fig.34 France Pneumatic Fenders Market, 2016 – 2026 (USD Million)
      Fig.35 France Pneumatic Fenders  Market, 2016 – 2026 (Units)
      Fig.36 U.K. Pneumatic Fenders Market, 2016 – 2026 (USD Million)
      Fig.37 U.K. Pneumatic Fenders  Market, 2016 – 2026 (Units)
      Fig.38 Italy Pneumatic Fenders Market, 2016 – 2026 (USD Million)
      Fig.39 Italy Pneumatic Fenders  Market, 2016 – 2026 (Units)
      Fig.40 Spain Pneumatic Fenders Market, 2016 – 2026 (USD Million)
      Fig.41 Spain Pneumatic Fenders  Market, 2016 – 2026 (Units)
      Fig.42 Rest of Europe Pneumatic Fenders Market, 2016 – 2026 (USD Million)
      Fig.43 Rest of Europe Pneumatic Fenders  Market, 2016 – 2026 (Units)
      Fig.44 Asia Pacific Pneumatic Fenders Market, 2016 – 2026 (USD Million)
      Fig.45 Asia Pacific Pneumatic Fenders Market, 2016 – 2026 (Units)
      Fig.46 China Pneumatic Fenders Market, 2016 – 2026 (USD Million)
      Fig.47 China Pneumatic Fenders  Market, 2016 – 2026 (Units)
      Fig.48 Japan Pneumatic Fenders Market, 2016 – 2026 (USD Million)
      Fig.49 Japan Pneumatic Fenders  Market, 2016 – 2026 (Units)
      Fig.50 India Pneumatic Fenders Market, 2016 – 2026 (USD Million)
      Fig.51 India Pneumatic Fenders  Market, 2016 – 2026 (Units)
      Fig.52 South  Korea Pneumatic Fenders Market, 2016 – 2026 (USD Million)
      Fig.53 South  Korea Pneumatic Fenders  Market, 2016 – 2026 (Units)
      Fig.54 South-East Asia Pneumatic Fenders Market, 2016 – 2026 (USD Million)
      Fig.55 South-East Asia Pneumatic Fenders  Market, 2016 – 2026 (Units)
      Fig.56 Rest of Asia Pacific Pneumatic Fenders Market, 2016 – 2026 (USD Million)
      Fig.57 Rest of Asia Pacific Pneumatic Fenders  Market, 2016 – 2026 (Units)
      Fig.58 Latin America Pneumatic Fenders Market, 2016 – 2026 (USD Million)
      Fig.59 Latin America Pneumatic Fenders Market, 2016 – 2026 (Units)
      Fig.60 Brazil Pneumatic Fenders Market, 2016 – 2026 (USD Million)
      Fig.61 Brazil Pneumatic Fenders  Market, 2016 – 2026 (Units)
      Fig.62 Mexico Pneumatic Fenders Market, 2016 – 2026 (USD Million)
      Fig.63 Mexico Pneumatic Fenders  Market, 2016 – 2026 (Units)
      Fig.64 Rest of Latin America Pneumatic Fenders Market, 2016 – 2026 (USD Million)
      Fig.65 Rest of Latin America Pneumatic Fenders  Market, 2016 – 2026 (Units)
      Fig.66 The Middle-East and Africa Pneumatic Fenders Market, 2016 – 2026 (USD Million)
      Fig.67 The Middle-East and Africa Pneumatic Fenders Market, 2016 – 2026 (Units)
      Fig.68 GCC Countries Pneumatic Fenders Market, 2016 – 2026 (USD Million)
      Fig.69 GCC Countries Pneumatic Fenders  Market, 2016 – 2026 (Units)
      Fig.70 South Africa Pneumatic Fenders Market, 2016 – 2026 (USD Million)
      Fig.71 South Africa Pneumatic Fenders  Market, 2016 – 2026 (Units)
      Fig.72 Rest of Middle-East Africa Pneumatic Fenders Market, 2016 – 2026 (USD Million)
      Fig.73 Rest of Middle-East Africa Pneumatic Fenders  Market, 2016 – 2026 (Units)
      Fig.74 Global Pneumatic Fenders Production and Consumption, 2016 – 2026 (Units)
      Fig.75 North America Pneumatic Fenders Production and Consumption, 2016 – 2026 (USD Million) (Units)
      Fig.76 Europe Pneumatic Fenders Production and Consumption, 2016 – 2026 (USD Million) (Units)
      Fig.77 Asia Pacific Pneumatic Fenders Production and Consumption, 2016 – 2026 (USD Million) (Units)
      Fig.78 Latin America Pneumatic Fenders Production and Consumption, 2016 – 2026 (USD Million) (Units)
      Fig.79 The Middle-East and Africa Pneumatic Fenders Production and Consumption, 2016 – 2026 (USD Million) (Units)
      Fig.80 Competitor Market Share – Revenue
      Fig.81 Competitor Market Share – Volume
      Fig.82 Trelleborg Marine and Infrastructure Revenue and Growth Rate
      Fig.83 Trelleborg Marine and Infrastructure Market Share
      Fig.84 PALFINGER AG Revenue and Growth Rate
      Fig.85 PALFINGER AG Market Share
      Fig.86 ShibataFenderTeam AG Revenue and Growth Rate
      Fig.87 ShibataFenderTeam AG Market Share
      Fig.88 THE YOKOHAMA RUBBER CO., LTD. Revenue and Growth Rate
      Fig.89 THE YOKOHAMA RUBBER CO., LTD. Market Share
      Fig.90 Qingdao Jier Engineering Rubber Co., Ltd. Revenue and Growth Rate
      Fig.91 Qingdao Jier Engineering Rubber Co., Ltd. Market Share
      Fig.92 Shandong Nanhai Airbag Engineering Co ., Ltd Revenue and Growth Rate
      Fig.93 Shandong Nanhai Airbag Engineering Co ., Ltd Market Share
      Fig.94 Qingdao Evergreen Maritime Co., Ltd Revenue and Growth Rate
      Fig.95 Qingdao Evergreen Maritime Co., Ltd Market Share
      Fig.96 Qingdao Tiandun Rubber Co.,Ltd Revenue and Growth Rate
      Fig.97 Qingdao Tiandun Rubber Co.,Ltd Market Share
      Fig.98 Sumitomo Rubber Industries, Ltd. Revenue and Growth Rate
      Fig.99 Sumitomo Rubber Industries, Ltd. Market Share
      Fig.100 ANCHOR MARINE & SUPPLY, INC. Revenue and Growth Rate
      Fig.101 ANCHOR MARINE & SUPPLY, INC. Market Share
      Fig.102 IRM Offshore and Marine Engineers Pvt. Ltd. Revenue and Growth Rate
      Fig.103 IRM Offshore and Marine Engineers Pvt. Ltd. Market Share
      Fig.104 Market Dynamics
      Fig.105 Global Pneumatic Fenders – Value Chain Analysis
      Fig.106 Key Mandates and Regulations
      Fig.107 Technology Roadmap and Timeline
      Fig.108 Market Attractiveness Analysis – By Type
      Fig.109 Market Attractiveness Analysis – By Application
      Fig.110 Market Attractiveness Analysis – By Region
      Fig.111 Manufacturing Cost Structure of Pneumatic Fenders
      Fig.112 Pneumatic Fenders Industrial Chain Analysis
      Fig.113 Market Channels
      Fig.114 Marketing Channel Development Trend
      Fig.115 Growth in World Gross Product, 2008-2018

      List of Tables

      Table 1 Global Pneumatic Fenders Market, 2019 & 2026 (USD Million)
      Table 2 Global Pneumatic Fenders Market, by Type, 2016 – 2026 (USD Million)
      Table 3 Global Pneumatic Fenders Market, by Type, 2016 – 2026 (Units)
      Table 4 Global Pneumatic Fenders Market, by Application, 2016 – 2026 (USD Million)
      Table 5 Global Pneumatic Fenders Market, by Application, 2016 – 2026 (Units)
      Table 6 Global Pneumatic Fenders Market, by Region, 2016 – 2026 (USD Million)
      Table 7 Global Pneumatic Fenders Market, by Region, 2016 – 2026 (Units)
      Table 8 North America Pneumatic Fenders Market, by Country, 2016 – 2026 (USD Million)
      Table 9 North America Pneumatic Fenders Market, by Country, 2016 – 2026 (Units)
      Table 10 North America Pneumatic Fenders Market, by Type, 2016 – 2026 (USD Million)
      Table 11 North America Pneumatic Fenders Market, by Type, 2016 – 2026 (Units)
      Table 12 North America Pneumatic Fenders Market, by Application, 2016 – 2026 (USD Million)
      Table 13 North America Pneumatic Fenders Market, by Application, 2016 – 2026 (Units)
      Table 14 Europe Pneumatic Fenders Market, by Country, 2016 – 2026 (USD Million)
      Table 15 Europe Pneumatic Fenders Market, by Country, 2016 – 2026 (Units)
      Table 16 Europe Pneumatic Fenders Market, by Type, 2016 – 2026 (USD Million)
      Table 17 Europe Pneumatic Fenders Market, by Type, 2016 – 2026 (Units)
      Table 18 Europe Pneumatic Fenders Market, by Application, 2016 – 2026 (USD Million)
      Table 19 Europe Pneumatic Fenders Market, by Application, 2016 – 2026 (Units)
      Table 20 Asia Pacific Pneumatic Fenders Market, by Country, 2016 – 2026 (USD Million)
      Table 21 Asia Pacific Pneumatic Fenders Market, by Country, 2016 – 2026 (Units)
      Table 22 Asia Pacific Pneumatic Fenders Market, by Type, 2016 – 2026 (USD Million)
      Table 23 Asia Pacific Pneumatic Fenders Market, by Type, 2016 – 2026 (Units)
      Table 24 Asia Pacific Pneumatic Fenders Market, by Application, 2016 – 2026 (USD Million)
      Table 25 Asia Pacific Pneumatic Fenders Market, by Application, 2016 – 2026 (Units)
      Table 26 Latin America Pneumatic Fenders Market, by Country, 2016 – 2026 (USD Million)
      Table 27 Latin America Pneumatic Fenders Market, by Country, 2016 – 2026 (Units)
      Table 28 Latin America Pneumatic Fenders Market, by Type, 2016 – 2026 (USD Million)
      Table 29 Latin America Pneumatic Fenders Market, by Type, 2016 – 2026 (Units)
      Table 30 Latin America Pneumatic Fenders Market, by Application, 2016 – 2026 (USD Million)
      Table 31 Latin America Pneumatic Fenders Market, by Application, 2016 – 2026 (Units)
      Table 32 The Middle-East and Africa Pneumatic Fenders Market, by Country, 2016 – 2026 (USD Million)
      Table 33 The Middle-East and Africa Pneumatic Fenders Market, by Country, 2016 – 2026 (Units)
      Table 34 The Middle-East and Africa Pneumatic Fenders Market, by Type, 2016 – 2026 (USD Million)
      Table 35 The Middle-East and Africa Pneumatic Fenders Market, by Type, 2016 – 2026 (Units)
      Table 36 The Middle-East and Africa Pneumatic Fenders Market, by Application, 2016 – 2026 (USD Million)
      Table 37 The Middle-East and Africa Pneumatic Fenders Market, by Application, 2016 – 2026 (Units)
      Table 38 North America Pneumatic Fenders Production, Consumption, Export, Import, 2016 – 2019
      Table 39 Europe Pneumatic Fenders Production, Consumption, Export, Import, 2016 – 2019
      Table 40 Asia Pacific Pneumatic Fenders Production, Consumption, Export, Import, 2016 – 2019
      Table 41 Latin America Pneumatic Fenders Production, Consumption, Export, Import, 2016 – 2019
      Table 42 The Middle-East and Africa Pneumatic Fenders Production, Consumption, Export, Import, 2016 – 2019
      Table 43 Global Pneumatic Fenders Market - Company Revenue Analysis, 2016 – 2019 (USD Million)
      Table 44 Global Pneumatic Fenders Market - Company Revenue Share Analysis, 2016 – 2019 (%)
      Table 45 Global Pneumatic Fenders Market - Company Volume Analysis, 2016 – 2019 (Units)
      Table 46 Global Pneumatic Fenders Market - Company Volume Share Analysis, 2016 – 2019 (%)
      Table 47 Acquisitions and Mergers
      Table 48 Market Drivers – Impact Analysis
      Table 49 Market Restraints
      Table 50 Market Opportunities
      Table 51 Production Base and Market Concentration Rate of Raw Material
      Table 52 Key Suppliers of Raw Materials
      Table 53 Raw Materials Sources of Pneumatic Fenders Major Manufacturers
      Table 54 Major Buyers of Pneumatic Fenders
      Table 55 Distributors/Traders of Pneumatic Fenders by Region

Industry Major Market Players

  •  Trelleborg Marine and Infrastructure
  •  PALFINGER AG
  •  ShibataFenderTeam AG
  •  THE YOKOHAMA RUBBER CO. Ltd.
  •  Qingdao Jier Engineering Rubber Co. Ltd.
  •  Shandong Nanhai Airbag Engineering Co. Ltd
  •  Qingdao Evergreen Maritime Co. Ltd
  •  Qingdao Tiandun Rubber Co. Ltd
  •  Sumitomo Rubber Industries Ltd.
  •  ANCHOR MARINE & SUPPLY Inc.
  •  IRM Offshore and Marine Engineers Pvt. Ltd