![]()
Search Market Research Report
Plywood Market Size, Share Global Analysis Report, 2020–2026

Plywood Market By Product Type (Hard Plywood and Soft Plywood), By Industry (Furniture Industry, Interior Decoration, Engineering & Construction, and Other), By Sales channel (Direct Sales and Distributor): Global Industry Outlook, Market Size, Business Intelligence, Consumer Preferences, Statistical Surveys, Comprehensive Analysis, Historical Developments, Current Trends, and Forecast 2020–2026
Industry Insights
The Plywood market report analyzes and notifies the industry statistics at the global as well as regional and country levels to acquire a thorough perspective of the entire Plywood market. The historical and past insights are provided for FY 2016 to FY 2019 whereas projected trends are delivered for FY 2020 to FY 2026. The quantitative and numerical data is represented in terms of volume (Million Cubic Meters) and value (USD Million) from FY 2016 – 2026.
This specialized and expertise-oriented industry research report scrutinizes the technical and commercial business outlook of the Plywood industry. The report analyzes and declares the historical and current trends analysis of the Plywood industry and subsequently recommends the projected trends anticipated to be observed in the Plywood market during the upcoming years.
 Key Insights from Primary Research
- As per the finding through primary interviews with industry experts, Mexico, and Brazil are the key countries in the Latin America region driving the overall market growth
- Growing infrastructure development and rising urbanization have a positive impact on the market demand
- Saudi Arabia and UAE are the major countries in the Middle East contributing to the overall market growth
- In Europe, advancement in interior decoration projects is exhibiting the significant impact
- Raw material sourcing and sustainable supply chain development are the key market challenges
Key Recommendations from Analysts
- As per our research analyst, a strong industry base and expansion of end-use industries are contributing to the market growth
- Demand-supply equilibrium can be achieved through price elasticity and inventory control
- Slow population growth due to moderate net migration in South Africa may challenge the market growth
- Environment regulations and government policies are the key macroeconomic factors affecting market performance
- The industry comprises several small-scale and middle scale, manufacturers
Market Snapshot
The quantitative data is further underlined and reinforced by comprehensive qualitative data which comprises various across-the-board market dynamics. The rationales which directly or indirectly impact the Plywood industry are exemplified through parameters such as growth drivers, restraints, challenges, and opportunities among other impacting factors.
Throughout our research report, we have encompassed all the proven models and tools of industry analysis and extensively illustrated all the key business strategies and business models adopted in the Plywood industry. The report provides an all-inclusive and detailed competitive landscape prevalent in the Plywood market.
The report utilizes established industry analysis tools and models such as Porter’s Five Forces framework to analyze and recognize critical business strategies adopted by various stakeholders involved in the entire value chain of the Plywood industry. The Plywood market report additionally employs SWOT analysis and PESTLE analysis models for further in-depth analysis.
The report study further includes an in-depth analysis of industry players' market shares and provides an overview of leading players' market position in the Plywood sector. Key strategic developments in the Plywood market competitive landscape such as acquisitions & mergers, inaugurations of different products and services, partnerships & joint ventures, MoU agreements, VC & funding activities, R&D activities, and geographic expansion among other noteworthy activities by key players of the Plywood market are appropriately highlighted in the report.
The growing use of plywood in commercial and residential construction along with vigorous R&D activities in the field of wood processing and plywood design is projected to fuel the demand generation over the market forecast. Additionally, key plywood companies are focusing on the organized distribution of their products through both offline and online channels.
Natural wood additives and adhesives are gaining popularity among industry participants. Furniture construction and flooring are the major applications of plywood. Moreover, wooden flooring is increasingly preferred across the construction industry as it adds an aesthetic appearance to the overall premise.
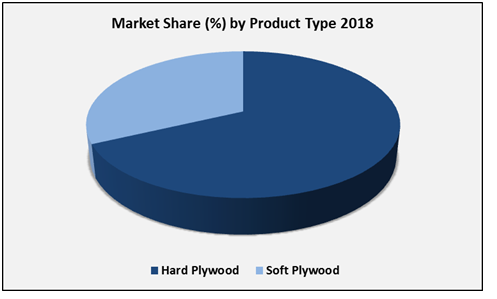
By product type, the global Plywood industry is categorized as hard plywood and soft plywood. By industry, the global Plywood industry is categorized as the furniture industry, interior decoration, engineering & construction, and other related industries. By the sales channel, the global plywood industry is categorized as direct sales and distributors.
Report Scope
Report Attribute |
Details |
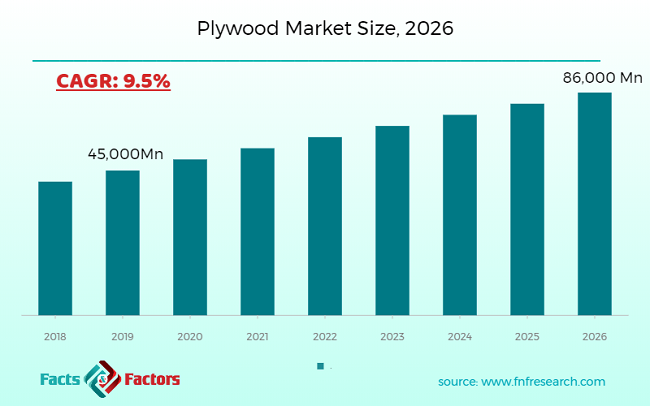
Market Size in 2019 |
USD 45,000 Million |
Projected Market Size in 2026 |
USD 86,000 Million |
CAGR Growth Rate |
9.5% CAGR |
Base Year |
2020 |
Forecast Years |
2020-2026 |
Key Market Players |
Greenply Industries Ltd., Eksons Corp. Bhd., Weyerhaeuser Company, Jaya Tiasa Holdings Bhd., Boise Cascade LLC, Atlantic Plywood Corporation, Georgia-Pacific Corporation, Uniply Industries Ltd., Roseburg Forest Products Co., Century Plyboard (India) Ltd., and Ainsworth Lumber Co. Ltd. |
Key Segment |
By Product Type, By Industry, By Sales channel, By Region |
Major Regions Covered |
North America, Europe, Asia Pacific, Latin America, and the Middle East & Africa |
Purchase Options |
Request customized purchase options to meet your research needs. Explore purchase options |
Some of the essential players operating in the Plywood market, but not restricted to include:
- Greenply Industries Ltd.
- Boise Cascade LLC
- Eksons Corp. Bhd.
- Weyerhaeuser Company
- Uniply Industries Ltd.
- Jaya Tiasa Holdings Bhd.
- Atlantic Plywood Corporation
- Georgia-Pacific Corporation
- Roseburg Forest Products Co.
- Century Plyboard (India) Ltd.
- Ainsworth Lumber Co. Ltd.
The taxonomy of the Plywood industry by its scope and segmentation is as follows:
By Product Type Segmentation Analysis
- Hard Plywood
- Soft Plywood
By Industry Segmentation Analysis
- Furniture Industry
- Interior Decoration
- Engineering & Construction
- Others
By Sales channel Segmentation Analysis
- Direct Sales
- Distributor
Regional Segmentation Analysis
- North America
- The U.S.
- Canada
- Europe
- Germany
- The UK
- France
- Spain
- Italy
- Rest of Europe
- Asia Pacific
- China
- Japan
- India
- South Korea
- Southeast Asia
- Rest of Asia Pacific
- Latin America
- Brazil
- Mexico
- Rest of Latin America
- Middle East & Africa
- GCC
- South Africa
- Rest of Middle East & Africa
Table of Content
Industry Major Market Players
- Greenply Industries Ltd.
- Boise Cascade LLC
- Eksons Corp. Bhd.
- Weyerhaeuser Company
- Uniply Industries Ltd.
- Jaya Tiasa Holdings Bhd.
- Atlantic Plywood Corporation
- Georgia-Pacific Corporation
- Roseburg Forest Products Co.
- Century Plyboard (India) Ltd.
- Ainsworth Lumber Co. Ltd.


Copyright © 2025 - 2026, All Rights Reserved, Facts and Factors