Search Market Research Report

Discover Our Latest Reports
Discover Our Featured Reports
Discover Top Selling Reports

Plasma Therapy Market Size, Share Global Analysis Report, , 2019 – 2026

report img

Plasma Therapy Market Type (Pure PRP, Leucocyte-Rich PRP, Pure Platelet-Rich Fibrin, Leukocyte-Rich Fibrin), Source (Autologous, Allogenic), Application (Orthopedics, Dermatology, Dental, Cardiac Muscle Injury, Nerve Injury, Others), End User (Hospitals & Clinics, Research Institutions): Global Industry Perspective, Comprehensive Analysis, and Forecast, 2019 – 2026

Industry Insights

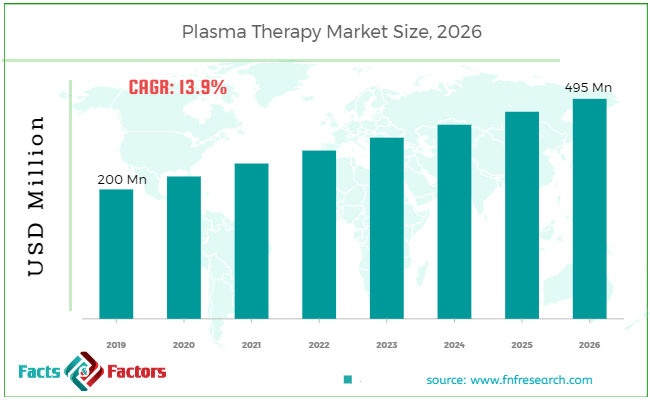
[130+ Pages Report] According to the report published by Facts Factors, the global plasma therapy market size was worth around USD 200 million in 2019 and is predicted to grow to around USD 495 million by 2026 with a compound annual growth rate (CAGR) of roughly 13.9% between 2020 and 2026. The report analyzes the global plasma therapy market drivers, restraints/challenges, and the effect they have on the demands during the projection period. In addition, the report explores emerging opportunities in the plasma therapy market.

Plasma Therapy Market Size

To know more about this report | Request Free Sample Copy

This specialized and expertise-oriented industry research report scrutinizes the technical and commercial business outlook of the Plasma Therapy industry. The report analyzes and declares the historical and current trends analysis of the Plasma Therapy industry and subsequently recommends the projected trends anticipated to be observed in the Plasma Therapy market during the upcoming years.

The plasma therapy market report analyzes and notifies the industry statistics at the global as well as regional and country levels to acquire a thorough perspective of the entire Plasma Therapy market. The historical and past insights are provided for FY 2016 to FY 2019 whereas projected trends are delivered for FY 2020 to FY 2026. The quantitative and numerical data is represented in terms of value (USD 495 Million) from FY 2016 – 2026.


logoKey Insights from Primary Research

  • As per our primary respondents, the global plasma therapy market is set to grow annually at a rate of around 13.9%.
  • It was established through primary research that the global Plasma Therapy market was valued at around USD 200 Million in 2019.
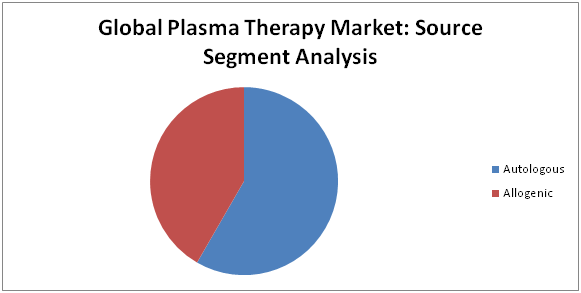
  • The “autologous” category, on the basis of source segmentation, was the leading revenue-generating category in 2019.
  • Based on the region, North America was the leading revenue-generating category in 2019.

logoKey Recommendations from Analysts

  • As per our analysis, the global plasma therapy market is growing at a high CAGR and various end-use industries are aware of this potential market and applications of plasma therapy.
  • Growing at a CAGR of around 13.9%, the global Plasma Therapy market provides numerous opportunities for all of the involved stakeholders across the entire value chain.
  • Our analysts have identified autologous segment will be dominating for global Plasma Therapy market in terms of source.
  • As per our analysis, North America is expected to account for the maximum revenue share, in the target market.

Plasma Therapy Market

To know more about this report | Request Free Sample Copy


The quantitative data is further underlined and reinforced by comprehensive qualitative data which comprises various across-the-board market dynamics. The rationales which directly or indirectly impact the Plasma Therapy industry are exemplified through parameters such as growth drivers, restraints, challenges, and opportunities among other impacting factors.

Throughout our research report, we have encompassed all the proven models and tools of industry analysis and extensively illustrated all the key business strategies and business models adopted in the Plasma Therapy industry. The report provides an all-inclusive and detailed competitive landscape prevalent in the Plasma Therapy market.

The report utilizes established industry analysis tools and models such as Porter’s Five Forces framework to analyze and recognize critical business strategies adopted by various stakeholders involved in the entire value chain of the Plasma Therapy industry. The Plasma Therapy market report additionally employs SWOT analysis and PESTLE analysis models for further in-depth analysis.

The report study further includes an in-depth analysis of industry players' market shares and provides an overview of leading players' market positions in the Plasma Therapy sector. Key strategic developments in the Plasma Therapy market competitive landscape such as acquisitions & mergers, inaugurations of different products and services, partnerships & joint ventures, MoU agreements, VC & funding activities, R&D activities, and geographic expansion among other noteworthy activities by key players of the Plasma Therapy market are appropriately highlighted in the report.

The developing pervasiveness of the COVID-19 pandemic has positive effect on the worldwide Plasma Therapy market. Orthopedic issues are connected with aging and injury, subsequently, high growth in demand for minimally invasive therapies is projected, which thus may support the worldwide plasma treatment market development. This has prompted expanded interest in PRP in dental applications, orthopedics, dermatology, and nerve injury. Expanding events of orthopedic issues, for example, joint inflammation and rising medicinal services use are factors foreseen to cultivate the worldwide market development.

Various patients with androgenic alopecia are developing over the world and expanding occurrences of sports wounds may support the worldwide market development in the future. Additionally, the rising utilization of platelet-rich plasma in various remedial regions emphatically impacts the worldwide plasma treatment market. However, the absence of mindfulness with respect to platelet-rich treatment, the absence of repayment approaches, and rigid administrative strategies restrict the worldwide plasma therapy market development.

On the basis of type, the global plasma therapy market is bifurcated into platelet-rich fibrin, pure PRP, leukocyte-rich fibrin, and leucocyte-rich PRP. The pure PRP section is assessed to represent the biggest portion of the worldwide market in 2019. One of the hugest elements driving the development of this market incorporates the successful aftereffects of pure PRP treatment. Nonetheless, the absence of repayment approaches and changing costs of plasma treatment are thwarting the development of the market.

On the basis of source, the market is segmented into allogenic and autologous. The autologous portion is assessed to represent the biggest portion of the worldwide market in 2019. Attention to plasma treatment and its acknowledgment as a reasonable solution for recuperating of bones and different tissues are driving the development of the autologous source fragment of the market.

On an application basis, the global plasma therapy market is bifurcated into orthopedics, dental, dermatology, nerve injury, cardiac muscle injury, and others. The dermatology section is relied upon to develop at the most elevated CAGR from 2019 to 2026, attributable to the expanding number of dermatological issues.

The end user segment is classified into research institutions and hospitals & clinics. The clinics and centers portion is assessed to represent the biggest portion of the worldwide market in 2019. This huge share is principally credited to ascend in medicinal services use and the increment in the utilization of PRP items in emergency clinics.

logoReport Scope

Report Attribute

Details

Market Size in 2019

USD 200 Million

Projected Market Size in 2026

USD 495 Million

CAGR Growth Rate

13.9% CAGR

Base Year

2019

Forecast Years

2020-2026

Key Market Players

Takeda Pharmaceutical Company ltd, Arthrex, Inc., BioLife Plasma Services, Bio Products Laboratory Ltd., Cambryn Biologics LLC, CSL Ltd., Biotest AG, China Biologic Products Holdings, Inc., DePuy Synthes Companies, Kedrion S.p.A, Grifols International S.A., LFB , Regen Lab USA LLC, Octapharma, Stryker, and Terumo BCT, Inc., and Others

Key Segment

By Type, Source, Application, End User, and Region

Major Regions Covered

North America, Europe, Asia Pacific, Latin America, and the Middle East & Africa

Purchase Options

Request customized purchase options to meet your research needs.Explore purchase options

The world market is bifurcated into North America, Latin America, APAC, Europe, and the MEA region. North America is projected to progressively rule the global market because of the developing rise of innovatively progressed advancements in the region. This development is because of an expansion in purchaser comprehension of the utilization of cutting-edge medicinal services in the zone.

North America is a very entrenched area regarding clinical information and the utilization of ADCs and makes up the greater part of the market. However, Asia Pacific is expected to spread at a high CAGR throughout the projected period due to the flare-up of Covid-19 in Wuhan Province in China and far and large in neighboring countries.

logoSome of the leading players in the global market include Takeda Pharmaceutical Company ltd

  •  Takeda Pharmaceutical Company ltd
  • Arthrex Inc.
  •  BioLife Plasma Services
  •  Bio Products Laboratory Ltd.
  •  Cambryn Biologics LLC
  •  CSL Ltd.
  •  Biotest AG
  •  China Biologic Products Holdings Inc.
  •  DePuy Synthes Companies
  •  Kedrion S.p.A
  •  Grifols International S.A.
  •  LFB 
  •  Regen Lab USA LLC
  •  Octapharma
  •  Stryker
  •  Terumo BCT  Inc

The taxonomy of the Plasma Therapy Market by its scope and segmentation is as follows:

logoBy Type Segment Analysis

  • Pure PRP
  • Leucocyte-rich PRP
  • Pure Platelet-rich Fibrin (PRF)
  • Leukocyte-rich Fibrin (L-PRF)

logoBy Source Segment Analysis

  • Autologous
  • Allogenic

logoBy Application Segment Analysis

  • Orthopedics
    • Arthritis
    • Chronic Tendinitis
    • Bone Repair & Regeneration
  • Dermatology
    • Androgenic Alopecia
    • Plastic Surgery
  • Dental
  • Cardiac Muscle Injury
  • Nerve Injury
  • Others

logoBy End User Segment Analysis

  • Hospitals & Clinics
  • Research Institutions

logo Regional Segment Analysis

  • North America
    • The U.S.
    • Canada
  • Europe
    • Germany
    • The UK
    • France
    • Spain
    • Italy
    • Rest of Europe
  • Asia Pacific
    • China
    • Japan
    • India
    • South Korea
    • Southeast Asia
    • Rest of Asia Pacific
  • Latin America
    • Brazil
    • Mexico
    • Rest of Latin America
  • Middle East & Africa
    • GCC
    • South Africa
    • Rest of Middle East & Africa

Table of Content

  1. CHAPTER 1. Executive Summary
  2. CHAPTER 2. Plasma Therapy market – Type Analysis
    1. 2.1. Global Plasma Therapy Market – Type Overview
    2. 2.2. Global Plasma Therapy Market Share, by Type, 2018 & 2025 (USD Million)
    3. 2.3. Pure PRP
      1. 2.3.1. Global Pure PRP Plasma Therapy Market, 2015-2025 (USD Million)
    4. 2.4. Leucocyte-rich PRP
      1. 2.4.1. Global Leucocyte-rich PRP Plasma Therapy Market, 2015-2025 (USD Million)
    5. 2.5. Pure Platelet-rich Fibrin (PRF)
      1. 2.5.1. Global Pure Platelet-rich Fibrin (PRF) Plasma Therapy Market, 2015-2025 (USD Million)
    6. 2.6. Leukocyte-rich Fibrin (L-PRF)
      1. 2.6.1. Global Leukocyte-rich Fibrin (L-PRF) Plasma Therapy Market, 2015-2025 (USD Million)
  3. CHAPTER 3. Plasma Therapy market – Source Analysis
    1. 3.1. Global Plasma Therapy Market – Source Overview
    2. 3.2. Global Plasma Therapy Market Share, by Source, 2018 & 2025 (USD Million)
    3. 3.3. Autologous
      1. 3.3.1. Global Autologous Plasma Therapy Market, 2015-2025 (USD Million)
    4. 3.4. Allogenic
      1. 3.4.1. Global Allogenic Plasma Therapy Market, 2015-2025 (USD Million)
  4. CHAPTER 4. Plasma Therapy market – Application Analysis
    1. 4.1. Global Plasma Therapy Market – Application Overview
    2. 4.2. Global Plasma Therapy Market Share, by Application, 2018 & 2025 (USD Million)
    3. 4.3. Orthopedics
      1. 4.3.1. Global Orthopedics Plasma Therapy Market, 2015-2025 (USD Million)
    4. 4.4. Dermatology
      1. 4.4.1. Global Dermatology Plasma Therapy Market, 2015-2025 (USD Million)
    5. 4.5. Dental
      1. 4.5.1. Global Dental Plasma Therapy Market, 2015-2025 (USD Million)
    6. 4.6. Cardiac Muscle Injury
      1. 4.6.1. Global Cardiac Muscle Injury Plasma Therapy Market, 2015-2025 (USD Million)
    7. 4.7. Nerve Injury
      1. 4.7.1. Global Nerve Injury Plasma Therapy Market, 2015-2025 (USD Million)
    8. 4.8. Others
      1. 4.8.1. Global Others Plasma Therapy Market, 2015-2025 (USD Million)
  5. CHAPTER 5. Plasma Therapy market – End User Analysis
    1. 5.1. Global Plasma Therapy Market – End User Overview
    2. 5.2. Global Plasma Therapy Market Share, by End User, 2018 & 2025 (USD Million)
    3. 5.3. Hospitals & Clinics
      1. 5.3.1. Global Hospitals & Clinics Plasma Therapy Market, 2015-2025 (USD Million)
    4. 5.4. Research Institutions
      1. 5.4.1. Global Research Institutions Plasma Therapy Market, 2015-2025 (USD Million)
  6. CHAPTER 6. Plasma Therapy market – Regional Analysis
    1. 6.1. Global Plasma Therapy Market Regional Overview
    2. 6.2. Global Plasma Therapy Market Share, by Region, 2018 & 2025 (Value)
    3. 6.3. North America
      1. 6.3.1. North America Plasma Therapy Market size and forecast, 2015-2025
      2. 6.3.2. North America Plasma Therapy Market, by Country, 2018 & 2025 (USD Million)
      3. 6.3.3. North America Plasma Therapy Market, by Type, 2015-2025
        1. 6.3.3.1. North America Plasma Therapy Market, by Type, 2015-2025 (USD Million)
      4. 6.3.4. North America Plasma Therapy Market, by Source, 2015-2025
        1. 6.3.4.1. North America Plasma Therapy Market, by Source, 2015-2025 (USD Million)
      5. 6.3.5. North America Plasma Therapy Market, by Application, 2015-2025
        1. 6.3.5.1. North America Plasma Therapy Market, by Application, 2015-2025 (USD Million)
      6. 6.3.6. North America Plasma Therapy Market, by End User, 2015-2025
        1. 6.3.6.1. North America Plasma Therapy Market, by End User, 2015-2025 (USD Million)
      7. 6.3.7. U.S.
        1. 6.3.7.1. U.S. Market size and forecast, 2015-2025 (USD Million)
      8. 6.3.8. Canada
        1. 6.3.8.1. Canada Market size and forecast, 2015-2025 (USD Million)
    4. 6.4. Europe
      1. 6.4.1. Europe Plasma Therapy Market size and forecast, 2015-2025
      2. 6.4.2. Europe Plasma Therapy Market, by Country, 2018 & 2025 (USD Million)
      3. 6.4.3. Europe Plasma Therapy Market, by Type, 2015-2025
        1. 6.4.3.1. Europe Plasma Therapy Market, by Type, 2015-2025 (USD Million)
      4. 6.4.4. Europe Plasma Therapy Market, by Source, 2015-2025
        1. 6.4.4.1. Europe Plasma Therapy Market, by Source, 2015-2025 (USD Million)
      5. 6.4.5. Europe Plasma Therapy Market, by Application, 2015-2025
        1. 6.4.5.1. Europe Plasma Therapy Market, by Application, 2015-2025 (USD Million)
      6. 6.4.6. Europe Plasma Therapy Market, by End User, 2015-2025
        1. 6.4.6.1. Europe Plasma Therapy Market, by End User, 2015-2025 (USD Million)
      7. 6.4.7. Germany
        1. 6.4.7.1. Germany Market size and forecast, 2015-2025 (USD Million)
      8. 6.4.8. France
        1. 6.4.8.1. France Market size and forecast, 2015-2025 (USD Million)
      9. 6.4.9. U.K.
        1. 6.4.9.1. U.K. Market size and forecast, 2015-2025 (USD Million)
      10. 6.4.10. Italy
        1. 6.4.10.1. Italy Market size and forecast, 2015-2025 (USD Million)
      11. 6.4.11. Spain
        1. 6.4.11.1. Spain Market size and forecast, 2015-2025 (USD Million)
      12. 6.4.12. Rest of Europe
        1. 6.4.12.1. Rest of Europe Market size and forecast, 2015-2025 (USD Million)
    5. 6.5. Asia Pacific
      1. 6.5.1. Asia Pacific Plasma Therapy Market size and forecast, 2015-2025
      2. 6.5.2. Asia Pacific Plasma Therapy Market, by Country, 2018 & 2025 (USD Million)
      3. 6.5.3. Asia Pacific Plasma Therapy Market, by Type, 2015-2025
        1. 6.5.3.1. Asia Pacific Plasma Therapy Market, by Type, 2015-2025 (USD Million)
      4. 6.5.4. Asia Pacific Plasma Therapy Market, by Source, 2015-2025
        1. 6.5.4.1. Asia Pacific Plasma Therapy Market, by Source, 2015-2025 (USD Million)
      5. 6.5.5. Asia Pacific Plasma Therapy Market, by Application, 2015-2025
        1. 6.5.5.1. Asia Pacific Plasma Therapy Market, by Application, 2015-2025 (USD Million)
      6. 6.5.6. Asia Pacific Plasma Therapy Market, by End User, 2015-2025
        1. 6.5.6.1. Asia Pacific Plasma Therapy Market, by End User, 2015-2025 (USD Million)
      7. 6.5.7. China
        1. 6.5.7.1. China Market size and forecast, 2015-2025 (USD Million)
      8. 6.5.8. Japan
        1. 6.5.8.1. Japan Market size and forecast, 2015-2025 (USD Million)
      9. 6.5.9. India
        1. 6.5.9.1. India Market size and forecast, 2015-2025 (USD Million)
      10. 6.5.10. South Korea
        1. 6.5.10.1. South Korea Market size and forecast, 2015-2025 (USD Million)
      11. 6.5.11. South-East Asia
        1. 6.5.11.1. South-East Asia Market size and forecast, 2015-2025 (USD Million)
      12. 6.5.12. Rest of Asia Pacific
        1. 6.5.12.1. Rest of Asia Pacific Market size and forecast, 2015-2025 (USD Million)
    6. 6.6. Latin America
      1. 6.6.1. Latin America Plasma Therapy Market size and forecast, 2015-2025
      2. 6.6.2. Latin America Plasma Therapy Market, by Country, 2018 & 2025 (USD Million)
      3. 6.6.3. Latin America Plasma Therapy Market, by Type, 2015-2025
        1. 6.6.3.1. Latin America Plasma Therapy Market, by Type, 2015-2025 (USD Million)
      4. 6.6.4. Latin America Plasma Therapy Market, by Source, 2015-2025
        1. 6.6.4.1. Latin America Plasma Therapy Market, by Source, 2015-2025 (USD Million)
      5. 6.6.5. Latin America Plasma Therapy Market, by Application, 2015-2025
        1. 6.6.5.1. Latin America Plasma Therapy Market, by Application, 2015-2025 (USD Million)
      6. 6.6.6. Latin America Plasma Therapy Market, by End User, 2015-2025
        1. 6.6.6.1. Latin America Plasma Therapy Market, by End User, 2015-2025 (USD Million)
      7. 6.6.7. Brazil
        1. 6.6.7.1. Brazil Market size and forecast, 2015-2025 (USD Million)
      8. 6.6.8. Mexico
        1. 6.6.8.1. Mexico Market size and forecast, 2015-2025 (USD Million)
      9. 6.6.9. Rest of Latin America
        1. 6.6.9.1. Rest of Latin America Market size and forecast, 2015-2025 (USD Million)
    7. 6.7. The Middle-East and Africa
      1. 6.7.1. The Middle-East and Africa Plasma Therapy Market size and forecast, 2015-2025
      2. 6.7.2. The Middle-East and Africa Plasma Therapy Market, by Country, 2018 & 2025 (USD Million)
      3. 6.7.3. The Middle-East and Africa Plasma Therapy Market, by Type, 2015-2025
        1. 6.7.3.1. The Middle-East and Africa Plasma Therapy Market, by Type, 2015-2025 (USD Million)
      4. 6.7.4. The Middle-East and Africa Plasma Therapy Market, by Source, 2015-2025
        1. 6.7.4.1. The Middle-East and Africa Plasma Therapy Market, by Source, 2015-2025 (USD Million)
      5. 6.7.5. The Middle-East and Africa Plasma Therapy Market, by Application, 2015-2025
        1. 6.7.5.1. The Middle-East and Africa Plasma Therapy Market, by Application, 2015-2025 (USD Million)
      6. 6.7.6. The Middle-East and Africa Plasma Therapy Market, by End User, 2015-2025
        1. 6.7.6.1. The Middle-East and Africa Plasma Therapy Market, by End User, 2015-2025 (USD Million)
      7. 6.7.7. GCC Countries
        1. 6.7.7.1. GCC Countries Market size and forecast, 2015-2025 (USD Million)
      8. 6.7.8. South Africa
        1. 6.7.8.1. South Africa Market size and forecast, 2015-2025 (USD Million)
      9. 6.7.9. Rest of Middle-East Africa
        1. 6.7.9.1. Rest of Middle-East Africa Market size and forecast, 2015-2025 (USD Million)
  7. CHAPTER 7. Plasma Therapy market – Competitive Landscape
    1. 7.1. Competitor Market Share – Revenue
    2. 7.2. Market Concentration Rate Analysis, Top 3 and Top 5 Players
    3. 7.3. Strategic Development
      1. 7.3.1. Acquisitions and Mergers
      2. 7.3.2. New Products
      3. 7.3.3. Research & Development Activities
  8. CHAPTER 8. Company Profiles
    1. 8.1. Arthrex, Inc.
      1. 8.1.1. Company Overview
      2. 8.1.2. Arthrex, Inc. Revenue and Gross Margin
      3. 8.1.3. Product portfolio
      4. 8.1.4. Recent initiatives
    2. 8.2. Bio Products Laboratory Ltd.
      1. 8.2.1. Company Overview
      2. 8.2.2. Bio Products Laboratory Ltd. Revenue and Gross Margin
      3. 8.2.3. Product portfolio
      4. 8.2.4. Recent initiatives
    3. 8.3. BioLife Plasma Services
      1. 8.3.1. Company Overview
      2. 8.3.2. BioLife Plasma Services Revenue and Gross Margin
      3. 8.3.3. Product portfolio
      4. 8.3.4. Recent initiatives
    4. 8.4. Biotest AG
      1. 8.4.1. Company Overview
      2. 8.4.2. Biotest AG Revenue and Gross Margin
      3. 8.4.3. Product portfolio
      4. 8.4.4. Recent initiatives
    5. 8.5. Cambryn Biologics LLC
      1. 8.5.1. Company Overview
      2. 8.5.2. Cambryn Biologics LLC Revenue and Gross Margin
      3. 8.5.3. Product portfolio
      4. 8.5.4. Recent initiatives
    6. 8.6. China Biologic Products Holdings, Inc.
      1. 8.6.1. Company Overview
      2. 8.6.2. China Biologic Products Holdings, Inc. Revenue and Gross Margin
      3. 8.6.3. Product portfolio
      4. 8.6.4. Recent initiatives
    7. 8.7. CSL Ltd.
      1. 8.7.1. Company Overview
      2. 8.7.2. CSL Ltd. Revenue and Gross Margin
      3. 8.7.3. Product portfolio
      4. 8.7.4. Recent initiatives
    8. 8.8. DePuy Synthes Companies
      1. 8.8.1. Company Overview
      2. 8.8.2. DePuy Synthes Companies Revenue and Gross Margin
      3. 8.8.3. Product portfolio
      4. 8.8.4. Recent initiatives
    9. 8.9. Grifols International S.A.
      1. 8.9.1. Company Overview
      2. 8.9.2. Grifols International S.A. Revenue and Gross Margin
      3. 8.9.3. Product portfolio
      4. 8.9.4. Recent initiatives
    10. 8.10. Kedrion S.p.A.
      1. 8.10.1. Company Overview
      2. 8.10.2. Kedrion S.p.A. Revenue and Gross Margin
      3. 8.10.3. Product portfolio
      4. 8.10.4. Recent initiatives
    11. 8.11. LFB
      1. 8.11.1. Company Overview
      2. 8.11.2. LFB Revenue and Gross Margin
      3. 8.11.3. Product portfolio
      4. 8.11.4. Recent initiatives
    12. 8.12. Octapharma
      1. 8.12.1. Company Overview
      2. 8.12.2. Octapharma Revenue and Gross Margin
      3. 8.12.3. Product portfolio
      4. 8.12.4. Recent initiatives
    13. 8.13. Regen Lab USA LLC
      1. 8.13.1. Company Overview
      2. 8.13.2. Regen Lab USA LLC Revenue and Gross Margin
      3. 8.13.3. Product portfolio
      4. 8.13.4. Recent initiatives
    14. 8.14. Stryker
      1. 8.14.1. Company Overview
      2. 8.14.2. Stryker Revenue and Gross Margin
      3. 8.14.3. Product portfolio
      4. 8.14.4. Recent initiatives
    15. 8.15. Takeda Pharmaceutical Company ltd
      1. 8.15.1. Company Overview
      2. 8.15.2. Takeda Pharmaceutical Company ltd Revenue and Gross Margin
      3. 8.15.3. Product portfolio
      4. 8.15.4. Recent initiatives
    16. 8.16. Terumo BCT, Inc.
      1. 8.16.1. Company Overview
      2. 8.16.2. Terumo BCT, Inc. Revenue and Gross Margin
      3. 8.16.3. Product portfolio
      4. 8.16.4. Recent initiatives
  9. CHAPTER 9. Plasma Therapy — Industry Analysis
    1. 9.1. Plasma Therapy Market – Key Trends
      1. 9.1.1. Market Drivers
      2. 9.1.2. Market Restraints
      3. 9.1.3. Market Opportunities
    2. 9.2. Value Chain Analysis
    3. 9.3. Technology Roadmap and Timeline
    4. 9.4. Plasma Therapy Market – Attractiveness Analysis
      1. 9.4.1. By Type
      2. 9.4.2. By Source
      3. 9.4.3. By Application
      4. 9.4.4. By End User
      5. 9.4.5. By Region
  10. CHAPTER 10. Marketing Strategy Analysis, Distributors
    1. 10.1. Marketing Channel
    2. 10.2. Direct Marketing
    3. 10.3. Indirect Marketing
    4. 10.4. Marketing Channel Development Trend
    5. 10.5. Economic/Political Environmental Change
  11. CHAPTER 11. Report Conclusion
  12. CHAPTER 12. Research Approach & Methodology
    1. 12.1. Report Description
    2. 12.2. Research Scope
    3. 12.3. Research Methodology
      1. 12.3.1. Secondary Research
      2. 12.3.2. Primary Research
      3. 12.3.3. Models
        1. 12.3.3.1. Company Share Analysis Model
        2. 12.3.3.2. Revenue Based Modeling
        3. 12.3.3.3. Research Limitations

        List of Figures

        FIG. 1 Global Plasma Therapy Market, 2015-2025 (USD Million)
        FIG. 2 Global Plasma Therapy Market Share, by Type, 2018 & 2025 (USD Million)
        FIG. 3 Global Pure PRP Plasma Therapy Market, 2015-2025 (USD Million)
        FIG. 4 Global Leucocyte-rich PRP Plasma Therapy Market, 2015-2025 (USD Million)
        FIG. 5 Global Pure Platelet-rich Fibrin (PRF) Plasma Therapy Market, 2015-2025 (USD Million)
        FIG. 6 Global Leukocyte-rich Fibrin (L-PRF) Plasma Therapy Market, 2015-2025 (USD Million)
        FIG. 7 Global Plasma Therapy Market Share, by Source, 2018 & 2025 (USD Million)
        FIG. 8 Global Autologous Plasma Therapy Market, 2015-2025 (USD Million)
        FIG. 9 Global Allogenic Plasma Therapy Market, 2015-2025 (USD Million)
        FIG. 10 Global Plasma Therapy Market Share, by Application, 2018 & 2025 (USD Million)
        FIG. 11 Global Orthopedics Plasma Therapy Market, 2015-2025 (USD Million)
        FIG. 12 Global Dermatology Plasma Therapy Market, 2015-2025 (USD Million)
        FIG. 13 Global Dental Plasma Therapy Market, 2015-2025 (USD Million)
        FIG. 14 Global Cardiac Muscle Injury Plasma Therapy Market, 2015-2025 (USD Million)
        FIG. 15 Global Nerve Injury Plasma Therapy Market, 2015-2025 (USD Million)
        FIG. 16 Global Others Plasma Therapy Market, 2015-2025 (USD Million)
        FIG. 17 Global Plasma Therapy Market Share, by End User, 2018 & 2025 (USD Million)
        FIG. 18 Global Hospitals & Clinics Plasma Therapy Market, 2015-2025 (USD Million)
        FIG. 19 Global Research Institutions Plasma Therapy Market, 2015-2025 (USD Million)
        FIG. 20 Global Plasma Therapy Market Share, by Region, 2018 & 2025
        FIG. 21 North America Plasma Therapy Market, 2015-2025
        FIG. 22 U.S. Plasma Therapy Market, 2015-2025
        FIG. 23 Canada Plasma Therapy Market, 2015-2025
        FIG. 24 Europe Plasma Therapy Market, 2015-2025
        FIG. 25 Germany Plasma Therapy Market, 2015-2025
        FIG. 26 France Plasma Therapy Market, 2015-2025
        FIG. 27 U.K. Plasma Therapy Market, 2015-2025
        FIG. 28 Italy Plasma Therapy Market, 2015-2025
        FIG. 29 Spain Plasma Therapy Market, 2015-2025
        FIG. 30 Rest of Europe Plasma Therapy Market, 2015-2025
        FIG. 31 Asia Pacific Plasma Therapy Market, 2015-2025
        FIG. 32 China Plasma Therapy Market, 2015-2025
        FIG. 33 Japan Plasma Therapy Market, 2015-2025
        FIG. 34 India Plasma Therapy Market, 2015-2025
        FIG. 35 South Korea Plasma Therapy Market, 2015-2025
        FIG. 36 South-East Asia Plasma Therapy Market, 2015-2025
        FIG. 37 Rest of Asia Pacific Plasma Therapy Market, 2015-2025
        FIG. 38 Latin America Plasma Therapy Market, 2015-2025
        FIG. 39 Brazil Plasma Therapy Market, 2015-2025
        FIG. 40 Mexico Plasma Therapy Market, 2015-2025
        FIG. 41 Rest of Latin America Plasma Therapy Market, 2015-2025
        FIG. 42 The Middle-East and Africa Plasma Therapy Market, 2015-2025
        FIG. 43 GCC Countries Plasma Therapy Market, 2015-2025
        FIG. 44 South Africa Plasma Therapy Market, 2015-2025
        FIG. 45 Rest of Middle-East Africa Plasma Therapy Market, 2015-2025
        FIG. 46 Competitor Market Share – Revenue
        FIG. 47 Arthrex, Inc. Revenue and Growth Rate
        FIG. 48 Arthrex, Inc. Market Share
        FIG. 49 Bio Products Laboratory Ltd. Revenue and Growth Rate
        FIG. 50 Bio Products Laboratory Ltd. Market Share
        FIG. 51 BioLife Plasma Services Revenue and Growth Rate
        FIG. 52 BioLife Plasma Services Market Share
        FIG. 53 Biotest AG Revenue and Growth Rate
        FIG. 54 Biotest AG Market Share
        FIG. 55 Cambryn Biologics LLC Revenue and Growth Rate
        FIG. 56 Cambryn Biologics LLC Market Share
        FIG. 57 China Biologic Products Holdings, Inc. Revenue and Growth Rate
        FIG. 58 China Biologic Products Holdings, Inc. Market Share
        FIG. 59 CSL Ltd. Revenue and Growth Rate
        FIG. 60 CSL Ltd. Market Share
        FIG. 61 DePuy Synthes Companies Revenue and Growth Rate
        FIG. 62 DePuy Synthes Companies Market Share
        FIG. 63 Grifols International S.A. Revenue and Growth Rate
        FIG. 64 Grifols International S.A. Market Share
        FIG. 65 Kedrion S.p.A. Revenue and Growth Rate
        FIG. 66 Kedrion S.p.A. Market Share
        FIG. 67 LFB Revenue and Growth Rate
        FIG. 68 LFB Market Share
        FIG. 69 Octapharma Revenue and Growth Rate
        FIG. 70 Octapharma Market Share
        FIG. 71 Regen Lab USA LLC Revenue and Growth Rate
        FIG. 72 Regen Lab USA LLC Market Share
        FIG. 73 Stryker Revenue and Growth Rate
        FIG. 74 Stryker Market Share
        FIG. 75 Takeda Pharmaceutical Company ltd Revenue and Growth Rate
        FIG. 76 Takeda Pharmaceutical Company ltd Market Share
        FIG. 77 Terumo BCT, Inc. Revenue and Growth Rate
        FIG. 78 Terumo BCT, Inc. Market Share
        FIG. 79 Market Dynamics
        FIG. 80 Global Plasma Therapy – Value Chain Analysis
        FIG. 81 Technology Roadmap and Timeline
        FIG. 82 Market Attractiveness Analysis – By Type
        FIG. 83 Market Attractiveness Analysis – By Source
        FIG. 84 Market Attractiveness Analysis – By Application
        FIG. 85 Market Attractiveness Analysis – By End User
        FIG. 86 Market Attractiveness Analysis – By Region
        FIG. 87 Market Channel
        FIG. 88 Marketing Channel Development Trend
        FIG. 89 Growth in World Gross Product, 2008-2018
        

        List of Tables

        TABLE 1 Global Plasma Therapy Market, 2018 & 2025 (USD Million)
        TABLE 2 Global Plasma Therapy market, by Type, 2015-2025 (USD Million)
        TABLE 3 Global Plasma Therapy market, by Source, 2015-2025 (USD Million)
        TABLE 4 Global Plasma Therapy market, by Application, 2015-2025 (USD Million)
        TABLE 5 Global Plasma Therapy market, by End User, 2015-2025 (USD Million)
        TABLE 6 Global Plasma Therapy market, by Region, 2015-2025 (USD Million)
        TABLE 7 North America Plasma Therapy Market, by Type, 2015-2025 (USD Million)
        TABLE 8 North America Plasma Therapy Market, by Source, 2015-2025 (USD Million)
        TABLE 9 North America Plasma Therapy Market, by Application, 2015-2025 (USD Million)
        TABLE 10 North America Plasma Therapy Market, by End User, 2015-2025 (USD Million)
        TABLE 11 Europe Plasma Therapy Market, by Type, 2015-2025 (USD Million)
        TABLE 12 Europe Plasma Therapy Market, by Source, 2015-2025 (USD Million)
        TABLE 13 Europe Plasma Therapy Market, by Application, 2015-2025 (USD Million)
        TABLE 14 Europe Plasma Therapy Market, by End User, 2015-2025 (USD Million)
        TABLE 15 Asia Pacific Plasma Therapy Market, by Type, 2015-2025 (USD Million)
        TABLE 16 Asia Pacific Plasma Therapy Market, by Source, 2015-2025 (USD Million)
        TABLE 17 Asia Pacific Plasma Therapy Market, by Application, 2015-2025 (USD Million)
        TABLE 18 Asia Pacific Plasma Therapy Market, by End User, 2015-2025 (USD Million)
        TABLE 19 Latin America Plasma Therapy Market, by Type, 2015-2025 (USD Million)
        TABLE 20 Latin America Plasma Therapy Market, by Source, 2015-2025 (USD Million)
        TABLE 21 Latin America Plasma Therapy Market, by Application, 2015-2025 (USD Million)
        TABLE 22 Latin America Plasma Therapy Market, by End User, 2015-2025 (USD Million)
        TABLE 23 The Middle-East and Africa Plasma Therapy Market, by Type, 2015-2025 (USD Million)
        TABLE 24 The Middle-East and Africa Plasma Therapy Market, by Source, 2015-2025 (USD Million)
        TABLE 25 The Middle-East and Africa Plasma Therapy Market, by Application, 2015-2025 (USD Million)
        TABLE 26 The Middle-East and Africa Plasma Therapy Market, by End User, 2015-2025 (USD Million)
        TABLE 27 Global Plasma Therapy Market - Company Revenue Analysis 2015-2018 (USD Million)
        TABLE 28 Global Plasma Therapy Market - Company Revenue Share Analysis 2015-2018(%)
        TABLE 29 Acquisitions and Mergers
        TABLE 30 New Product/Service Launch
        TABLE 31 Research & Development Activities
        TABLE 32 Market Drivers
        TABLE 33 Market Restraints
        TABLE 34 Market Opportunities


Industry Major Market Players

  •  Takeda Pharmaceutical Company ltd
  •  Arthrex Inc.
  •  BioLife Plasma Services
  •  Bio Products Laboratory Ltd.
  •  Cambryn Biologics LLC
  •  CSL Ltd.
  •  Biotest AG
  •  China Biologic Products Holdings Inc.
  •  DePuy Synthes Companies
  •  Kedrion S.p.A
  •  Grifols International S.A.
  •  LFB 
  •  Regen Lab USA LLC
  •  Octapharma
  •  Stryker
  •  Terumo BCT  Inc