Search Market Research Report

Discover Our Latest Reports
Discover Our Featured Reports
Discover Top Selling Reports

Phosphoric Acid Market Size, Share Global Analysis Report, 2020–2026

report img

Phosphoric Acid Market By Process Type (Wet Process, Thermal Process, and Others), By Grade (Food Grade, and Technical Grade), By Fertilizer Type (Mono-Ammonium Phosphate (MAP), Diammonium Phosphate (DAP), and Triple Superphosphate (TSP)) By Application (Home Cleaning Agents, and Fertilizer Chemicals), and End User (Electronics, Beverage, Medical, Food, Fertilizer, and Others): Global Industry Outlook, Market Size, Business Intelligence, Consumer Preferences, Statistical Surveys, Comprehensive Analysis, Historical Developments, Current Trends, and Forecast 2020–2026

Industry Insights

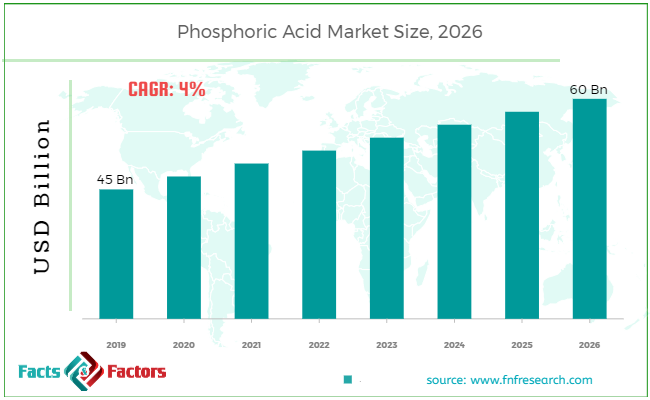
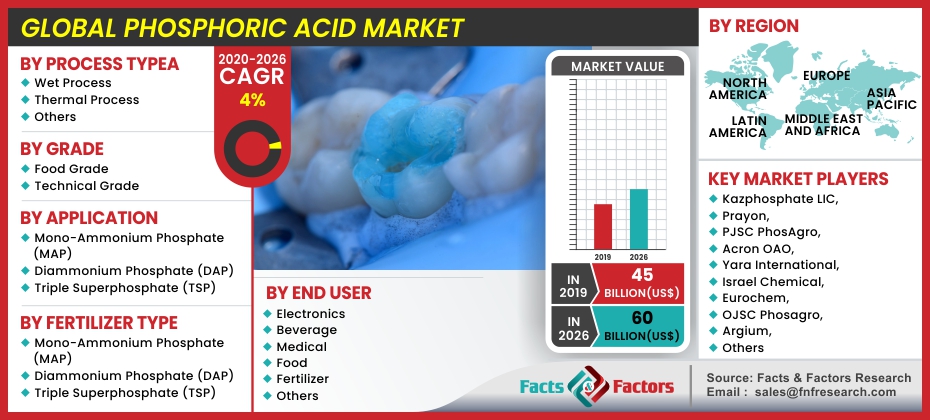
[185+ Pages Report] According to the report published by Facts Factors, the global phosphoric acid market size was worth around USD 45 billion in 2019 and is predicted to grow to around USD 60 billion by 2026 with a compound annual growth rate (CAGR) of roughly 4% between 2020 and 2026. The report analyzes the global phosphoric acid market drivers, restraints/challenges, and the effect they have on the demands during the projection period. In addition, the report explores emerging opportunities in the phosphoric acid market.

Phosphoric Acid Market Size

To know more about this report | Request Free Sample Copy

This specialized and expertise-oriented industry research report scrutinizes the technical and commercial business outlook of the Phosphoric Acid industry. The report analyzes and declares the historical and current trends analysis of the Phosphoric Acid industry and subsequently recommends the projected trends anticipated to be observed in the Phosphoric Acid market during the upcoming years.


logoKey Insights from Primary Research

  • From the primary research conducted by our analysts, fertilizer and food are the prominent end-user industries to tap.
  • In line with the response collected from the primary respondent, the global phosphoric acid market is estimated to grow at a CAGR of around 4 percent.
  • The market was at around USD 45 billion in 2019 and it is estimated to cross approximately USD 60 billion by 2026.
  • However, the growth of the fertilizer is estimated to be followed by the food, medical, and beverage industry
  • The Asia Pacific is projected to acquire a major contribution to the market with a market share of more than 50 percent.

logoKey Recommendations from Analysts

  • The wet process is the most common method of producing phosphoric acid and the acid produced from the wet process can be directly utilized by the fertilizer industry.
  • Food grade phosphoric acid is estimated to gain traction in the coming period. The demand from the agriculture industry is fueling the demand for food-grade acid.
  • The growing population across the globe is surging demand for food which is estimated to create a bolstering demand for fertilizers.
  • Asia Pacific market is estimated to dominate the market with around 50% of the market share. The growth of the agriculture industry within a region along with the availability of the raw materials in the region is propelling production as well as consumption in the market.

logo
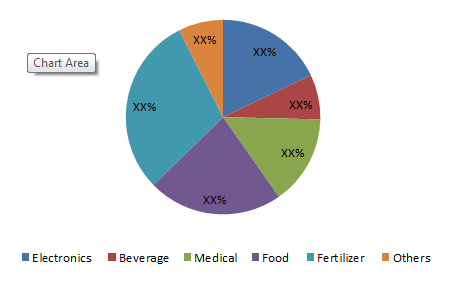
Market Share Phospheric Acid Market (2019)– By End-User

Phosphoric Acid Market

To know more about this report | Request Free Sample Copy


The Phosphoric Acid market report analyzes and notifies the industry statistics at the global as well as regional and country levels in order to acquire a thorough perspective of the entire Phosphoric Acid market. The historical and past insights are provided for FY 2016 to FY 2019 whereas projected trends are delivered for FY 2020 to FY 2026. The quantitative and numerical data is represented in terms of both volume (K Tons) and value (USD Million) from FY 2016 – 2026.

The quantitative data is further underlined and reinforced by comprehensive qualitative data which comprises various across-the-board market dynamics. The rationales which directly or indirectly impact the Phosphoric Acid industry are exemplified through parameters such as growth drivers, restraints, challenges, and opportunities among other impacting factors.

Phosphoric Acid Market

To know more about this report | Request Free Sample Copy

Throughout our research report, we have encompassed all the proven models and tools of industry analysis and extensively illustrated all the key business strategies and business models adopted in the Phosphoric Acid industry. The report provides an all-inclusive and detailed competitive landscape prevalent in the Phosphoric Acid market.

The report utilizes established industry analysis tools and models such as Porter’s Five Forces framework to analyze and recognize critical business strategies adopted by various stakeholders involved in the entire value chain of the Phosphoric Acid industry. The Phosphoric Acid market report additionally employs SWOT analysis and PESTLE analysis models for further in-depth analysis.

The report study further includes an in-depth analysis of industry players' market shares and provides an overview of leading players' market position in the Phosphoric Acid sector. Key strategic developments in the Phosphoric Acid market competitive landscape such as acquisitions & mergers, inaugurations of different products and services, partnerships & joint ventures, MoU agreements, VC & funding activities, R&D activities, and geographic expansion among other noteworthy activities by key players of the Phosphoric Acid market are appropriately highlighted in the report.

The Phosphoric Acid market research report delivers an acute valuation and taxonomy of the Phosphoric Acid industry by practically splitting the market on the basis of different types, applications, and regions. Through the analysis of the historical and projected trends, all the segments and sub-segments were evaluated through the bottom-up approach, and different market sizes have been projected for FY 2020 to FY 2026.

logoReport Scope

Report Attribute

Details

Market Size in 2019

USD 45 Billion

Projected Market Size in 2026

USD 60 Billion

CAGR Growth Rate

4% CAGR

Base Year

2019

Forecast Years

2020-2026

Key Market Players

Kazphosphate LIC, Prayon, PJSC PhosAgro, Acron OAO, Yara International, Israel Chemical, Eurochem, OJSC Phosagro, Argium, Nutrien, Potash Corp., CF Industries, OCP, Innophos Holdings, IFFCO, Laxness, Yuntianhua Group, Foskor, Solvay-Rhodia, Italmatch Chemicals, Jordan Phosphate Mines, Chemische Fabric Budenheim, Saudi-Arabian Mining Company, Vale, United Phosphorus, and The Mosaic Company, and Others

Key Segment

By Process, Grade, Application, Fertilizer, End User, and Region

Major Regions Covered

North America, Europe, Asia Pacific, Latin America, and the Middle East & Africa

Purchase Options

Request customized purchase options to meet your research needs.Explore purchase options

The regional segmentation of the Phosphoric Acid industry includes the complete classification of all the major continents including North America, Latin America, Europe, Asia Pacific, and the Middle East & Africa. Further, country-wise data for the Phosphoric Acid industry is provided for the leading economies of the world.

The Phosphoric Acid market is segmented based on process type, grade, application, fertilizer type, and end-user.  On the basis of process type segmentation, the market is classified into a wet process, thermal process, and others. Based on the grade market is split into the food-grade and technical grade.

In terms of Application segmentation, the market is divided into home cleaning agents, and fertilizer chemicals. Further, on the basis of Fertilizer type Market is segmented into mono-ammonium phosphate (MAP), diammonium phosphate (DAP), and triple superphosphate (TSP). Based on the end-user industry market is split into electronics, beverage, medical, food, fertilizer, and others.

logoSome of the leading players in the global market include

  • Kazphosphate LIC
  • Prayon
  • PJSC PhosAgro
  • Acron OAO
  • Yara International
  • Israel Chemical
  • Eurochem
  • OJSC Phosagro
  • Argium, Nutrien
  • Potash Corp.
  • CF Industries
  • OCP
  • Innophos Holdings
  • IFFCO
  • Laxness
  • Yuntianhua Group
  • Foskor
  • Solvay-Rhodia
  • Italmatch Chemicals
  • Jordan Phosphate Mines
  • Chemische Fabric Budenheim
  • Saudi-Arabian Mining Company
  • Vale
  • United Phosphorus
  • The Mosaic Company

The taxonomy of the Phosphoric Acid Market by its scope and segmentation is as follows:

logoBy Process Type Segmentation Analysis

  • Wet Process
  • Thermal Process
  • Others

logoBy Grade Segmentation Analysis

  • Food Grade
  • Technical Grade

logoBy Application Segmentation Analysis

  • Mono-Ammonium Phosphate (MAP)
  • Diammonium Phosphate (DAP)
  • Triple Superphosphate (TSP)

logoBy Fertilizer Type Segmentation Analysis

  • Mono-Ammonium Phosphate (MAP)
  • Diammonium Phosphate (DAP)
  • Triple Superphosphate (TSP)

logoBy End User Segmentation Analysis

  • Electronics
  • Beverage
  • Medical
  • Food
  • Fertilizer
  • Others

logoBy Regional Segmentation Analysis(Customizable)

  • North America
    • The U.S.
    • Canada
  • Europe
    • Germany
    • The UK
    • France
    • Spain
    • Italy
    • Rest of Europe
  • Asia Pacific
    • China
    • Japan
    • India
    • South Korea
    • Southeast Asia
    • Rest of Asia Pacific
  • Latin America
    • Brazil
    • Mexico
    • Rest of Latin America
  • Middle East & Africa
    • GCC
    • South Africa
    • Rest of Middle East & Africa

Table of Content

  1. Chapter 1 Executive Summary
    1. 1.1. Introduction of Phosphoric Acid
    2. 1.2. Global Phosphoric Acid Market, 2019 & 2026 (USD Million)
    3. 1.3. Global Phosphoric Acid Market, 2016 – 2026 (USD Million) (K Tons)
    4. 1.4. Global Phosphoric Acid Market Absolute Revenue Opportunity, 2016 – 2026 (USD Million)
    5. 1.5. Global Phosphoric Acid Market Incremental Revenue Opportunity, 2020 – 2026 (USD Million)
  2. Chapter 2 Phosphoric Acid Market – Process Type Analysis
    1. 2.1. Global Phosphoric Acid Market – Process Type Overview
    2. 2.2. Global Phosphoric Acid Market Share, by Process Type, 2019 & 2026 (USD Million)
    3. 2.3. Global Phosphoric Acid Market share, by Process Type, 2019 & 2026 (K Tons)
    4. 2.4. Wet Process
      1. 2.4.1. Global Wet Process Phosphoric Acid Market, 2016 – 2026 (USD Million)
      2. 2.4.2. Global Wet Process Phosphoric Acid Market, 2016 – 2026 (K Tons)
    5. 2.5. Thermal Process
      1. 2.5.1. Global Thermal Process Phosphoric Acid Market, 2016 – 2026 (USD Million)
      2. 2.5.2. Global Thermal Process Phosphoric Acid Market, 2016 – 2026 (K Tons)
    6. 2.6. Others
      1. 2.6.1. Global Others Phosphoric Acid Market, 2016 – 2026 (USD Million)
      2. 2.6.2. Global Others Phosphoric Acid Market, 2016 – 2026 (K Tons)
  3. Chapter 3 Phosphoric Acid Market – Grade Analysis
    1. 3.1. Global Phosphoric Acid Market – Grade Overview
    2. 3.2. Global Phosphoric Acid Market Share, by Grade, 2019 & 2026 (USD Million)
    3. 3.3. Global Phosphoric Acid Market share, by Grade, 2019 & 2026 (K Tons)
    4. 3.4. Food Grade
      1. 3.4.1. Global Food Grade Phosphoric Acid Market, 2016 – 2026 (USD Million)
      2. 3.4.2. Global Food Grade Phosphoric Acid Market, 2016 – 2026 (K Tons)
    5. 3.5. Technical Grade
      1. 3.5.1. Global Technical Grade Phosphoric Acid Market, 2016 – 2026 (USD Million)
      2. 3.5.2. Global Technical Grade Phosphoric Acid Market, 2016 – 2026 (K Tons)
  4. Chapter 4 Phosphoric Acid Market – Application Analysis
    1. 4.1. Global Phosphoric Acid Market – Application Overview
    2. 4.2. Global Phosphoric Acid Market Share, by Application, 2019 & 2026 (USD Million)
    3. 4.3. Global Phosphoric Acid Market share, by Application, 2019 & 2026 (K Tons)
    4. 4.4. Home Cleaning Agents
      1. 4.4.1. Global Home Cleaning Agents Phosphoric Acid Market, 2016 – 2026 (USD Million)
      2. 4.4.2. Global Home Cleaning Agents Phosphoric Acid Market, 2016 – 2026 (K Tons)
    5. 4.5. Fertilizer Chemicals
      1. 4.5.1. Global Fertilizer Chemicals Phosphoric Acid Market, 2016 – 2026 (USD Million)
      2. 4.5.2. Global Fertilizer Chemicals Phosphoric Acid Market, 2016 – 2026 (K Tons)
  5. Chapter 5 Phosphoric Acid Market – Fertiilizer Type Analysis
    1. 5.1. Global Phosphoric Acid Market – Fertiilizer Type Overview
    2. 5.2. Global Phosphoric Acid Market Share, by Fertiilizer Type, 2019 & 2026 (USD Million)
    3. 5.3. Global Phosphoric Acid Market share, by Fertiilizer Type, 2019 & 2026 (K Tons)
    4. 5.4. Mono-Ammonium Phosphate (MAP)
      1. 5.4.1. Global Mono-Ammonium Phosphate (MAP) Phosphoric Acid Market, 2016 – 2026 (USD Million)
      2. 5.4.2. Global Mono-Ammonium Phosphate (MAP) Phosphoric Acid Market, 2016 – 2026 (K Tons)
    5. 5.5. Diammonium Phosphate (DAP)
      1. 5.5.1. Global Diammonium Phosphate (DAP) Phosphoric Acid Market, 2016 – 2026 (USD Million)
      2. 5.5.2. Global Diammonium Phosphate (DAP) Phosphoric Acid Market, 2016 – 2026 (K Tons)
    6. 5.6. Triple Superphosphate (TSP)
      1. 5.6.1. Global Triple Superphosphate (TSP) Phosphoric Acid Market, 2016 – 2026 (USD Million)
      2. 5.6.2. Global Triple Superphosphate (TSP) Phosphoric Acid Market, 2016 – 2026 (K Tons)
  6. Chapter 6 Phosphoric Acid Market – End User Analysis
    1. 6.1. Global Phosphoric Acid Market – End User Overview
    2. 6.2. Global Phosphoric Acid Market Share, by End User, 2019 & 2026 (USD Million)
    3. 6.3. Global Phosphoric Acid Market share, by End User, 2019 & 2026 (K Tons)
    4. 6.4. Electronics
      1. 6.4.1. Global Electronics Phosphoric Acid Market, 2016 – 2026 (USD Million)
      2. 6.4.2. Global Electronics Phosphoric Acid Market, 2016 – 2026 (K Tons)
    5. 6.5. Beverage
      1. 6.5.1. Global Beverage Phosphoric Acid Market, 2016 – 2026 (USD Million)
      2. 6.5.2. Global Beverage Phosphoric Acid Market, 2016 – 2026 (K Tons)
    6. 6.6. Medical
      1. 6.6.1. Global Medical Phosphoric Acid Market, 2016 – 2026 (USD Million)
      2. 6.6.2. Global Medical Phosphoric Acid Market, 2016 – 2026 (K Tons)
    7. 6.7. Food
      1. 6.7.1. Global Food Phosphoric Acid Market, 2016 – 2026 (USD Million)
      2. 6.7.2. Global Food Phosphoric Acid Market, 2016 – 2026 (K Tons)
    8. 6.8. Fertilizer
      1. 6.8.1. Global Fertilizer Phosphoric Acid Market, 2016 – 2026 (USD Million)
      2. 6.8.2. Global Fertilizer Phosphoric Acid Market, 2016 – 2026 (K Tons)
    9. 6.9. Others
      1. 6.9.1. Global Others Phosphoric Acid Market, 2016 – 2026 (USD Million)
      2. 6.9.2. Global Others Phosphoric Acid Market, 2016 – 2026 (K Tons)
  7. Chapter 7 Phosphoric Acid Market – Regional Analysis
    1. 7.1. Global Phosphoric Acid Market Regional Overview
    2. 7.2. Global Phosphoric Acid Market Share, by Region, 2019 & 2026 (USD Million)
    3. 7.3. Global Phosphoric Acid Market Share, by Region, 2019 & 2026 (K Tons)
    4. 7.4. North America
      1. 7.4.1. North America Phosphoric Acid Market, 2016 – 2026 (USD Million)
        1. 7.4.1.1. North America Phosphoric Acid Market, by Country, 2016 – 2026 (USD Million)
      2. 7.4.2. North America Market, 2016 – 2026 (K Tons)
        1. 7.4.2.1. North America Phosphoric Acid Market, by Country, 2016 – 2026 (K Tons)
      3. 7.4.3. North America Phosphoric Acid Market, by Process Type, 2016 – 2026
        1. 7.4.3.1. North America Phosphoric Acid Market, by Process Type, 2016 – 2026 (USD Million)
        2. 7.4.3.2. North America Phosphoric Acid Market, by Process Type, 2016 – 2026 (K Tons)
      4. 7.4.4. North America Phosphoric Acid Market, by Grade, 2016 – 2026
        1. 7.4.4.1. North America Phosphoric Acid Market, by Grade, 2016 – 2026 (USD Million)
        2. 7.4.4.2. North America Phosphoric Acid Market, by Grade, 2016 – 2026 (K Tons)
      5. 7.4.5. North America Phosphoric Acid Market, by Application, 2016 – 2026
        1. 7.4.5.1. North America Phosphoric Acid Market, by Application, 2016 – 2026 (USD Million)
        2. 7.4.5.2. North America Phosphoric Acid Market, by Application, 2016 – 2026 (K Tons)
      6. 7.4.6. North America Phosphoric Acid Market, by Fertiilizer Type, 2016 – 2026
        1. 7.4.6.1. North America Phosphoric Acid Market, by Fertiilizer Type, 2016 – 2026 (USD Million)
        2. 7.4.6.2. North America Phosphoric Acid Market, by Fertiilizer Type, 2016 – 2026 (K Tons)
      7. 7.4.7. North America Phosphoric Acid Market, by End User, 2016 – 2026
        1. 7.4.7.1. North America Phosphoric Acid Market, by End User, 2016 – 2026 (USD Million)
        2. 7.4.7.2. North America Phosphoric Acid Market, by End User, 2016 – 2026 (K Tons)
      8. 7.4.8. U.S.
        1. 7.4.8.1. U.S. Phosphoric Acid Market, 2016 – 2026 (USD Million)
        2. 7.4.8.2. U.S. Phosphoric Acid Market, 2016 – 2026 (K Tons)
      9. 7.4.9. Canada
        1. 7.4.9.1. Canada Phosphoric Acid Market, 2016 – 2026 (USD Million)
        2. 7.4.9.2. Canada Phosphoric Acid Market, 2016 – 2026 (K Tons)
    5. 7.5. Europe
      1. 7.5.1. Europe Phosphoric Acid Market, 2016 – 2026 (USD Million)
        1. 7.5.1.1. Europe Phosphoric Acid Market, by Country, 2016 – 2026 (USD Million)
      2. 7.5.2. Europe Market, 2016 – 2026 (K Tons)
        1. 7.5.2.1. Europe Phosphoric Acid Market, by Country, 2016 – 2026 (K Tons)
      3. 7.5.3. Europe Phosphoric Acid Market, by Process Type, 2016 – 2026
        1. 7.5.3.1. Europe Phosphoric Acid Market, by Process Type, 2016 – 2026 (USD Million)
        2. 7.5.3.2. Europe Phosphoric Acid Market, by Process Type, 2016 – 2026 (K Tons)
      4. 7.5.4. Europe Phosphoric Acid Market, by Grade, 2016 – 2026
        1. 7.5.4.1. Europe Phosphoric Acid Market, by Grade, 2016 – 2026 (USD Million)
        2. 7.5.4.2. Europe Phosphoric Acid Market, by Grade, 2016 – 2026 (K Tons)
      5. 7.5.5. Europe Phosphoric Acid Market, by Application, 2016 – 2026
        1. 7.5.5.1. Europe Phosphoric Acid Market, by Application, 2016 – 2026 (USD Million)
        2. 7.5.5.2. Europe Phosphoric Acid Market, by Application, 2016 – 2026 (K Tons)
      6. 7.5.6. Europe Phosphoric Acid Market, by Fertiilizer Type, 2016 – 2026
        1. 7.5.6.1. Europe Phosphoric Acid Market, by Fertiilizer Type, 2016 – 2026 (USD Million)
        2. 7.5.6.2. Europe Phosphoric Acid Market, by Fertiilizer Type, 2016 – 2026 (K Tons)
      7. 7.5.7. Europe Phosphoric Acid Market, by End User, 2016 – 2026
        1. 7.5.7.1. Europe Phosphoric Acid Market, by End User, 2016 – 2026 (USD Million)
        2. 7.5.7.2. Europe Phosphoric Acid Market, by End User, 2016 – 2026 (K Tons)
      8. 7.5.8. Germany
        1. 7.5.8.1. Germany Phosphoric Acid Market, 2016 – 2026 (USD Million)
        2. 7.5.8.2. Germany Phosphoric Acid Market, 2016 – 2026 (K Tons)
      9. 7.5.9. France
        1. 7.5.9.1. France Phosphoric Acid Market, 2016 – 2026 (USD Million)
        2. 7.5.9.2. France Phosphoric Acid Market, 2016 – 2026 (K Tons)
      10. 7.5.10. U.K.
        1. 7.5.10.1. U.K. Phosphoric Acid Market, 2016 – 2026 (USD Million)
        2. 7.5.10.2. U.K. Phosphoric Acid Market, 2016 – 2026 (K Tons)
      11. 7.5.11. Italy
        1. 7.5.11.1. Italy Phosphoric Acid Market, 2016 – 2026 (USD Million)
        2. 7.5.11.2. Italy Phosphoric Acid Market, 2016 – 2026 (K Tons)
      12. 7.5.12. Spain
        1. 7.5.12.1. Spain Phosphoric Acid Market, 2016 – 2026 (USD Million)
        2. 7.5.12.2. Spain Phosphoric Acid Market, 2016 – 2026 (K Tons)
      13. 7.5.13. Rest of Europe
        1. 7.5.13.1. Rest of Europe Phosphoric Acid Market, 2016 – 2026 (USD Million)
        2. 7.5.13.2. Rest of Europe Phosphoric Acid Market, 2016 – 2026 (K Tons)
    6. 7.6. Asia Pacific
      1. 7.6.1. Asia Pacific Phosphoric Acid Market, 2016 – 2026 (USD Million)
        1. 7.6.1.1. Asia Pacific Phosphoric Acid Market, by Country, 2016 – 2026 (USD Million)
      2. 7.6.2. Asia Pacific Market, 2016 – 2026 (K Tons)
        1. 7.6.2.1. Asia Pacific Phosphoric Acid Market, by Country, 2016 – 2026 (K Tons)
      3. 7.6.3. Asia Pacific Phosphoric Acid Market, by Process Type, 2016 – 2026
        1. 7.6.3.1. Asia Pacific Phosphoric Acid Market, by Process Type, 2016 – 2026 (USD Million)
        2. 7.6.3.2. Asia Pacific Phosphoric Acid Market, by Process Type, 2016 – 2026 (K Tons)
      4. 7.6.4. Asia Pacific Phosphoric Acid Market, by Grade, 2016 – 2026
        1. 7.6.4.1. Asia Pacific Phosphoric Acid Market, by Grade, 2016 – 2026 (USD Million)
        2. 7.6.4.2. Asia Pacific Phosphoric Acid Market, by Grade, 2016 – 2026 (K Tons)
      5. 7.6.5. Asia Pacific Phosphoric Acid Market, by Application, 2016 – 2026
        1. 7.6.5.1. Asia Pacific Phosphoric Acid Market, by Application, 2016 – 2026 (USD Million)
        2. 7.6.5.2. Asia Pacific Phosphoric Acid Market, by Application, 2016 – 2026 (K Tons)
      6. 7.6.6. Asia Pacific Phosphoric Acid Market, by Fertiilizer Type, 2016 – 2026
        1. 7.6.6.1. Asia Pacific Phosphoric Acid Market, by Fertiilizer Type, 2016 – 2026 (USD Million)
        2. 7.6.6.2. Asia Pacific Phosphoric Acid Market, by Fertiilizer Type, 2016 – 2026 (K Tons)
      7. 7.6.7. Asia Pacific Phosphoric Acid Market, by End User, 2016 – 2026
        1. 7.6.7.1. Asia Pacific Phosphoric Acid Market, by End User, 2016 – 2026 (USD Million)
        2. 7.6.7.2. Asia Pacific Phosphoric Acid Market, by End User, 2016 – 2026 (K Tons)
      8. 7.6.8. China
        1. 7.6.8.1. China Phosphoric Acid Market, 2016 – 2026 (USD Million)
        2. 7.6.8.2. China Phosphoric Acid Market, 2016 – 2026 (K Tons)
      9. 7.6.9. Japan
        1. 7.6.9.1. Japan Phosphoric Acid Market, 2016 – 2026 (USD Million)
        2. 7.6.9.2. Japan Phosphoric Acid Market, 2016 – 2026 (K Tons)
      10. 7.6.10. India
        1. 7.6.10.1. India Phosphoric Acid Market, 2016 – 2026 (USD Million)
        2. 7.6.10.2. India Phosphoric Acid Market, 2016 – 2026 (K Tons)
      11. 7.6.11. South Korea
        1. 7.6.11.1. South Korea Phosphoric Acid Market, 2016 – 2026 (USD Million)
        2. 7.6.11.2. South Korea Phosphoric Acid Market, 2016 – 2026 (K Tons)
      12. 7.6.12. South-East Asia
        1. 7.6.12.1. South-East Asia Phosphoric Acid Market, 2016 – 2026 (USD Million)
        2. 7.6.12.2. South-East Asia Phosphoric Acid Market, 2016 – 2026 (K Tons)
      13. 7.6.13. Rest of Asia Pacific
        1. 7.6.13.1. Rest of Asia Pacific Phosphoric Acid Market, 2016 – 2026 (USD Million)
        2. 7.6.13.2. Rest of Asia Pacific Phosphoric Acid Market, 2016 – 2026 (K Tons)
    7. 7.7. Latin America
      1. 7.7.1. Latin America Phosphoric Acid Market, 2016 – 2026 (USD Million)
        1. 7.7.1.1. Latin America Phosphoric Acid Market, by Country, 2016 – 2026 (USD Million)
      2. 7.7.2. Latin America Market, 2016 – 2026 (K Tons)
        1. 7.7.2.1. Latin America Phosphoric Acid Market, by Country, 2016 – 2026 (K Tons)
      3. 7.7.3. Latin America Phosphoric Acid Market, by Process Type, 2016 – 2026
        1. 7.7.3.1. Latin America Phosphoric Acid Market, by Process Type, 2016 – 2026 (USD Million)
        2. 7.7.3.2. Latin America Phosphoric Acid Market, by Process Type, 2016 – 2026 (K Tons)
      4. 7.7.4. Latin America Phosphoric Acid Market, by Grade, 2016 – 2026
        1. 7.7.4.1. Latin America Phosphoric Acid Market, by Grade, 2016 – 2026 (USD Million)
        2. 7.7.4.2. Latin America Phosphoric Acid Market, by Grade, 2016 – 2026 (K Tons)
      5. 7.7.5. Latin America Phosphoric Acid Market, by Application, 2016 – 2026
        1. 7.7.5.1. Latin America Phosphoric Acid Market, by Application, 2016 – 2026 (USD Million)
        2. 7.7.5.2. Latin America Phosphoric Acid Market, by Application, 2016 – 2026 (K Tons)
      6. 7.7.6. Latin America Phosphoric Acid Market, by Fertiilizer Type, 2016 – 2026
        1. 7.7.6.1. Latin America Phosphoric Acid Market, by Fertiilizer Type, 2016 – 2026 (USD Million)
        2. 7.7.6.2. Latin America Phosphoric Acid Market, by Fertiilizer Type, 2016 – 2026 (K Tons)
      7. 7.7.7. Latin America Phosphoric Acid Market, by End User, 2016 – 2026
        1. 7.7.7.1. Latin America Phosphoric Acid Market, by End User, 2016 – 2026 (USD Million)
        2. 7.7.7.2. Latin America Phosphoric Acid Market, by End User, 2016 – 2026 (K Tons)
      8. 7.7.8. Brazil
        1. 7.7.8.1. Brazil Phosphoric Acid Market, 2016 – 2026 (USD Million)
        2. 7.7.8.2. Brazil Phosphoric Acid Market, 2016 – 2026 (K Tons)
      9. 7.7.9. Mexico
        1. 7.7.9.1. Mexico Phosphoric Acid Market, 2016 – 2026 (USD Million)
        2. 7.7.9.2. Mexico Phosphoric Acid Market, 2016 – 2026 (K Tons)
      10. 7.7.10. Rest of Latin America
        1. 7.7.10.1. Rest of Latin America Phosphoric Acid Market, 2016 – 2026 (USD Million)
        2. 7.7.10.2. Rest of Latin America Phosphoric Acid Market, 2016 – 2026 (K Tons)
    8. 7.8. The Middle-East and Africa
      1. 7.8.1. The Middle-East and Africa Phosphoric Acid Market, 2016 – 2026 (USD Million)
        1. 7.8.1.1. The Middle-East and Africa Phosphoric Acid Market, by Country, 2016 – 2026 (USD Million)
      2. 7.8.2. The Middle-East and Africa Market, 2016 – 2026 (K Tons)
        1. 7.8.2.1. The Middle-East and Africa Phosphoric Acid Market, by Country, 2016 – 2026 (K Tons)
      3. 7.8.3. The Middle-East and Africa Phosphoric Acid Market, by Process Type, 2016 – 2026
        1. 7.8.3.1. The Middle-East and Africa Phosphoric Acid Market, by Process Type, 2016 – 2026 (USD Million)
        2. 7.8.3.2. The Middle-East and Africa Phosphoric Acid Market, by Process Type, 2016 – 2026 (K Tons)
      4. 7.8.4. The Middle-East and Africa Phosphoric Acid Market, by Grade, 2016 – 2026
        1. 7.8.4.1. The Middle-East and Africa Phosphoric Acid Market, by Grade, 2016 – 2026 (USD Million)
        2. 7.8.4.2. The Middle-East and Africa Phosphoric Acid Market, by Grade, 2016 – 2026 (K Tons)
      5. 7.8.5. The Middle-East and Africa Phosphoric Acid Market, by Application, 2016 – 2026
        1. 7.8.5.1. The Middle-East and Africa Phosphoric Acid Market, by Application, 2016 – 2026 (USD Million)
        2. 7.8.5.2. The Middle-East and Africa Phosphoric Acid Market, by Application, 2016 – 2026 (K Tons)
      6. 7.8.6. The Middle-East and Africa Phosphoric Acid Market, by Fertiilizer Type, 2016 – 2026
        1. 7.8.6.1. The Middle-East and Africa Phosphoric Acid Market, by Fertiilizer Type, 2016 – 2026 (USD Million)
        2. 7.8.6.2. The Middle-East and Africa Phosphoric Acid Market, by Fertiilizer Type, 2016 – 2026 (K Tons)
      7. 7.8.7. The Middle-East and Africa Phosphoric Acid Market, by End User, 2016 – 2026
        1. 7.8.7.1. The Middle-East and Africa Phosphoric Acid Market, by End User, 2016 – 2026 (USD Million)
        2. 7.8.7.2. The Middle-East and Africa Phosphoric Acid Market, by End User, 2016 – 2026 (K Tons)
      8. 7.8.8. GCC Countries
        1. 7.8.8.1. GCC Countries Phosphoric Acid Market, 2016 – 2026 (USD Million)
        2. 7.8.8.2. GCC Countries Phosphoric Acid Market, 2016 – 2026 (K Tons)
      9. 7.8.9. South Africa
        1. 7.8.9.1. South Africa Phosphoric Acid Market, 2016 – 2026 (USD Million)
        2. 7.8.9.2. South Africa Phosphoric Acid Market, 2016 – 2026 (K Tons)
      10. 7.8.10. Rest of Middle-East Africa
        1. 7.8.10.1. Rest of Middle-East Africa Phosphoric Acid Market, 2016 – 2026 (USD Million)
        2. 7.8.10.2. Rest of Middle-East Africa Phosphoric Acid Market, 2016 – 2026 (K Tons)
  8. Chapter 8 Phosphoric Acid Production, Consumption, Export, Import by Regions
    1. 8.1. Global Phosphoric Acid Production and Consumption, 2016 – 2026 (K Tons)
    2. 8.2. Global Import and Export Analysis, by Region
  9. Chapter 9 Phosphoric Acid Market – Competitive Landscape
    1. 9.1. Competitor Market Share – Revenue
    2. 9.2. Market Concentration Rate Analysis, Top 3 and Top 5 Players
    3. 9.3. Competitor Market Share – Volume
    4. 9.4. Strategic Developments
      1. 9.4.1. Acquisitions and Mergers
      2. 9.4.2. New Products
      3. 9.4.3. Research & Development Activities
  10. Chapter 10 Company Profiles
    1. 10.1. Kazphosphate LIC
      1. 10.1.1. Company Overview
      2. 10.1.2. Product/Service Portfolio
      3. 10.1.3. Kazphosphate LIC Sales, Revenue, Price, and Gross Margin
      4. 10.1.4. Kazphosphate LIC Revenue and Growth Rate
      5. 10.1.5. Kazphosphate LIC Market Share
      6. 10.1.6. Recent Initiatives, Funding/VC Activities, and Technological Innovations
    2. 10.2. Prayon
      1. 10.2.1. Company Overview
      2. 10.2.2. Product/Service Portfolio
      3. 10.2.3. Prayon Sales, Revenue, Price, and Gross Margin
      4. 10.2.4. Prayon Revenue and Growth Rate
      5. 10.2.5. Prayon Market Share
      6. 10.2.6. Recent Initiatives, Funding/VC Activities, and Technological Innovations
    3. 10.3. PJSC PhosAgro
      1. 10.3.1. Company Overview
      2. 10.3.2. Product/Service Portfolio
      3. 10.3.3. PJSC PhosAgro Sales, Revenue, Price, and Gross Margin
      4. 10.3.4. PJSC PhosAgro Revenue and Growth Rate
      5. 10.3.5. PJSC PhosAgro Market Share
      6. 10.3.6. Recent Initiatives, Funding/VC Activities, and Technological Innovations
    4. 10.4. Acron OAO
      1. 10.4.1. Company Overview
      2. 10.4.2. Product/Service Portfolio
      3. 10.4.3. Acron OAO Sales, Revenue, Price, and Gross Margin
      4. 10.4.4. Acron OAO Revenue and Growth Rate
      5. 10.4.5. Acron OAO Market Share
      6. 10.4.6. Recent Initiatives, Funding/VC Activities, and Technological Innovations
    5. 10.5. Yara International
      1. 10.5.1. Company Overview
      2. 10.5.2. Product/Service Portfolio
      3. 10.5.3. Yara International Sales, Revenue, Price, and Gross Margin
      4. 10.5.4. Yara International Revenue and Growth Rate
      5. 10.5.5. Yara International Market Share
      6. 10.5.6. Recent Initiatives, Funding/VC Activities, and Technological Innovations
    6. 10.6. Israel Chemical
      1. 10.6.1. Company Overview
      2. 10.6.2. Product/Service Portfolio
      3. 10.6.3. Israel Chemical Sales, Revenue, Price, and Gross Margin
      4. 10.6.4. Israel Chemical Revenue and Growth Rate
      5. 10.6.5. Israel Chemical Market Share
      6. 10.6.6. Recent Initiatives, Funding/VC Activities, and Technological Innovations
    7. 10.7. Eurochem
      1. 10.7.1. Company Overview
      2. 10.7.2. Product/Service Portfolio
      3. 10.7.3. Eurochem Sales, Revenue, Price, and Gross Margin
      4. 10.7.4. Eurochem Revenue and Growth Rate
      5. 10.7.5. Eurochem Market Share
      6. 10.7.6. Recent Initiatives, Funding/VC Activities, and Technological Innovations
    8. 10.8. OJSC Phosagro
      1. 10.8.1. Company Overview
      2. 10.8.2. Product/Service Portfolio
      3. 10.8.3. OJSC Phosagro Sales, Revenue, Price, and Gross Margin
      4. 10.8.4. OJSC Phosagro Revenue and Growth Rate
      5. 10.8.5. OJSC Phosagro Market Share
      6. 10.8.6. Recent Initiatives, Funding/VC Activities, and Technological Innovations
    9. 10.9. Argium
      1. 10.9.1. Company Overview
      2. 10.9.2. Product/Service Portfolio
      3. 10.9.3. Argium Sales, Revenue, Price, and Gross Margin
      4. 10.9.4. Argium Revenue and Growth Rate
      5. 10.9.5. Argium Market Share
      6. 10.9.6. Recent Initiatives, Funding/VC Activities, and Technological Innovations
    10. 10.10. Nutrien
      1. 10.10.1.Company Overview
      2. 10.10.2.Product/Service Portfolio
      3. 10.10.3.Nutrien Sales, Revenue, Price, and Gross Margin
      4. 10.10.4.Nutrien Revenue and Growth Rate
      5. 10.10.5.Nutrien Market Share
      6. 10.10.6.Recent Initiatives, Funding/VC Activities, and Technological Innovations
    11. 10.11. Potash Corp.
      1. 10.11.1.Company Overview
      2. 10.11.2.Product/Service Portfolio
      3. 10.11.3.Potash Corp. Sales, Revenue, Price, and Gross Margin
      4. 10.11.4.Potash Corp. Revenue and Growth Rate
      5. 10.11.5.Potash Corp. Market Share
      6. 10.11.6.Recent Initiatives, Funding/VC Activities, and Technological Innovations
    12. 10.12. CF Industries
      1. 10.12.1.Company Overview
      2. 10.12.2.Product/Service Portfolio
      3. 10.12.3.CF Industries Sales, Revenue, Price, and Gross Margin
      4. 10.12.4.CF Industries Revenue and Growth Rate
      5. 10.12.5.CF Industries Market Share
      6. 10.12.6.Recent Initiatives, Funding/VC Activities, and Technological Innovations
    13. 10.13. OCP
      1. 10.13.1.Company Overview
      2. 10.13.2.Product/Service Portfolio
      3. 10.13.3.OCP Sales, Revenue, Price, and Gross Margin
      4. 10.13.4.OCP Revenue and Growth Rate
      5. 10.13.5.OCP Market Share
      6. 10.13.6.Recent Initiatives, Funding/VC Activities, and Technological Innovations
    14. 10.14. Innophos Holding
      1. 10.14.1.Company Overview
      2. 10.14.2.Product/Service Portfolio
      3. 10.14.3.Innophos Holding Sales, Revenue, Price, and Gross Margin
      4. 10.14.4.Innophos Holding Revenue and Growth Rate
      5. 10.14.5.Innophos Holding Market Share
      6. 10.14.6.Recent Initiatives, Funding/VC Activities, and Technological Innovations
    15. 10.15. IFFCO
      1. 10.15.1.Company Overview
      2. 10.15.2.Product/Service Portfolio
      3. 10.15.3.IFFCO Sales, Revenue, Price, and Gross Margin
      4. 10.15.4.IFFCO Revenue and Growth Rate
      5. 10.15.5.IFFCO Market Share
      6. 10.15.6.Recent Initiatives, Funding/VC Activities, and Technological Innovations
    16. 10.16. Laxness
      1. 10.16.1.Company Overview
      2. 10.16.2.Product/Service Portfolio
      3. 10.16.3.Laxness Sales, Revenue, Price, and Gross Margin
      4. 10.16.4.Laxness Revenue and Growth Rate
      5. 10.16.5.Laxness Market Share
      6. 10.16.6. Recent Initiatives, Funding/VC Activities, and Technological Innovations
    17. 10.17. Yuntianhua Group
      1. 10.17.1.Company Overview
      2. 10.17.2.Product/Service Portfolio
      3. 10.17.3.Yuntianhua Group Sales, Revenue, Price, and Gross Margin
      4. 10.17.4.Yuntianhua Group Revenue and Growth Rate
      5. 10.17.5.Yuntianhua Group Market Share
      6. 10.17.6.Recent Initiatives, Funding/VC Activities, and Technological Innovations
    18. 10.18. Foskor
      1. 10.18.1.Company Overview
      2. 10.18.2.Product/Service Portfolio
      3. 10.18.3.Foskor Sales, Revenue, Price, and Gross Margin
      4. 10.18.4.Foskor Revenue and Growth Rate
      5. 10.18.5.Foskor Market Share
      6. 10.18.6.Recent Initiatives, Funding/VC Activities, and Technological Innovations
    19. 10.19. Solvay-Rhodia,
      1. 10.19.1.Company Overview
      2. 10.19.2.Product/Service Portfolio
      3. 10.19.3.Solvay-Rhodia, Sales, Revenue, Price, and Gross Margin
      4. 10.19.4.Solvay-Rhodia, Revenue and Growth Rate
      5. 10.19.5.Solvay-Rhodia, Market Share
      6. 10.19.6.Recent Initiatives, Funding/VC Activities, and Technological Innovations
    20. 10.20. Italmatch Chemicals
      1. 10.20.1.Company Overview
      2. 10.20.2.Product/Service Portfolio
      3. 10.20.3.Italmatch Chemicals Sales, Revenue, Price, and Gross Margin
      4. 10.20.4.Italmatch Chemicals Revenue and Growth Rate
      5. 10.20.5.Italmatch Chemicals Market Share
      6. 10.20.6.Recent Initiatives, Funding/VC Activities, and Technological Innovations
    21. 10.21. Jordan Phosphate Mines
      1. 10.21.1.Company Overview
      2. 10.21.2.Product/Service Portfolio
      3. 10.21.3.Jordan Phosphate Mines Sales, Revenue, Price, and Gross Margin
      4. 10.21.4.Jordan Phosphate Mines Revenue and Growth Rate
      5. 10.21.5.Jordan Phosphate Mines Market Share
      6. 10.21.6.Recent Initiatives, Funding/VC Activities, and Technological Innovations
    22. 10.22. Chemische Fabric Budenheim
      1. 10.22.1.Company Overview
      2. 10.22.2.Product/Service Portfolio
      3. 10.22.3.Chemische Fabric Budenheim Sales, Revenue, Price, and Gross Margin
      4. 10.22.4.Chemische Fabric Budenheim Revenue and Growth Rate
      5. 10.22.5.Chemische Fabric Budenheim Market Share
      6. 10.22.6.Recent Initiatives, Funding/VC Activities, and Technological Innovations
    23. 10.23. Saudi-Arabian Mining Company
      1. 10.23.1.Company Overview
      2. 10.23.2.Product/Service Portfolio
      3. 10.23.3.Saudi-Arabian Mining Company Sales, Revenue, Price, and Gross Margin
      4. 10.23.4.Saudi-Arabian Mining Company Revenue and Growth Rate
      5. 10.23.5.Saudi-Arabian Mining Company Market Share
      6. 10.23.6.Recent Initiatives, Funding/VC Activities, and Technological Innovations
    24. 10.24. Vale
      1. 10.24.1.Company Overview
      2. 10.24.2.Product/Service Portfolio
      3. 10.24.3.Vale Sales, Revenue, Price, and Gross Margin
      4. 10.24.4.Vale Revenue and Growth Rate
      5. 10.24.5.Vale Market Share
      6. 10.24.6.Recent Initiatives, Funding/VC Activities, and Technological Innovations
    25. 10.25. United Phosphorus
      1. 10.25.1.Company Overview
      2. 10.25.2.Product/Service Portfolio
      3. 10.25.3.United Phosphorus Sales, Revenue, Price, and Gross Margin
      4. 10.25.4.United Phosphorus Revenue and Growth Rate
      5. 10.25.5.United Phosphorus Market Share
      6. 10.25.6.Recent Initiatives, Funding/VC Activities, and Technological Innovations
    26. 10.26. The Mosaic Company
      1. 10.26.1.Company Overview
      2. 10.26.2.Product/Service Portfolio
      3. 10.26.3.The Mosaic Company Sales, Revenue, Price, and Gross Margin
      4. 10.26.4.The Mosaic Company Revenue and Growth Rate
      5. 10.26.5.The Mosaic Company Market Share
      6. 10.26.6.Recent Initiatives, Funding/VC Activities, and Technological Innovations
  11. Chapter 11 Phosphoric Acid — Industry Analysis
    1. 11.1. Introduction and Taxonomy
    2. 11.2. Phosphoric Acid Market – Key Trends
      1. 11.2.1. Market Drivers
      2. 11.2.2. Market Restraints
      3. 11.2.3. Market Opportunities
    3. 11.3. Value Chain Analysis
    4. 11.4. Key Mandates and Regulations
    5. 11.5. Technology Roadmap and Timeline
    6. 11.6. Phosphoric Acid Market – Attractiveness Analysis
      1. 11.6.1. By Process Type
      2. 11.6.2. By Grade
      3. 11.6.3. By Application
      4. 11.6.4. By Fertiilizer Type
      5. 11.6.5. By End User
      6. 11.6.6. By Region
  12. Chapter 12 Raw Material Analysis
    1. 12.1. Phosphoric Acid Key Raw Material Analysis
      1. 12.1.1. Key Raw Materials
      2. 12.1.2. Price Trend of Key Raw Materials
    2. 12.2. Key Suppliers of Raw Materials
    3. 12.3. Proportion of Manufacturing Cost Structure
      1. 12.3.1. Raw Materials Cost
      2. 12.3.2. Labor Cost
      3. 12.3.3. Manufacturing Expenses
      4. 12.3.4. Miscellaneous Expenses
    4. 12.4. Manufacturing Cost Analysis of Phosphoric Acid
  13. Chapter 13 Industrial Chain, Sourcing Strategy, and Downstream Buyers
    1. 13.1. Phosphoric Acid Industrial Chain Analysis
    2. 13.2. Upstream Raw Materials Sourcing
      1. 13.2.1. Risk Mitigation:
      2. 13.2.2. Supplier Relationships:
      3. 13.2.3. Business Processes:
      4. 13.2.4. Securing the Product:
    3. 13.3. Raw Materials Sources of Phosphoric Acid Major Manufacturers
    4. 13.4. Downstream Buyers
    5. 13.5. Distributors/Traders List
  14. Chapter 14 Marketing Strategy Analysis, Distributors
    1. 14.1. Marketing Channel
    2. 14.2. Direct Marketing
    3. 14.3. Indirect Marketing
    4. 14.4. Marketing Channel Development Trends
    5. 14.5. Economic/Political Environmental Change
  15. Chapter 15 Report Conclusion & Key Insights
    1. 15.1. Key Insights from Primary Interviews & Surveys Respondents
    2. 15.2. Key Takeaways from Analysts, Consultants, and Industry Leaders
  16. Chapter 16 Research Approach & Methodology
    1. 16.1. Report Description
    2. 16.2. Research Scope
    3. 16.3. Research Methodology
      1. 16.3.1. Secondary Research
      2. 16.3.2. Primary Research
      3. 16.3.3. Statistical Models
        1. 16.3.3.1. Company Share Analysis Model
        2. 16.3.3.2. Revenue Based Modeling
      4. 16.3.4. Research Limitations

      List of Figures

      Fig.1 Product Picture of Phosphoric Acid
      Fig.2 Global Phosphoric Acid Market, 2016 – 2026 (USD Million)
      Fig.3 Global Phosphoric Acid Market, 2016 – 2026 (K Tons)
      Fig.4 Global Phosphoric Acid Market Absolute Revenue Opportunity, 2016 – 2026 (USD Million)
      Fig.5 Global Phosphoric Acid Market Incremental Revenue Opportunity, 2020 – 2026 (USD Million)
      Fig.6 Global Phosphoric Acid Market Share, by Process Type, 2019 & 2026 (USD Million)
      Fig.7 Global Phosphoric Acid Market Share, by Process Type, 2019 & 2026 (K Tons)
      Fig.8 Global Wet Process Phosphoric Acid Market, 2016 – 2026 (USD Million)
      Fig.9 Global Wet Process Phosphoric Acid Market, 2016 – 2026 (K Tons)
      Fig.10 Global Thermal Process Phosphoric Acid Market, 2016 – 2026 (USD Million)
      Fig.11 Global Thermal Process Phosphoric Acid Market, 2016 – 2026 (K Tons)
      Fig.12 Global Others Phosphoric Acid Market, 2016 – 2026 (USD Million)
      Fig.13 Global Others Phosphoric Acid Market, 2016 – 2026 (K Tons)
      Fig.14 Global Phosphoric Acid Market Share, by Grade, 2019 & 2026 (USD Million)
      Fig.15 Global Phosphoric Acid Market Share, by Grade, 2019 & 2026 (K Tons)
      Fig.16 Global  Food Grade Phosphoric Acid Market, 2016 – 2026 (USD Million)
      Fig.17 Global  Food Grade Phosphoric Acid Market, 2016 – 2026 (K Tons)
      Fig.18 Global Technical Grade Phosphoric Acid Market, 2016 – 2026 (USD Million)
      Fig.19 Global Technical Grade Phosphoric Acid Market, 2016 – 2026 (K Tons)
      Fig.20 Global Phosphoric Acid Market Share, by Application, 2019 & 2026 (USD Million)
      Fig.21 Global Phosphoric Acid Market Share, by Application, 2019 & 2026 (K Tons)
      Fig.22 Global Home Cleaning Agents  Phosphoric Acid Market, 2016 – 2026 (USD Million)
      Fig.23 Global Home Cleaning Agents  Phosphoric Acid Market, 2016 – 2026 (K Tons)
      Fig.24 Global Fertilizer Chemicals Phosphoric Acid Market, 2016 – 2026 (USD Million)
      Fig.25 Global Fertilizer Chemicals Phosphoric Acid Market, 2016 – 2026 (K Tons)
      Fig.26 Global Phosphoric Acid Market Share, by  Fertiilizer Type, 2019 & 2026 (USD Million)
      Fig.27 Global Phosphoric Acid Market Share, by  Fertiilizer Type, 2019 & 2026 (K Tons)
      Fig.28 Global  Mono-Ammonium Phosphate (MAP) Phosphoric Acid Market, 2016 – 2026 (USD Million)
      Fig.29 Global  Mono-Ammonium Phosphate (MAP) Phosphoric Acid Market, 2016 – 2026 (K Tons)
      Fig.30 Global Diammonium Phosphate (DAP) Phosphoric Acid Market, 2016 – 2026 (USD Million)
      Fig.31 Global Diammonium Phosphate (DAP) Phosphoric Acid Market, 2016 – 2026 (K Tons)
      Fig.32 Global  Triple Superphosphate (TSP) Phosphoric Acid Market, 2016 – 2026 (USD Million)
      Fig.33 Global  Triple Superphosphate (TSP) Phosphoric Acid Market, 2016 – 2026 (K Tons)
      Fig.34 Global Phosphoric Acid Market Share, by End User, 2019 & 2026 (USD Million)
      Fig.35 Global Phosphoric Acid Market Share, by End User, 2019 & 2026 (K Tons)
      Fig.36 Global Electronics  Phosphoric Acid Market, 2016 – 2026 (USD Million)
      Fig.37 Global Electronics  Phosphoric Acid Market, 2016 – 2026 (K Tons)
      Fig.38 Global Beverage Phosphoric Acid Market, 2016 – 2026 (USD Million)
      Fig.39 Global Beverage Phosphoric Acid Market, 2016 – 2026 (K Tons)
      Fig.40 Global Medical Phosphoric Acid Market, 2016 – 2026 (USD Million)
      Fig.41 Global Medical Phosphoric Acid Market, 2016 – 2026 (K Tons)
      Fig.42 Global Food  Phosphoric Acid Market, 2016 – 2026 (USD Million)
      Fig.43 Global Food  Phosphoric Acid Market, 2016 – 2026 (K Tons)
      Fig.44 Global Fertilizer  Phosphoric Acid Market, 2016 – 2026 (USD Million)
      Fig.45 Global Fertilizer  Phosphoric Acid Market, 2016 – 2026 (K Tons)
      Fig.46 Global Others Phosphoric Acid Market, 2016 – 2026 (USD Million)
      Fig.47 Global Others Phosphoric Acid Market, 2016 – 2026 (K Tons)
      Fig.48 Global Phosphoric Acid Market Share, by Region, 2019 & 2026 (USD Million)
      Fig.49 Global Phosphoric Acid Market Share, by Region, 2019 & 2026 (K Tons)
      Fig.50 North America Phosphoric Acid Market, 2016 – 2026 (USD Million)
      Fig.51 North America Phosphoric Acid Market, 2016 – 2026 (K Tons)
      Fig.52 U.S. Phosphoric Acid Market, 2016 – 2026 (USD Million)
      Fig.53 U.S. Phosphoric Acid  Market, 2016 – 2026 (K Tons)
      Fig.54 Canada Phosphoric Acid Market, 2016 – 2026 (USD Million)
      Fig.55 Canada Phosphoric Acid  Market, 2016 – 2026 (K Tons)
      Fig.56 Europe Phosphoric Acid Market, 2016 – 2026 (USD Million)
      Fig.57 Europe Phosphoric Acid Market, 2016 – 2026 (K Tons)
      Fig.58 Germany Phosphoric Acid Market, 2016 – 2026 (USD Million)
      Fig.59 Germany Phosphoric Acid  Market, 2016 – 2026 (K Tons)
      Fig.60 France Phosphoric Acid Market, 2016 – 2026 (USD Million)
      Fig.61 France Phosphoric Acid  Market, 2016 – 2026 (K Tons)
      Fig.62 U.K. Phosphoric Acid Market, 2016 – 2026 (USD Million)
      Fig.63 U.K. Phosphoric Acid  Market, 2016 – 2026 (K Tons)
      Fig.64 Italy Phosphoric Acid Market, 2016 – 2026 (USD Million)
      Fig.65 Italy Phosphoric Acid  Market, 2016 – 2026 (K Tons)
      Fig.66 Spain Phosphoric Acid Market, 2016 – 2026 (USD Million)
      Fig.67 Spain Phosphoric Acid  Market, 2016 – 2026 (K Tons)
      Fig.68 Rest of Europe Phosphoric Acid Market, 2016 – 2026 (USD Million)
      Fig.69 Rest of Europe Phosphoric Acid  Market, 2016 – 2026 (K Tons)
      Fig.70 Asia Pacific Phosphoric Acid Market, 2016 – 2026 (USD Million)
      Fig.71 Asia Pacific Phosphoric Acid Market, 2016 – 2026 (K Tons)
      Fig.72 China Phosphoric Acid Market, 2016 – 2026 (USD Million)
      Fig.73 China Phosphoric Acid  Market, 2016 – 2026 (K Tons)
      Fig.74 Japan Phosphoric Acid Market, 2016 – 2026 (USD Million)
      Fig.75 Japan Phosphoric Acid  Market, 2016 – 2026 (K Tons)
      Fig.76 India Phosphoric Acid Market, 2016 – 2026 (USD Million)
      Fig.77 India Phosphoric Acid  Market, 2016 – 2026 (K Tons)
      Fig.78 South  Korea Phosphoric Acid Market, 2016 – 2026 (USD Million)
      Fig.79 South  Korea Phosphoric Acid  Market, 2016 – 2026 (K Tons)
      Fig.80 South-East Asia Phosphoric Acid Market, 2016 – 2026 (USD Million)
      Fig.81 South-East Asia Phosphoric Acid  Market, 2016 – 2026 (K Tons)
      Fig.82 Rest of Asia Pacific Phosphoric Acid Market, 2016 – 2026 (USD Million)
      Fig.83 Rest of Asia Pacific Phosphoric Acid  Market, 2016 – 2026 (K Tons)
      Fig.84 Latin America Phosphoric Acid Market, 2016 – 2026 (USD Million)
      Fig.85 Latin America Phosphoric Acid Market, 2016 – 2026 (K Tons)
      Fig.86 Brazil Phosphoric Acid Market, 2016 – 2026 (USD Million)
      Fig.87 Brazil Phosphoric Acid  Market, 2016 – 2026 (K Tons)
      Fig.88 Mexico Phosphoric Acid Market, 2016 – 2026 (USD Million)
      Fig.89 Mexico Phosphoric Acid  Market, 2016 – 2026 (K Tons)
      Fig.90 Rest of Latin America Phosphoric Acid Market, 2016 – 2026 (USD Million)
      Fig.91 Rest of Latin America Phosphoric Acid  Market, 2016 – 2026 (K Tons)
      Fig.92 The Middle-East and Africa Phosphoric Acid Market, 2016 – 2026 (USD Million)
      Fig.93 The Middle-East and Africa Phosphoric Acid Market, 2016 – 2026 (K Tons)
      Fig.94 GCC Countries Phosphoric Acid Market, 2016 – 2026 (USD Million)
      Fig.95 GCC Countries Phosphoric Acid  Market, 2016 – 2026 (K Tons)
      Fig.96 South Africa Phosphoric Acid Market, 2016 – 2026 (USD Million)
      Fig.97 South Africa Phosphoric Acid  Market, 2016 – 2026 (K Tons)
      Fig.98 Rest of Middle-East Africa Phosphoric Acid Market, 2016 – 2026 (USD Million)
      Fig.99 Rest of Middle-East Africa Phosphoric Acid  Market, 2016 – 2026 (K Tons)
      Fig.100 Global Phosphoric Acid Production and Consumption, 2016 – 2026 (K Tons)
      Fig.101 North America Phosphoric Acid Production and Consumption, 2016 – 2026 (USD Million) (K Tons)
      Fig.102 Europe Phosphoric Acid Production and Consumption, 2016 – 2026 (USD Million) (K Tons)
      Fig.103 Asia Pacific Phosphoric Acid Production and Consumption, 2016 – 2026 (USD Million) (K Tons)
      Fig.104 Latin America Phosphoric Acid Production and Consumption, 2016 – 2026 (USD Million) (K Tons)
      Fig.105 The Middle-East and Africa Phosphoric Acid Production and Consumption, 2016 – 2026 (USD Million) (K Tons)
      Fig.106 Competitor Market Share – Revenue
      Fig.107 Competitor Market Share – Volume
      Fig.108 Kazphosphate LIC Revenue and Growth Rate
      Fig.109 Kazphosphate LIC Market Share
      Fig.110 Prayon Revenue and Growth Rate
      Fig.111 Prayon Market Share
      Fig.112 PJSC PhosAgro Revenue and Growth Rate
      Fig.113 PJSC PhosAgro Market Share
      Fig.114 Acron OAO Revenue and Growth Rate
      Fig.115 Acron OAO Market Share
      Fig.116 Yara International Revenue and Growth Rate
      Fig.117 Yara International Market Share
      Fig.118 Israel Chemical Revenue and Growth Rate
      Fig.119 Israel Chemical Market Share
      Fig.120 Eurochem Revenue and Growth Rate
      Fig.121 Eurochem Market Share
      Fig.122 OJSC Phosagro Revenue and Growth Rate
      Fig.123 OJSC Phosagro Market Share
      Fig.124 Argium Revenue and Growth Rate
      Fig.125 Argium Market Share
      Fig.126 Nutrien Revenue and Growth Rate
      Fig.127 Nutrien Market Share
      Fig.128 Potash Corp. Revenue and Growth Rate
      Fig.129 Potash Corp. Market Share
      Fig.130 CF Industries Revenue and Growth Rate
      Fig.131 CF Industries Market Share
      Fig.132 OCP Revenue and Growth Rate
      Fig.133 OCP Market Share
      Fig.134 Innophos Holding Revenue and Growth Rate
      Fig.135 Innophos Holding Market Share
      Fig.136 IFFCO Revenue and Growth Rate
      Fig.137 IFFCO Market Share
      Fig.138 Laxness Revenue and Growth Rate
      Fig.139 Laxness Market Share
      Fig.140 Yuntianhua Group Revenue and Growth Rate
      Fig.141 Yuntianhua Group Market Share
      Fig.142 Foskor Revenue and Growth Rate
      Fig.143 Foskor Market Share
      Fig.144 Solvay-Rhodia, Revenue and Growth Rate
      Fig.145 Solvay-Rhodia, Market Share
      Fig.146 Italmatch Chemicals Revenue and Growth Rate
      Fig.147 Italmatch Chemicals Market Share
      Fig.148 Jordan Phosphate Mines Revenue and Growth Rate
      Fig.149 Jordan Phosphate Mines Market Share
      Fig.150 Chemische Fabric Budenheim Revenue and Growth Rate
      Fig.151 Chemische Fabric Budenheim Market Share
      Fig.152 Saudi-Arabian Mining Company Revenue and Growth Rate
      Fig.153 Saudi-Arabian Mining Company Market Share
      Fig.154 Vale Revenue and Growth Rate
      Fig.155 Vale Market Share
      Fig.156 United Phosphorus Revenue and Growth Rate
      Fig.157 United Phosphorus Market Share
      Fig.158 The Mosaic Company Revenue and Growth Rate
      Fig.159 The Mosaic Company Market Share
      Fig.160 Market Dynamics
      Fig.161 Global Phosphoric Acid – Value Chain Analysis
      Fig.162 Key Mandates and Regulations
      Fig.163 Technology Roadmap and Timeline
      Fig.164 Market Attractiveness Analysis – By Process Type
      Fig.165 Market Attractiveness Analysis – By Grade
      Fig.166 Market Attractiveness Analysis – By Application
      Fig.167 Market Attractiveness Analysis – By  Fertiilizer Type
      Fig.168 Market Attractiveness Analysis – By End User
      Fig.169 Market Attractiveness Analysis – By Region
      Fig.170 Manufacturing Cost Structure of Phosphoric Acid
      Fig.171 Phosphoric Acid Industrial Chain Analysis
      Fig.172 Market Channels
      Fig.173 Marketing Channel Development Trend
      Fig.174 Growth in World Gross Product, 2008-2018
      

      List of Tables

      Table 1 Global Phosphoric Acid Market, 2019 & 2026 (USD Million)
      Table 2 Global Phosphoric Acid Market, by Process Type, 2016 – 2026 (USD Million)
      Table 3 Global Phosphoric Acid Market, by Process Type, 2016 – 2026 (K Tons)
      Table 4 Global Phosphoric Acid Market, by Grade, 2016 – 2026 (USD Million)
      Table 5 Global Phosphoric Acid Market, by Grade, 2016 – 2026 (K Tons)
      Table 6 Global Phosphoric Acid Market, by Application, 2016 – 2026 (USD Million)
      Table 7 Global Phosphoric Acid Market, by Application, 2016 – 2026 (K Tons)
      Table 8 Global Phosphoric Acid Market, by  Fertiilizer Type, 2016 – 2026 (USD Million)
      Table 9 Global Phosphoric Acid Market, by  Fertiilizer Type, 2016 – 2026 (K Tons)
      Table 10 Global Phosphoric Acid Market, by End User, 2016 – 2026 (USD Million)
      Table 11 Global Phosphoric Acid Market, by End User, 2016 – 2026 (K Tons)
      Table 12 Global Phosphoric Acid Market, by Region, 2016 – 2026 (USD Million)
      Table 13 Global Phosphoric Acid Market, by Region, 2016 – 2026 (K Tons)
      Table 14 North America Phosphoric Acid Market, by Country, 2016 – 2026 (USD Million)
      Table 15 North America Phosphoric Acid Market, by Country, 2016 – 2026 (K Tons)
      Table 16 North America Phosphoric Acid Market, by Process Type, 2016 – 2026 (USD Million)
      Table 17 North America Phosphoric Acid Market, by Process Type, 2016 – 2026 (K Tons)
      Table 18 North America Phosphoric Acid Market, by Grade, 2016 – 2026 (USD Million)
      Table 19 North America Phosphoric Acid Market, by Grade, 2016 – 2026 (K Tons)
      Table 20 North America Phosphoric Acid Market, by Application, 2016 – 2026 (USD Million)
      Table 21 North America Phosphoric Acid Market, by Application, 2016 – 2026 (K Tons)
      Table 22 North America Phosphoric Acid Market, by  Fertiilizer Type, 2016 – 2026 (USD Million)
      Table 23 North America Phosphoric Acid Market, by  Fertiilizer Type, 2016 – 2026 (K Tons)
      Table 24 North America Phosphoric Acid Market, by End User, 2016 – 2026 (USD Million)
      Table 25 North America Phosphoric Acid Market, by End User, 2016 – 2026 (K Tons)
      Table 26 Europe Phosphoric Acid Market, by Country, 2016 – 2026 (USD Million)
      Table 27 Europe Phosphoric Acid Market, by Country, 2016 – 2026 (K Tons)
      Table 28 Europe Phosphoric Acid Market, by Process Type, 2016 – 2026 (USD Million)
      Table 29 Europe Phosphoric Acid Market, by Process Type, 2016 – 2026 (K Tons)
      Table 30 Europe Phosphoric Acid Market, by Grade, 2016 – 2026 (USD Million)
      Table 31 Europe Phosphoric Acid Market, by Grade, 2016 – 2026 (K Tons)
      Table 32 Europe Phosphoric Acid Market, by Application, 2016 – 2026 (USD Million)
      Table 33 Europe Phosphoric Acid Market, by Application, 2016 – 2026 (K Tons)
      Table 34 Europe Phosphoric Acid Market, by  Fertiilizer Type, 2016 – 2026 (USD Million)
      Table 35 Europe Phosphoric Acid Market, by  Fertiilizer Type, 2016 – 2026 (K Tons)
      Table 36 Europe Phosphoric Acid Market, by End User, 2016 – 2026 (USD Million)
      Table 37 Europe Phosphoric Acid Market, by End User, 2016 – 2026 (K Tons)
      Table 38 Asia Pacific Phosphoric Acid Market, by Country, 2016 – 2026 (USD Million)
      Table 39 Asia Pacific Phosphoric Acid Market, by Country, 2016 – 2026 (K Tons)
      Table 40 Asia Pacific Phosphoric Acid Market, by Process Type, 2016 – 2026 (USD Million)
      Table 41 Asia Pacific Phosphoric Acid Market, by Process Type, 2016 – 2026 (K Tons)
      Table 42 Asia Pacific Phosphoric Acid Market, by Grade, 2016 – 2026 (USD Million)
      Table 43 Asia Pacific Phosphoric Acid Market, by Grade, 2016 – 2026 (K Tons)
      Table 44 Asia Pacific Phosphoric Acid Market, by Application, 2016 – 2026 (USD Million)
      Table 45 Asia Pacific Phosphoric Acid Market, by Application, 2016 – 2026 (K Tons)
      Table 46 Asia Pacific Phosphoric Acid Market, by  Fertiilizer Type, 2016 – 2026 (USD Million)
      Table 47 Asia Pacific Phosphoric Acid Market, by  Fertiilizer Type, 2016 – 2026 (K Tons)
      Table 48 Asia Pacific Phosphoric Acid Market, by End User, 2016 – 2026 (USD Million)
      Table 49 Asia Pacific Phosphoric Acid Market, by End User, 2016 – 2026 (K Tons)
      Table 50 Latin America Phosphoric Acid Market, by Country, 2016 – 2026 (USD Million)
      Table 51 Latin America Phosphoric Acid Market, by Country, 2016 – 2026 (K Tons)
      Table 52 Latin America Phosphoric Acid Market, by Process Type, 2016 – 2026 (USD Million)
      Table 53 Latin America Phosphoric Acid Market, by Process Type, 2016 – 2026 (K Tons)
      Table 54 Latin America Phosphoric Acid Market, by Grade, 2016 – 2026 (USD Million)
      Table 55 Latin America Phosphoric Acid Market, by Grade, 2016 – 2026 (K Tons)
      Table 56 Latin America Phosphoric Acid Market, by Application, 2016 – 2026 (USD Million)
      Table 57 Latin America Phosphoric Acid Market, by Application, 2016 – 2026 (K Tons)
      Table 58 Latin America Phosphoric Acid Market, by  Fertiilizer Type, 2016 – 2026 (USD Million)
      Table 59 Latin America Phosphoric Acid Market, by  Fertiilizer Type, 2016 – 2026 (K Tons)
      Table 60 Latin America Phosphoric Acid Market, by End User, 2016 – 2026 (USD Million)
      Table 61 Latin America Phosphoric Acid Market, by End User, 2016 – 2026 (K Tons)
      Table 62 The Middle-East and Africa Phosphoric Acid Market, by Country, 2016 – 2026 (USD Million)
      Table 63 The Middle-East and Africa Phosphoric Acid Market, by Country, 2016 – 2026 (K Tons)
      Table 64 The Middle-East and Africa Phosphoric Acid Market, by Process Type, 2016 – 2026 (USD Million)
      Table 65 The Middle-East and Africa Phosphoric Acid Market, by Process Type, 2016 – 2026 (K Tons)
      Table 66 The Middle-East and Africa Phosphoric Acid Market, by Grade, 2016 – 2026 (USD Million)
      Table 67 The Middle-East and Africa Phosphoric Acid Market, by Grade, 2016 – 2026 (K Tons)
      Table 68 The Middle-East and Africa Phosphoric Acid Market, by Application, 2016 – 2026 (USD Million)
      Table 69 The Middle-East and Africa Phosphoric Acid Market, by Application, 2016 – 2026 (K Tons)
      Table 70 The Middle-East and Africa Phosphoric Acid Market, by  Fertiilizer Type, 2016 – 2026 (USD Million)
      Table 71 The Middle-East and Africa Phosphoric Acid Market, by  Fertiilizer Type, 2016 – 2026 (K Tons)
      Table 72 The Middle-East and Africa Phosphoric Acid Market, by End User, 2016 – 2026 (USD Million)
      Table 73 The Middle-East and Africa Phosphoric Acid Market, by End User, 2016 – 2026 (K Tons)
      Table 74 North America Phosphoric Acid Production, Consumption, Export, Import, 2016 – 2019
      Table 75 Europe Phosphoric Acid Production, Consumption, Export, Import, 2016 – 2019
      Table 76 Asia Pacific Phosphoric Acid Production, Consumption, Export, Import, 2016 – 2019
      Table 77 Latin America Phosphoric Acid Production, Consumption, Export, Import, 2016 – 2019
      Table 78 The Middle-East and Africa Phosphoric Acid Production, Consumption, Export, Import, 2016 – 2019
      Table 79 Global Phosphoric Acid Market - Company Revenue Analysis, 2016 – 2019 (USD Million)
      Table 80 Global Phosphoric Acid Market - Company Revenue Share Analysis, 2016 – 2019 (%)
      Table 81 Global Phosphoric Acid Market - Company Volume Analysis, 2016 – 2019 (K Tons)
      Table 82 Global Phosphoric Acid Market - Company Volume Share Analysis, 2016 – 2019 (%)
      Table 83 Acquisitions and Mergers
      Table 84 Market Drivers – Impact Analysis
      Table 85 Market Restraints
      Table 86 Market Opportunities
      Table 87 Production Base and Market Concentration Rate of Raw Material
      Table 88 Key Suppliers of Raw Materials
      Table 89 Raw Materials Sources of Phosphoric Acid Major Manufacturers
      Table 90 Major Buyers of Phosphoric Acid
      Table 91 Distributors/Traders of Phosphoric Acid by Region
      

Industry Major Market Players

  • Kazphosphate LIC
  • Prayon
  • PJSC PhosAgro
  • Acron OAO
  • Yara International
  • Israel Chemical
  • Eurochem
  • OJSC Phosagro
  • Argium, Nutrien
  • Potash Corp.
  • CF Industries
  • OCP
  • Innophos Holdings
  • IFFCO
  • Laxness
  • Yuntianhua Group
  • Foskor
  • Solvay-Rhodia
  • Italmatch Chemicals
  • Jordan Phosphate Mines
  • Chemische Fabric Budenheim
  • Saudi-Arabian Mining Company
  • Vale
  • United Phosphorus
  • The Mosaic Company