Search Market Research Report

Discover Our Latest Reports
Discover Our Featured Reports
Discover Top Selling Reports

Pharmacokinetics Services Market Size, Share Global Analysis Report, 2019 – 2026

report img

Pharmacokinetics Services Market by Drug Type (Large Molecules and Small Molecules): Global Industry Perspective, Comprehensive Analysis, and Forecast 2019 – 2026

Industry Insights

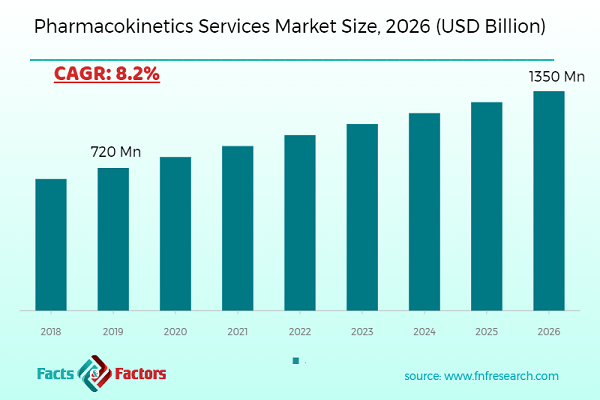
The pharmacokinetics services market report analyzes and notifies the industry statistics at the global as well as regional and country levels to acquire a thorough perspective of the entire pharmacokinetics services market. The historical and past insights are provided for FY 2016 to FY 2019 whereas projected trends are delivered for FY 2020 to FY 2026. The quantitative and numerical data is represented in terms of value (USD 1,350 million) from FY 2016 – 2026.

This specialized and expertise-oriented industry research report scrutinizes the technical and commercial business outlook of the pharmacokinetics services industry. The report analyzes and declares the historical and current trends analysis of the pharmacokinetics services industry and subsequently recommends the projected trends anticipated to be observed in the pharmacokinetics services market during the upcoming years.

Pharmacokinetics Services Market Size

To know more about this report | Request Free Sample Copy


logoKey Insights from Primary Research

  • As per our primary respondents, the global pharmacokinetics services market is set to grow annually at a rate of around 8%.
  • It was established through primary research that the global pharmacokinetics services market was valued at around USD 720 Million in 2019.
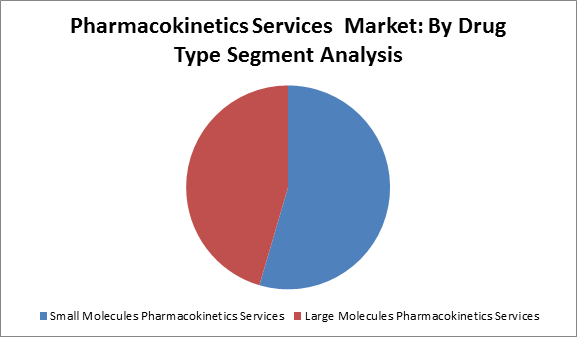
  • The “Small Molecules Pharmacokinetics Services” category, on the basis of drug type segmentation, was the leading revenue-generating category in 2019.
  • Based on the region, North America was the leading revenue-generating category in 2019.

logoKey Recommendations from Analysts

  • As per our analysis, the global pharmacokinetics services market is growing at high CAGR and various end-use industries are aware of this potential market and applications of the pharmacokinetics services.
  • Growing at a CAGR of around 8.2%, the global pharmacokinetics services market provides numerous opportunities for all of the involved stakeholders across the entire value chain.
  • Our analysts have identified Small Molecules Pharmacokinetics Services segment will be dominating for global pharmacokinetics services market in terms of drug type segmentation respectively.
  • As per our analysis, North America is expected to account for the maximum revenue share, in the target market.

Pharmacokinetics Services Market

To know more about this report | Request Free Sample Copy


The quantitative data is further underlined and reinforced by comprehensive qualitative data which comprises various across-the-board market dynamics. The rationales which directly or indirectly impact the pharmacokinetics services industry are exemplified through parameters such as growth drivers, restraints, challenges, and opportunities among other impacting factors.

Throughout our research report, we have encompassed all the proven models and tools of industry analysis and extensively illustrated all the key business strategies and business models adopted in the pharmacokinetics services industry. The report provides an all-inclusive and detailed competitive landscape prevalent in the pharmacokinetics services market.

The report utilizes established industry analysis tools and models such as Porter’s Five Forces framework to analyze and recognize critical business strategies adopted by various stakeholders involved in the entire value chain of the pharmacokinetics services industry. The pharmacokinetics services market report additionally employs SWOT analysis and PESTLE analysis models for further in-depth analysis.

The report study further includes an in-depth analysis of industry players' market shares and provides an overview of leading players' market position in the pharmacokinetics services sector. Key strategic developments in the pharmacokinetics services market competitive landscape such as acquisitions & mergers, inaugurations of different products and services, partnerships & joint ventures, MoU agreements, VC & funding activities, R&D activities, and geographic expansion among other noteworthy activities by key players of the pharmacokinetics services market are appropriately highlighted in the report.

The pharmacokinetics services market is anticipated to develop with a healthy CAGR over the figure time frame. The development of the worldwide pharmacokinetics administrations is filled by the development of the preliminary clinical trial attrition rate of pharmacokinetics for medicinal drugs. To order to minimize the usage of pharmaceutical products to therapeutic preliminaries at cutting-edge levels, a large number of scientists emphasize the need to investigate pharmacokinetics. PK examines allow for early assurance of possible difficulties that may cause steady loss of prescription during late phases of drug development and thus allow for the evaluation and execution of necessary changes that should be modified with advanced systems. Besides, expanding innovative work projects to address the issues and for product improvement by the key players driving the development of the market. Moreover, the lack of awareness about services is hampering the development of the market.

The market for pharmacokinetics services is categorized based on the drug type, and region. In light of the drug type, the market is bifurcated into small-molecule pharmacokinetics services and large-molecule pharmacokinetics services.

logoReport Scope

Report Attribute

Details

Market Size in 2019

USD 720 Million

Projected Market Size in 2026

USD 1,350 Million

CAGR Growth Rate

8.2% CAGR

Base Year

2020

Forecast Years

2020-2026

Key Market Players

Shanghai Medicilon Inc., SGS SA, PAREXEL International Corporation, Pacific BioLabs, LGC Limited, L.P., GVK Biosciences Private Limited, Frontage Labs, Evotec AG, Eurofins Scientific Inc., Creative Bioarray, and Certara

Key Segment

By Drug Type, and By Region

Major Regions Covered

North America, Europe, Asia Pacific, Latin America, and the Middle East & Africa

Purchase Options

Request customized purchase options to meet your research needs. Explore purchase options

logoSome of the essential players operating in the market are as follows:

  •  Shanghai Medicilon Inc.
  •  SGS SA
  •  PAREXEL International Corporation
  •  Pacific BioLabs
  •  LGC Limited
  •  L.P.
  •  GVK Biosciences Private Limited
  •  Frontage Labs
  •  Evotec AG
  •  Eurofins Scientific Inc.
  •  Creative Bioarray
  •  Certara.

The taxonomy of the pharmacokinetics services Market by its scope and segmentation is as follows:

logo Drug Type Segment Analysis

  • Small Molecules Pharmacokinetics Services
  • Large Molecules Pharmacokinetics Services

logo By Region Segment Analysis

  • North America
    • The U.S.
    • Canada
  • Europe
    • Germany
    • France
    • UK
    • Italy
    • Spain
    • Rest Of Europe
  • Asia Pacific
    • China
    • Japan
    • India
    • South Korea
    • Southeast Asia
    • Rest of Asia Pacific
  • Latin America
    • Brazil
    • Mexico
    • Rest of Latin America
  • The Middle East & Africa
    • GCC Countries
    • South Africa
    • Rest of the Middle East & Africa

Table of Content

  1. CHAPTER 1. Executive Summary
  2. CHAPTER 2. Pharmacokinetics Services market – Drug type Analysis
    1. 2.1. Global Pharmacokinetics Services Market – Drug type Overview
    2. 2.2. Global Pharmacokinetics Services Market Share, by Drug type, 2018 & 2025 (USD Million)
    3. 2.3. Small Molecules Pharmacokinetics Services
      1. 2.3.1. Global Small Molecules Pharmacokinetics Services Pharmacokinetics Services Market, 2016-2026 (USD Million)
    4. 2.4. Large Molecules Pharmacokinetics Services
      1. 2.4.1. Global Large Molecules Pharmacokinetics Services Pharmacokinetics Services Market, 2016-2026 (USD Million)
  3. CHAPTER 3. Pharmacokinetics Services market – Regional Analysis
    1. 3.1. Global Pharmacokinetics Services Market Regional Overview
    2. 3.2. Global Pharmacokinetics Services Market Share, by Region, 2018 & 2025 (Value)
    3. 3.3. North America
      1. 3.3.1. North America Pharmacokinetics Services Market size and forecast, 2016-2026
      2. 3.3.2. North America Pharmacokinetics Services Market, by Country, 2018 & 2025 (USD Million)
      3. 3.3.3. North America Pharmacokinetics Services Market, by Drug type, 2016-2026
        1. 3.3.3.1. North America Pharmacokinetics Services Market, by Drug type, 2016-2026 (USD Million)
      4. 3.3.4. U.S.
        1. 3.3.4.1. U.S. Market size and forecast, 2016-2026 (USD Million)
      5. 3.3.5. Canada
        1. 3.3.5.1. Canada Market size and forecast, 2016-2026 (USD Million)
    4. 3.4. Europe
      1. 3.4.1. Europe Pharmacokinetics Services Market size and forecast, 2016-2026
      2. 3.4.2. Europe Pharmacokinetics Services Market, by Country, 2018 & 2025 (USD Million)
      3. 3.4.3. Europe Pharmacokinetics Services Market, by Drug type, 2016-2026
        1. 3.4.3.1. Europe Pharmacokinetics Services Market, by Drug type, 2016-2026 (USD Million)
      4. 3.4.4. Germany
        1. 3.4.4.1. Germany Market size and forecast, 2016-2026 (USD Million)
      5. 3.4.5. France
        1. 3.4.5.1. France Market size and forecast, 2016-2026 (USD Million)
      6. 3.4.6. U.K.
        1. 3.4.6.1. U.K. Market size and forecast, 2016-2026 (USD Million)
      7. 3.4.7. Italy
        1. 3.4.7.1. Italy Market size and forecast, 2016-2026 (USD Million)
      8. 3.4.8. Spain
        1. 3.4.8.1. Spain Market size and forecast, 2016-2026 (USD Million)
      9. 3.4.9. Rest of Europe
        1. 3.4.9.1. Rest of Europe Market size and forecast, 2016-2026 (USD Million)
    5. 3.5. Asia Pacific
      1. 3.5.1. Asia Pacific Pharmacokinetics Services Market size and forecast, 2016-2026
      2. 3.5.2. Asia Pacific Pharmacokinetics Services Market, by Country, 2018 & 2025 (USD Million)
      3. 3.5.3. Asia Pacific Pharmacokinetics Services Market, by Drug type, 2016-2026
        1. 3.5.3.1. Asia Pacific Pharmacokinetics Services Market, by Drug type, 2016-2026 (USD Million)
      4. 3.5.4. China
        1. 3.5.4.1. China Market size and forecast, 2016-2026 (USD Million)
      5. 3.5.5. Japan
        1. 3.5.5.1. Japan Market size and forecast, 2016-2026 (USD Million)
      6. 3.5.6. India
        1. 3.5.6.1. India Market size and forecast, 2016-2026 (USD Million)
      7. 3.5.7. South Korea
        1. 3.5.7.1. South Korea Market size and forecast, 2016-2026 (USD Million)
      8. 3.5.8. South-East Asia
        1. 3.5.8.1. South-East Asia Market size and forecast, 2016-2026 (USD Million)
      9. 3.5.9. Rest of Asia Pacific
        1. 3.5.9.1. Rest of Asia Pacific Market size and forecast, 2016-2026 (USD Million)
    6. 3.6. Latin America
      1. 3.6.1. Latin America Pharmacokinetics Services Market size and forecast, 2016-2026
      2. 3.6.2. Latin America Pharmacokinetics Services Market, by Country, 2018 & 2025 (USD Million)
      3. 3.6.3. Latin America Pharmacokinetics Services Market, by Drug type, 2016-2026
        1. 3.6.3.1. Latin America Pharmacokinetics Services Market, by Drug type, 2016-2026 (USD Million)
      4. 3.6.4. Brazil
        1. 3.6.4.1. Brazil Market size and forecast, 2016-2026 (USD Million)
      5. 3.6.5. Mexico
        1. 3.6.5.1. Mexico Market size and forecast, 2016-2026 (USD Million)
      6. 3.6.6. Rest of Latin America
        1. 3.6.6.1. Rest of Latin America Market size and forecast, 2016-2026 (USD Million)
    7. 3.7. The Middle-East and Africa
      1. 3.7.1. The Middle-East and Africa Pharmacokinetics Services Market size and forecast, 2016-2026
      2. 3.7.2. The Middle-East and Africa Pharmacokinetics Services Market, by Country, 2018 & 2025 (USD Million)
      3. 3.7.3. The Middle-East and Africa Pharmacokinetics Services Market, by Drug type, 2016-2026
        1. 3.7.3.1. The Middle-East and Africa Pharmacokinetics Services Market, by Drug type, 2016-2026 (USD Million)
      4. 3.7.4. GCC Countries
        1. 3.7.4.1. GCC Countries Market size and forecast, 2016-2026 (USD Million)
      5. 3.7.5. South Africa
        1. 3.7.5.1. South Africa Market size and forecast, 2016-2026 (USD Million)
      6. 3.7.6. Rest of Middle-East Africa
        1. 3.7.6.1. Rest of Middle-East Africa Market size and forecast, 2016-2026 (USD Million)
  4. CHAPTER 4. Pharmacokinetics Services market – Competitive Landscape
    1. 4.1. Competitor Market Share – Revenue
    2. 4.2. Market Concentration Rate Analysis, Top 3 and Top 5 Players
    3. 4.3. Strategic Development
      1. 4.3.1. Acquisitions and Mergers
      2. 4.3.2. New Products
      3. 4.3.3. Research & Development Activities
  5. CHAPTER 5. Company Profiles
    1. 5.1. Shanghai Medicilon Inc.
      1. 5.1.1. Company Overview
      2. 5.1.2. Shanghai Medicilon Inc. Revenue and Gross Margin
      3. 5.1.3. Product portfolio
      4. 5.1.4. Recent initiatives
    2. 5.2. SGS SA
      1. 5.2.1. Company Overview
      2. 5.2.2. SGS SA Revenue and Gross Margin
      3. 5.2.3. Product portfolio
      4. 5.2.4. Recent initiatives
    3. 5.3. PAREXEL International Corporation
      1. 5.3.1. Company Overview
      2. 5.3.2. PAREXEL International Corporation Revenue and Gross Margin
      3. 5.3.3. Product portfolio
      4. 5.3.4. Recent initiatives
    4. 5.4. Pacific BioLabs
      1. 5.4.1. Company Overview
      2. 5.4.2. Pacific BioLabs Revenue and Gross Margin
      3. 5.4.3. Product portfolio
      4. 5.4.4. Recent initiatives
    5. 5.5. LGC Limited
      1. 5.5.1. Company Overview
      2. 5.5.2. LGC Limited Revenue and Gross Margin
      3. 5.5.3. Product portfolio
      4. 5.5.4. Recent initiatives
    6. 5.6. L.P.
      1. 5.6.1. Company Overview
      2. 5.6.2. L.P. Revenue and Gross Margin
      3. 5.6.3. Product portfolio
      4. 5.6.4. Recent initiatives
    7. 5.7. GVK Biosciences Private Limited
      1. 5.7.1. Company Overview
      2. 5.7.2. GVK Biosciences Private Limited Revenue and Gross Margin
      3. 5.7.3. Product portfolio
      4. 5.7.4. Recent initiatives
    8. 5.8. Frontage Labs
      1. 5.8.1. Company Overview
      2. 5.8.2. Frontage Labs Revenue and Gross Margin
      3. 5.8.3. Product portfolio
      4. 5.8.4. Recent initiatives
    9. 5.9. Evotec AG
      1. 5.9.1. Company Overview
      2. 5.9.2. Evotec AG Revenue and Gross Margin
      3. 5.9.3. Product portfolio
      4. 5.9.4. Recent initiatives
    10. 5.10. Eurofins Scientific Inc.
      1. 5.10.1. Company Overview
      2. 5.10.2. Eurofins Scientific Inc. Revenue and Gross Margin
      3. 5.10.3. Product portfolio
      4. 5.10.4. Recent initiatives
    11. 5.11. Creative Bioarray
      1. 5.11.1. Company Overview
      2. 5.11.2. Creative Bioarray Revenue and Gross Margin
      3. 5.11.3. Product portfolio
      4. 5.11.4. Recent initiatives
    12. 5.12. Certara
      1. 5.12.1. Company Overview
      2. 5.12.2. Certara Revenue and Gross Margin
      3. 5.12.3. Product portfolio
      4. 5.12.4. Recent initiatives
  6. CHAPTER 6. Pharmacokinetics Services — Industry Analysis
    1. 6.1. Pharmacokinetics Services Market – Key Trends
      1. 6.1.1. Market Drivers
      2. 6.1.2. Market Restraints
      3. 6.1.3. Market Opportunities
    2. 6.2. Value Chain Analysis
    3. 6.3. Technology Roadmap and Timeline
    4. 6.4. Pharmacokinetics Services Market – Attractiveness Analysis
      1. 6.4.1. By Drug type
      2. 6.4.2. By Region
  7. CHAPTER 7. Marketing Strategy Analysis, Distributors
    1. 7.1. Marketing Channel
    2. 7.2. Direct Marketing
    3. 7.3. Indirect Marketing
    4. 7.4. Marketing Channel Development Trend
    5. 7.5. Economic/Political Environmental Change
  8. CHAPTER 8. Report Conclusion
  9. CHAPTER 9. Research Approach & Methodology
    1. 9.1. Report Description
    2. 9.2. Research Scope
    3. 9.3. Research Methodology
      1. 9.3.1. Secondary Research
      2. 9.3.2. Primary Research
      3. 9.3.3. Models
        1. 9.3.3.1. Company Share Analysis Model
        2. 9.3.3.2. Revenue Based Modeling
        3. 9.3.3.3. Research Limitations

        List of Figures

        FIG. 1 Global Pharmacokinetics Services Market, 2016-2026 (USD Million)
        FIG. 2 Global Pharmacokinetics Services Market Share, by Drug type, 2018 & 2025 (USD Million)
        FIG. 3 Global Small Molecules Pharmacokinetics Services Pharmacokinetics Services Market, 2016-2026 (USD Million)
        FIG. 4 Global Large Molecules Pharmacokinetics Services Pharmacokinetics Services Market, 2016-2026 (USD Million)
        FIG. 5 Global Pharmacokinetics Services Market Share, by Region, 2018 & 2025
        FIG. 6 North America Pharmacokinetics Services Market, 2016-2026
        FIG. 7 U.S. Pharmacokinetics Services Market, 2016-2026
        FIG. 8 Canada Pharmacokinetics Services Market, 2016-2026
        FIG. 9 Europe Pharmacokinetics Services Market, 2016-2026
        FIG. 10 Germany Pharmacokinetics Services Market, 2016-2026
        FIG. 11 France Pharmacokinetics Services Market, 2016-2026
        FIG. 12 U.K. Pharmacokinetics Services Market, 2016-2026
        FIG. 13 Italy Pharmacokinetics Services Market, 2016-2026
        FIG. 14 Spain Pharmacokinetics Services Market, 2016-2026
        FIG. 15 Rest of Europe Pharmacokinetics Services Market, 2016-2026
        FIG. 16 Asia Pacific Pharmacokinetics Services Market, 2016-2026
        FIG. 17 China Pharmacokinetics Services Market, 2016-2026
        FIG. 18 Japan Pharmacokinetics Services Market, 2016-2026
        FIG. 19 India Pharmacokinetics Services Market, 2016-2026
        FIG. 20 South  Korea Pharmacokinetics Services Market, 2016-2026
        FIG. 21 South-East Asia Pharmacokinetics Services Market, 2016-2026
        FIG. 22 Rest of Asia Pacific Pharmacokinetics Services Market, 2016-2026
        FIG. 23 Latin America Pharmacokinetics Services Market, 2016-2026
        FIG. 24 Brazil Pharmacokinetics Services Market, 2016-2026
        FIG. 25 Mexico Pharmacokinetics Services Market, 2016-2026
        FIG. 26 Rest of Latin America Pharmacokinetics Services Market, 2016-2026
        FIG. 27 The Middle-East and Africa Pharmacokinetics Services Market, 2016-2026
        FIG. 28 GCC Countries Pharmacokinetics Services Market, 2016-2026
        FIG. 29 South Africa Pharmacokinetics Services Market, 2016-2026
        FIG. 30 Rest of Middle-East Africa Pharmacokinetics Services Market, 2016-2026
        FIG. 31 Competitor Market Share – Revenue
        FIG. 32 Shanghai Medicilon Inc. Revenue and Growth Rate
        FIG. 33 Shanghai Medicilon Inc. Market Share
        FIG. 34 SGS SA Revenue and Growth Rate
        FIG. 35 SGS SA Market Share
        FIG. 36 PAREXEL International Corporation Revenue and Growth Rate
        FIG. 37 PAREXEL International Corporation Market Share
        FIG. 38 Pacific BioLabs Revenue and Growth Rate
        FIG. 39 Pacific BioLabs Market Share
        FIG. 40 LGC Limited Revenue and Growth Rate
        FIG. 41 LGC Limited Market Share
        FIG. 42 L.P. Revenue and Growth Rate
        FIG. 43 L.P. Market Share
        FIG. 44 GVK Biosciences Private Limited Revenue and Growth Rate
        FIG. 45 GVK Biosciences Private Limited Market Share
        FIG. 46 Frontage Labs Revenue and Growth Rate
        FIG. 47 Frontage Labs Market Share
        FIG. 48 Evotec AG Revenue and Growth Rate
        FIG. 49 Evotec AG Market Share
        FIG. 50 Eurofins Scientific Inc. Revenue and Growth Rate
        FIG. 51 Eurofins Scientific Inc. Market Share
        FIG. 52 Creative Bioarray Revenue and Growth Rate
        FIG. 53 Creative Bioarray Market Share
        FIG. 54 Certara Revenue and Growth Rate
        FIG. 55 Certara Market Share
        FIG. 56 Market Dynamics
        FIG. 57 Global Pharmacokinetics Services – Value Chain Analysis
        FIG. 58 Technology Roadmap and Timeline
        FIG. 59 Market Attractiveness Analysis – By Drug type
        FIG. 60 Market Attractiveness Analysis – By Region
        FIG. 61 Market Channel
        FIG. 62 Marketing Channel Development Trend
        FIG. 63 Growth in World Gross Product, 2008-2018
        

        List of Tables

        TABLE 1 Global Pharmacokinetics Services Market, 2018 & 2025 (USD Million)
        TABLE 2 Global Pharmacokinetics Services market, by Drug type, 2016-2026 (USD Million)
        TABLE 3 Global Pharmacokinetics Services market, by Region, 2016-2026 (USD Million)
        TABLE 4 North America Pharmacokinetics Services Market, by Drug type, 2016-2026 (USD Million)
        TABLE 5 Europe Pharmacokinetics Services Market, by Drug type, 2016-2026 (USD Million)
        TABLE 6 Asia Pacific Pharmacokinetics Services Market, by Drug type, 2016-2026 (USD Million)
        TABLE 7 Latin America Pharmacokinetics Services Market, by Drug type, 2016-2026 (USD Million)
        TABLE 8 The Middle-East and Africa Pharmacokinetics Services Market, by Drug type, 2016-2026 (USD Million)
        TABLE 9 Global Pharmacokinetics Services Market - Company Revenue Analysis 2016-2019 (USD Million)
        TABLE 10 Global Pharmacokinetics Services Market - Company Revenue Share Analysis 2016-2019(%)
        TABLE 11 Acquisitions and Mergers
        TABLE 12 New Product/Service Launch
        TABLE 13 Research & Development Activities
        TABLE 14 Market Drivers
        TABLE 15 Market Restraints
        TABLE 16 Market Opportunities

Industry Major Market Players

  •  Shanghai Medicilon Inc.
  •  SGS SA
  •  PAREXEL International Corporation
  •  Pacific BioLabs
  •  LGC Limited
  •  L.P.
  •  GVK Biosciences Private Limited
  •  Frontage Labs
  •  Evotec AG
  •  Eurofins Scientific Inc.
  •  Creative Bioarray
  •  Certara.