Search Market Research Report

Discover Our Latest Reports
Discover Our Featured Reports
Discover Top Selling Reports

PET-CT Scanning Services Market Size, Share Global Analysis Report, 2020–2026

report img

PET-CT Scanning Services Market By Application (Oncology, Cardiology, Neurology, and Others), and By Service Providers (Hospitals, Diagnostic Centres, PET Centres, and Research Institutes): Global Industry Outlook, Market Size, Business Intelligence, Consumer Preferences, Statistical Surveys, Comprehensive Analysis, Historical Developments, Current Trends, and Forecast 2020–2026

Industry Insights

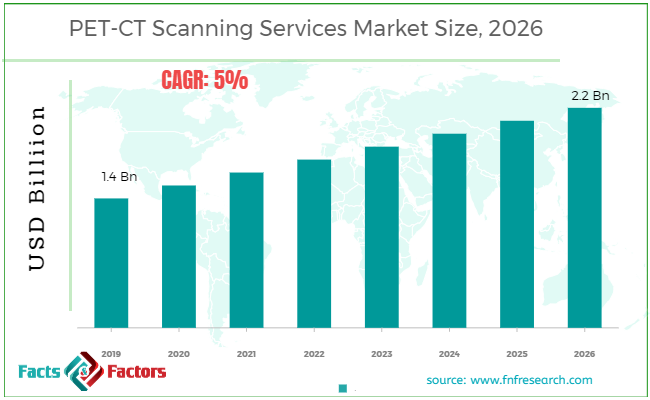
[175+ Pages Report] According to the report published by Facts Factors, the global PET-CT Scanning services market size was worth around USD 1.4 billion in 2019 and is predicted to grow to around USD 2.2 billion by 2026 with a compound annual growth rate (CAGR) of roughly 5% between 2020 and 2026. The report analyzes the global PET-CT Scanning services market drivers, restraints/challenges, and the effect they have on the demands during the projection period. In addition, the report explores emerging opportunities in the PET-CT Scanning services market.

The PET-CT scanning services market report analyzes and notifies the industry statistics at the global as well as regional and country levels in order to acquire a thorough perspective of the entire PET-CT Scanning Services market. The historical and past insights are provided for FY 2016 to FY 2019 whereas projected trends are delivered for FY 2020 to FY 2026. The quantitative and numerical data is represented in terms of value (USD Million) from FY 2016 – 2026.

PET-CT Scanning Services Market Size

To know more about this report | Request Free Sample Copy


logoKey Insights from Primary Research

  • According to the primary CXOs of the global PET-CT Scanning Services market, the market is estimated to witness a substantial growth of nearly 5% over the forecast period.
  • The market was valued at USD 1.4 billion, in 2019 and is expected to be valued at over USD 2.2 billion.
  • On the basis of the application segment, Neurology dominated the global PET-CT Scanning Services market in 2019. In terms of revenue, it accounted for more than a 30% share of the total market in 2019.
  • Asia Pacific market is expected to be the fastest goring region for PET-CT Scanning Services over the forecast period owing to growing investments for R&D and pharmaceutical companies in the region.
  • By geography, the North American region headed the market with a share of above 31%, in 2019.

logoKey Recommendations from Analysts

  • A higher prevalence of disorders, technological advances, high unmet medical needs, and government initiatives are major factors that are expected to drive the development of these services in the near future.
  • The strategic developments such as regional expansion, product innovations, and on-going research and developments by the major companies such as Koninklijke Philips N.V., Siemens AG, Mediso Ltd., Perkin Elmer Inc., etc. is likely to boom the market’s growth over the upcoming years.
  • Our analysts recommend that the Asia Pacific region is predicted to witness significant growth attributed to the growing demand for PET-CT Scanning Services from China and India.      
  • Expansion of pharmaceutical companies especially in emerging markets is anticipated to fuel the demand for PET-CT Scanning Services drugs in developing regions over the forthcoming years.
  • Strengthening the distribution channel and growing availability of bipolar disorder drugs online may also help the major player to cater to the lucrative growth of the market over the years to come.

The quantitative data is further underlined and reinforced by comprehensive qualitative data which comprises various across-the-board market dynamics. The rationales which directly or indirectly impact the PET-CT Scanning Services industry are exemplified through parameters such as growth drivers, restraints, challenges, and opportunities among other impacting factors.

Throughout our research report, we have encompassed all the proven models and tools of industry analysis and extensively illustrated all the key business strategies and business models adopted in the PET-CT Scanning Services industry. The report provides an all-inclusive and detailed competitive landscape prevalent in the PET-CT Scanning Services market.

The report utilizes established industry analysis tools and models such as Porter’s Five Forces framework to analyze and recognize critical business strategies adopted by various stakeholders involved in the entire value chain of the PET-CT Scanning Services industry. The PET-CT Scanning Services market report additionally employs SWOT analysis and PESTLE analysis models for further in-depth analysis.

The report study further includes an in-depth analysis of industry players' market shares and provides an overview of leading players' market position in the PET-CT Scanning Services sector. Key strategic developments in the PET-CT Scanning Services market competitive landscape such as acquisitions & mergers, inaugurations of different products and services, partnerships & joint ventures, MoU agreements, VC & funding activities, R&D activities, and geographic expansion among other noteworthy activities by key players of the PET-CT Scanning Services market are appropriately highlighted in the report.

The PET-CT Scanning Services market research report delivers an acute valuation and taxonomy of the PET-CT Scanning Services industry by practically splitting the market on the basis of different types, categories, and regions. Through the analysis of the historical and projected trends, all the segments and sub-segments were evaluated through the bottom-up approach, and different market sizes have been projected for FY 2020 to FY 2026.

logoReport Scope

Report Attribute

Details

Market Size in 2019

USD 1.4 Billion

Projected Market Size in 2026

USD 2.2 Billion

CAGR Growth Rate

5% CAGR

Base Year

2019

Forecast Years

2020-2026

Key Market Players

Sappi Ltd., Innventia AB, Borregard, Fpinnovations,CelluForce Inc, American Process Inc, STORA ENSO, Daicel FineChem Ltd, Kruger Inc, Nippon Paper Group Inc.


Key Segment

By Application, Service, and Region

Major Regions Covered

North America, Europe, Asia Pacific, Latin America, and the Middle East & Africa

Purchase Options

Request customized purchase options to meet your research needs. Explore purchase options

The regional segmentation of the PET-CT Scanning Services industry includes the complete classification of all the major continents including North America, Latin America, Europe, Asia Pacific, and the Middle East & Africa. Further, country-wise data for the PET-CT Scanning Services industry is provided for the leading economies of the world.

The PET-CT Scanning Services market was approximately accounted for USD 290 Million in 2019. The market is expected to grow above a CAGR of 19% and is anticipated to reach over USD 670 Million by 2026

New drugs and advancements in imaging techniques have been provided for clinical care. The development of medical technology and innovations helps doctors to improve the health sector. The increasing prevalence of chronic diseases and the demand for diagnostics are driving the growth of the global market for PET-scanning services. Changes in lifestyles and the prevalence of chronic diseases around the world, along with the increased availability of PET technology, have contributed to these emerging markets in developing countries.

The increased prevalence of chronic diseases and the need for an efficient diagnostic system have driven market growth. In some ways, short shelf life and low radiopharmaceutical supplies hinder the development of these markets. The need for PET / CT scanning services also increases in oncological radiation and neurological disorders. In addition, the continued development of radiotracers will help this segment expand in clinical applications.

The PET-CT Scanning Services market is segmented based on drug type, application, and region. On the basis of drug type segmentation, the market is classified into Microfibrillated Cellulose and Cellulose Nanocrystals. Based on application, the market is bifurcated into Pulp& paper, Composites & packaging, Biomedical & pharmaceuticals, and Electronics & sensors.

logoSome of the essential players operating in the PET-CT Scanning Services market, but not restricted to include

  • Sappi Ltd.
  • Innventia AB
  • Borregard ASA
  • Fpinnovations
  • CelluForce Inc
  • American Process Inc
  • STORA ENSO
  • Daicel FineChem Ltd
  • Kruger Inc
  • Nippon Paper Group Inc
  • CelluComp Ltd.
  • J. Rettenmaire & Sohne GmBH (JRS)
  • Melodea Ltd
  • Asahi Kasei Corporation

The taxonomy of the PET-CT Scanning Services industry by its scope and segmentation is as follows:

logo By Application Segmentation Analysis

  • Oncology
  • Cardiology
  • Neurology
  • Others

logo By Service providers Segmentation Analysis

  • Hospitals
  • Diagnostic Centres
  • PET Centres
  • Research Institutes

logo Regional Segmentation Analysis

  • North America
    • The U.S.
    • Canada
  • Europe
    • Germany
    • The UK
    • France
    • Spain
    • Italy
    • Rest of Europe
  • Asia Pacific
    • China
    • Japan
    • India
    • South Korea
    • Southeast Asia
    • Rest of Asia Pacific
  • Latin America
    • Brazil
    • Mexico
    • Rest of Latin America
  • Middle East & Africa
    • GCC
    • South Africa
    • Rest of Middle East & Africa

Table of Content

  1. CHAPTER 1. Executive Summary
  2. CHAPTER 2. PET-CT Scanning Services market – Application Analysis
    1. 2.1. Global PET-CT Scanning Services Market – Application Overview
    2. 2.2. Global PET-CT Scanning Services Market Share, by Application, 2019 & 2026 (USD Million)
    3. 2.3. Oncology
      1. 2.3.1. Global Oncology PET-CT Scanning Services Market, 2016-2026 (USD Million)
    4. 2.4. Cardiology
      1. 2.4.1. Global Cardiology PET-CT Scanning Services Market, 2016-2026 (USD Million)
    5. 2.5. Neurology
      1. 2.5.1. Global Neurology PET-CT Scanning Services Market, 2016-2026 (USD Million)
    6. 2.6. Others
      1. 2.6.1. Global Others PET-CT Scanning Services Market, 2016-2026 (USD Million)
  3. CHAPTER 3. PET-CT Scanning Services market – Service Providers Analysis
    1. 3.1. Global PET-CT Scanning Services Market – Service Providers Overview
    2. 3.2. Global PET-CT Scanning Services Market Share, by Service Providers, 2019 & 2026 (USD Million)
    3. 3.3. Hospitals
      1. 3.3.1. Global Hospitals PET-CT Scanning Services Market, 2016-2026 (USD Million)
    4. 3.4. Diagnostic Centres
      1. 3.4.1. Global Diagnostic Centres PET-CT Scanning Services Market, 2016-2026 (USD Million)
    5. 3.5. PET Centres
      1. 3.5.1. Global PET Centres PET-CT Scanning Services Market, 2016-2026 (USD Million)
    6. 3.6. Research Institutes
      1. 3.6.1. Global Research Institutes PET-CT Scanning Services Market, 2016-2026 (USD Million)
  4. CHAPTER 4. PET-CT Scanning Services market – Regional Analysis
    1. 4.1. Global PET-CT Scanning Services Market Regional Overview
    2. 4.2. Global PET-CT Scanning Services Market Share, by Region, 2019 & 2026 (Value)
    3. 4.3. North America
      1. 4.3.1. North America PET-CT Scanning Services Market size and forecast, 2016-2026
      2. 4.3.2. North America PET-CT Scanning Services Market, by Country, 2019 & 2026 (USD Million)
      3. 4.3.3. North America PET-CT Scanning Services Market, by Application, 2016-2026
        1. 4.3.3.1. North America PET-CT Scanning Services Market, by Application, 2016-2026 (USD Million)
      4. 4.3.4. North America PET-CT Scanning Services Market, by Service Providers, 2016-2026
        1. 4.3.4.1. North America PET-CT Scanning Services Market, by Service Providers, 2016-2026 (USD Million)
      5. 4.3.5. U.S.
        1. 4.3.5.1. U.S. Market size and forecast, 2016-2026 (USD Million)
      6. 4.3.6. Canada
        1. 4.3.6.1. Canada Market size and forecast, 2016-2026 (USD Million)
    4. 4.4. Europe
      1. 4.4.1. Europe PET-CT Scanning Services Market size and forecast, 2016-2026
      2. 4.4.2. Europe PET-CT Scanning Services Market, by Country, 2019 & 2026 (USD Million)
      3. 4.4.3. Europe PET-CT Scanning Services Market, by Application, 2016-2026
        1. 4.4.3.1. Europe PET-CT Scanning Services Market, by Application, 2016-2026 (USD Million)
      4. 4.4.4. Europe PET-CT Scanning Services Market, by Service Providers, 2016-2026
        1. 4.4.4.1. Europe PET-CT Scanning Services Market, by Service Providers, 2016-2026 (USD Million)
      5. 4.4.5. Germany
        1. 4.4.5.1. Germany Market size and forecast, 2016-2026 (USD Million)
      6. 4.4.6. France
        1. 4.4.6.1. France Market size and forecast, 2016-2026 (USD Million)
      7. 4.4.7. U.K.
        1. 4.4.7.1. U.K. Market size and forecast, 2016-2026 (USD Million)
      8. 4.4.8. Italy
        1. 4.4.8.1. Italy Market size and forecast, 2016-2026 (USD Million)
      9. 4.4.9. Spain
        1. 4.4.9.1. Spain Market size and forecast, 2016-2026 (USD Million)
      10. 4.4.10. Rest of Europe
        1. 4.4.10.1. Rest of Europe Market size and forecast, 2016-2026 (USD Million)
    5. 4.5. Asia Pacific
      1. 4.5.1. Asia Pacific PET-CT Scanning Services Market size and forecast, 2016-2026
      2. 4.5.2. Asia Pacific PET-CT Scanning Services Market, by Country, 2019 & 2026 (USD Million)
      3. 4.5.3. Asia Pacific PET-CT Scanning Services Market, by Application, 2016-2026
        1. 4.5.3.1. Asia Pacific PET-CT Scanning Services Market, by Application, 2016-2026 (USD Million)
      4. 4.5.4. Asia Pacific PET-CT Scanning Services Market, by Service Providers, 2016-2026
        1. 4.5.4.1. Asia Pacific PET-CT Scanning Services Market, by Service Providers, 2016-2026 (USD Million)
      5. 4.5.5. China
        1. 4.5.5.1. China Market size and forecast, 2016-2026 (USD Million)
      6. 4.5.6. Japan
        1. 4.5.6.1. Japan Market size and forecast, 2016-2026 (USD Million)
      7. 4.5.7. India
        1. 4.5.7.1. India Market size and forecast, 2016-2026 (USD Million)
      8. 4.5.8. South Korea
        1. 4.5.8.1. South Korea Market size and forecast, 2016-2026 (USD Million)
      9. 4.5.9. South-East Asia
        1. 4.5.9.1. South-East Asia Market size and forecast, 2016-2026 (USD Million)
      10. 4.5.10. Rest of Asia Pacific
        1. 4.5.10.1. Rest of Asia Pacific Market size and forecast, 2016-2026 (USD Million)
    6. 4.6. Latin America
      1. 4.6.1. Latin America PET-CT Scanning Services Market size and forecast, 2016-2026
      2. 4.6.2. Latin America PET-CT Scanning Services Market, by Country, 2019 & 2026 (USD Million)
      3. 4.6.3. Latin America PET-CT Scanning Services Market, by Application, 2016-2026
        1. 4.6.3.1. Latin America PET-CT Scanning Services Market, by Application, 2016-2026 (USD Million)
      4. 4.6.4. Latin America PET-CT Scanning Services Market, by Service Providers, 2016-2026
        1. 4.6.4.1. Latin America PET-CT Scanning Services Market, by Service Providers, 2016-2026 (USD Million)
      5. 4.6.5. Brazil
        1. 4.6.5.1. Brazil Market size and forecast, 2016-2026 (USD Million)
      6. 4.6.6. Mexico
        1. 4.6.6.1. Mexico Market size and forecast, 2016-2026 (USD Million)
      7. 4.6.7. Rest of Latin America
        1. 4.6.7.1. Rest of Latin America Market size and forecast, 2016-2026 (USD Million)
    7. 4.7. The Middle-East and Africa
      1. 4.7.1. The Middle-East and Africa PET-CT Scanning Services Market size and forecast, 2016-2026
      2. 4.7.2. The Middle-East and Africa PET-CT Scanning Services Market, by Country, 2019 & 2026 (USD Million)
      3. 4.7.3. The Middle-East and Africa PET-CT Scanning Services Market, by Application, 2016-2026
        1. 4.7.3.1. The Middle-East and Africa PET-CT Scanning Services Market, by Application, 2016-2026 (USD Million)
      4. 4.7.4. The Middle-East and Africa PET-CT Scanning Services Market, by Service Providers, 2016-2026
        1. 4.7.4.1. The Middle-East and Africa PET-CT Scanning Services Market, by Service Providers, 2016-2026 (USD Million)
      5. 4.7.5. GCC Countries
        1. 4.7.5.1. GCC Countries Market size and forecast, 2016-2026 (USD Million)
      6. 4.7.6. South Africa
        1. 4.7.6.1. South Africa Market size and forecast, 2016-2026 (USD Million)
      7. 4.7.7. Rest of Middle-East Africa
        1. 4.7.7.1. Rest of Middle-East Africa Market size and forecast, 2016-2026 (USD Million)
  5. CHAPTER 5. PET-CT Scanning Services market – Competitive Landscape
    1. 5.1. Competitor Market Share – Revenue
    2. 5.2. Market Concentration Rate Analysis, Top 3 and Top 5 Players
    3. 5.3. Strategic Development
      1. 5.3.1. Acquisitions and Mergers
      2. 5.3.2. New Products
      3. 5.3.3. Research & Development Activities
  6. CHAPTER 6. Company Profiles
    1. 6.1. Koninklijke Philips N.V.
      1. 6.1.1. Company Overview
      2. 6.1.2. Koninklijke Philips N.V. Revenue and Gross Margin
      3. 6.1.3. Product portfolio
      4. 6.1.4. Recent initiatives
    2. 6.2. Siemens AG
      1. 6.2.1. Company Overview
      2. 6.2.2. Siemens AG Revenue and Gross Margin
      3. 6.2.3. Product portfolio
      4. 6.2.4. Recent initiatives
    3. 6.3. Mediso Ltd.
      1. 6.3.1. Company Overview
      2. 6.3.2. Mediso Ltd. Revenue and Gross Margin
      3. 6.3.3. Product portfolio
      4. 6.3.4. Recent initiatives
    4. 6.4. Perkin Elmer Inc.
      1. 6.4.1. Company Overview
      2. 6.4.2. Perkin Elmer Inc. Revenue and Gross Margin
      3. 6.4.3. Product portfolio
      4. 6.4.4. Recent initiatives
    5. 6.5. Toshiba Corporation
      1. 6.5.1. Company Overview
      2. 6.5.2. Toshiba Corporation Revenue and Gross Margin
      3. 6.5.3. Product portfolio
      4. 6.5.4. Recent initiatives
    6. 6.6. Hitachi Ltd.
      1. 6.6.1. Company Overview
      2. 6.6.2. Hitachi Ltd. Revenue and Gross Margin
      3. 6.6.3. Product portfolio
      4. 6.6.4. Recent initiatives
    7. 6.7. Positron Corporation
      1. 6.7.1. Company Overview
      2. 6.7.2. Positron Corporation Revenue and Gross Margin
      3. 6.7.3. Product portfolio
      4. 6.7.4. Recent initiatives
    8. 6.8. Yangzhou Kindsway Biotech Co. Ltd.
      1. 6.8.1. Company Overview
      2. 6.8.2. Yangzhou Kindsway Biotech Co. Ltd. Revenue and Gross Margin
      3. 6.8.3. Product portfolio
      4. 6.8.4. Recent initiatives
    9. 6.9. General Electric Co.
      1. 6.9.1. Company Overview
      2. 6.9.2. General Electric Co. Revenue and Gross Margin
      3. 6.9.3. Product portfolio
      4. 6.9.4. Recent initiatives
    10. 6.10. Shimadzu Corporation
      1. 6.10.1. Company Overview
      2. 6.10.2. Shimadzu Corporation Revenue and Gross Margin
      3. 6.10.3. Product portfolio
      4. 6.10.4. Recent initiatives
  7. CHAPTER 7. PET-CT Scanning Services — Industry Analysis
    1. 7.1. PET-CT Scanning Services Market – Key Trends
      1. 7.1.1. Market Drivers
      2. 7.1.2. Market Restraints
      3. 7.1.3. Market Opportunities
    2. 7.2. Value Chain Analysis
    3. 7.3. Technology Roadmap and Timeline
    4. 7.4. PET-CT Scanning Services Market – Attractiveness Analysis
      1. 7.4.1. By Application
      2. 7.4.2. By Service Providers
      3. 7.4.3. By Region
  8. CHAPTER 8. Marketing Strategy Analysis, Distributors
    1. 8.1. Marketing Channel
    2. 8.2. Direct Marketing
    3. 8.3. Indirect Marketing
    4. 8.4. Marketing Channel Development Trend
    5. 8.5. Economic/Political Environmental Change
  9. CHAPTER 9. Report Conclusion
  10. CHAPTER 10. Research Approach & Methodology
    1. 10.1. Report Description
    2. 10.2. Research Scope
    3. 10.3. Research Methodology
      1. 10.3.1. Secondary Research
      2. 10.3.2. Primary Research
      3. 10.3.3. Models
        1. 10.3.3.1. Company Share Analysis Model
        2. 10.3.3.2. Revenue Based Modeling
        3. 10.3.3.3. Research Limitations

        List of Figures

        FIG. 1 Global PET-CT Scanning Services Market, 2016-2026 (USD Million)
        FIG. 2 Global PET-CT Scanning Services Market Share, by Application, 2019 & 2026 (USD Million)
        FIG. 3 Global Oncology PET-CT Scanning Services Market, 2016-2026 (USD Million)
        FIG. 4 Global Cardiology PET-CT Scanning Services Market, 2016-2026 (USD Million)
        FIG. 5 Global Neurology PET-CT Scanning Services Market, 2016-2026 (USD Million)
        FIG. 6 Global Others PET-CT Scanning Services Market, 2016-2026 (USD Million)
        FIG. 7 Global PET-CT Scanning Services Market Share, by Service Providers, 2019 & 2026 (USD Million)
        FIG. 8 Global Hospitals PET-CT Scanning Services Market, 2016-2026 (USD Million)
        FIG. 9 Global Diagnostic Centres PET-CT Scanning Services Market, 2016-2026 (USD Million)
        FIG. 10 Global PET Centres PET-CT Scanning Services Market, 2016-2026 (USD Million)
        FIG. 11 Global Research Institutes PET-CT Scanning Services Market, 2016-2026 (USD Million)
        FIG. 12 Global PET-CT Scanning Services Market Share, by Region, 2019 & 2026
        FIG. 13 North America PET-CT Scanning Services Market, 2016-2026
        FIG. 14 U.S. PET-CT Scanning Services Market, 2016-2026
        FIG. 15 Canada PET-CT Scanning Services Market, 2016-2026
        FIG. 16 Europe PET-CT Scanning Services Market, 2016-2026
        FIG. 17 Germany PET-CT Scanning Services Market, 2016-2026
        FIG. 18 France PET-CT Scanning Services Market, 2016-2026
        FIG. 19 U.K. PET-CT Scanning Services Market, 2016-2026
        FIG. 20 Italy PET-CT Scanning Services Market, 2016-2026
        FIG. 21 Spain PET-CT Scanning Services Market, 2016-2026
        FIG. 22 Rest of Europe PET-CT Scanning Services Market, 2016-2026
        FIG. 23 Asia Pacific PET-CT Scanning Services Market, 2016-2026
        FIG. 24 China PET-CT Scanning Services Market, 2016-2026
        FIG. 25 Japan PET-CT Scanning Services Market, 2016-2026
        FIG. 26 India PET-CT Scanning Services Market, 2016-2026
        FIG. 27 South  Korea PET-CT Scanning Services Market, 2016-2026
        FIG. 28 South-East Asia PET-CT Scanning Services Market, 2016-2026
        FIG. 29 Rest of Asia Pacific PET-CT Scanning Services Market, 2016-2026
        FIG. 30 Latin America PET-CT Scanning Services Market, 2016-2026
        FIG. 31 Brazil PET-CT Scanning Services Market, 2016-2026
        FIG. 32 Mexico PET-CT Scanning Services Market, 2016-2026
        FIG. 33 Rest of Latin America PET-CT Scanning Services Market, 2016-2026
        FIG. 34 The Middle-East and Africa PET-CT Scanning Services Market, 2016-2026
        FIG. 35 GCC Countries PET-CT Scanning Services Market, 2016-2026
        FIG. 36 South Africa PET-CT Scanning Services Market, 2016-2026
        FIG. 37 Rest of Middle-East Africa PET-CT Scanning Services Market, 2016-2026
        FIG. 38 Competitor Market Share – Revenue
        FIG. 39 Koninklijke Philips N.V. Revenue and Growth Rate
        FIG. 40 Koninklijke Philips N.V. Market Share
        FIG. 41 Siemens AG Revenue and Growth Rate
        FIG. 42 Siemens AG Market Share
        FIG. 43 Mediso Ltd. Revenue and Growth Rate
        FIG. 44 Mediso Ltd. Market Share
        FIG. 45 Perkin Elmer Inc. Revenue and Growth Rate
        FIG. 46 Perkin Elmer Inc. Market Share
        FIG. 47 Toshiba Corporation Revenue and Growth Rate
        FIG. 48 Toshiba Corporation Market Share
        FIG. 49 Hitachi Ltd. Revenue and Growth Rate
        FIG. 50 Hitachi Ltd. Market Share
        FIG. 51 Positron Corporation Revenue and Growth Rate
        FIG. 52 Positron Corporation Market Share
        FIG. 53 Yangzhou Kindsway Biotech Co. Ltd. Revenue and Growth Rate
        FIG. 54 Yangzhou Kindsway Biotech Co. Ltd. Market Share
        FIG. 55 General Electric Co. Revenue and Growth Rate
        FIG. 56 General Electric Co. Market Share
        FIG. 57 Shimadzu Corporation Revenue and Growth Rate
        FIG. 58 Shimadzu Corporation Market Share
        FIG. 59 Market Dynamics
        FIG. 60 Global PET-CT Scanning Services – Value Chain Analysis
        FIG. 61 Technology Roadmap and Timeline
        FIG. 62 Market Attractiveness Analysis – By Application
        FIG. 63 Market Attractiveness Analysis – By Service Providers
        FIG. 64 Market Attractiveness Analysis – By Region
        FIG. 65 Market Channel
        FIG. 66 Marketing Channel Development Trend
        FIG. 67 Growth in World Gross Product, 2008-2019

        List of Tables

        TABLE 1 Global PET-CT Scanning Services Market, 2019 & 2026 (USD Million) 20
        TABLE 2 Global PET-CT Scanning Services market, by Application, 2016-2026 (USD Million) 22
        TABLE 3 Global PET-CT Scanning Services market, by Service Providers, 2016-2026 (USD Million) 28
        TABLE 4 Global PET-CT Scanning Services market, by Region, 2016-2026 (USD Million) 33
        TABLE 5 North America PET-CT Scanning Services Market, by Application, 2016-2026 (USD Million) 37
        TABLE 6 North America PET-CT Scanning Services Market, by Service Providers, 2016-2026 (USD Million) 38
        TABLE 7 Europe PET-CT Scanning Services Market, by Application, 2016-2026 (USD Million) 43
        TABLE 8 Europe PET-CT Scanning Services Market, by Service Providers, 2016-2026 (USD Million) 44
        TABLE 9 Asia Pacific PET-CT Scanning Services Market, by Application, 2016-2026 (USD Million) 53
        TABLE 10 Asia Pacific PET-CT Scanning Services Market, by Service Providers, 2016-2026 (USD Million) 54
        TABLE 11 Latin America PET-CT Scanning Services Market, by Application, 2016-2026 (USD Million) 63
        TABLE 12 Latin America PET-CT Scanning Services Market, by Service Providers, 2016-2026 (USD Million) 64
        TABLE 13 The Middle-East and Africa PET-CT Scanning Services Market, by Application, 2016-2026 (USD Million) 70
        TABLE 14 The Middle-East and Africa PET-CT Scanning Services Market, by Service Providers, 2016-2026 (USD Million) 71
        TABLE 15 Global PET-CT Scanning Services Market - Company Revenue Analysis 2016-2019 (USD Million) 75
        TABLE 16 Global PET-CT Scanning Services Market - Company Revenue Share Analysis 2016-2019(%) 77
        TABLE 17 Acquisitions and Mergers 78
        TABLE 18 New Product/Service Launch 78
        TABLE 19 Research & Development Activities 78
        TABLE 20 Market Drivers 101
        TABLE 21 Market Restraints 101
        TABLE 22 Market Opportunities 102

Industry Major Market Players

  • Sappi Ltd.
  • Innventia AB
  • Borregard ASA
  • Fpinnovations
  • CelluForce Inc
  • American Process Inc
  • STORA ENSO
  • Daicel FineChem Ltd
  • Kruger Inc
  • Nippon Paper Group Inc
  • CelluComp Ltd.
  • J. Rettenmaire & Sohne GmBH (JRS)
  • Melodea Ltd
  • Asahi Kasei Corporation