Search Market Research Report

Discover Our Latest Reports
Discover Our Featured Reports
Discover Top Selling Reports

Personal Mobility Devices Market Size, Share Global Analysis Report, 2021 – 2026

report img

Personal Mobility Devices Market By Product (Wheelchairs, Scooters, & Others), By End-User (Personal & Institutional), And By Regions - Global & Regional Industry Perspective, Comprehensive Analysis, and Forecast 2021 – 2026

Industry Insights

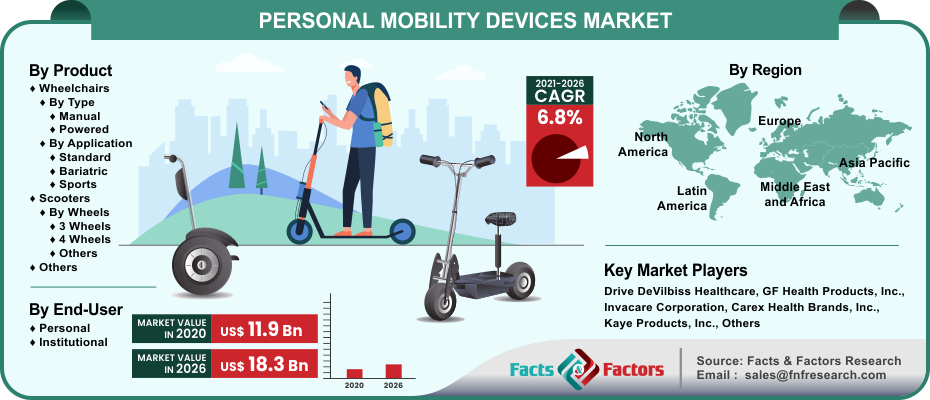
[216+ Pages Report] The latest findings and offers on the personal mobility devices market are released by Facts & Factors offers a neatly titled “Global Personal Mobility Devices Market”. In this report, the global personal mobility devices market will be valued at USD 11.9 Billion in the year 2020 and will grow at an estimated CAGR rate of 6.8% to an overall value of USD 18.3 Billion in the year 2026.

logoMarket Overview

Personal mobility devices or personal transporters are devices that belong to a class of equipment that are often motorized for the sole purpose of transporting human beings from one place to another at speeds that do not exceed 25 km/hr. These devices include electric skateboards, kick scooters, self-balancing unicycles, and electric segways to name a few. Personal mobility devices often function on small volume-based two-stroke engines while the latest versions of devices use vehicle battery and motor-controller technologies.

logoIndustry Growth Factors

The primary drivers for the global personal mobility devices market are focused upon contributing factors such as the rising number target population, rising product line, and an increasing number of accidents causing disabilities-related disorders to name a few. Additionally, growth in the geriatric population coupled with a surge among chronic diseases such as cerebral palsy and arthritis will increase the footprint of the global personal mobility devices market to a larger extent during the advent of the forecast period. Moreover, factors such as long-lasting and continuous usage of mobility-based devices alongside an increasing number of reimbursement policies will fuel the growth of the global personal mobility devices market during the advent of the forecast period.

The global personal mobility devices market is driven by the introduction of transfer lifts, mobility scooters, and automated rollators coupled with a rising number of proactive steps and policies for safeguarding consumers’ interest to name a few. Factors such as the rise of spinal cord injuries coupled with an increasing number of the older population will boost the growth of the global personal mobility devices market during the advent of the forecast period. However, a higher cost of product and low consumer awareness is expected to decrease the growth of the global personal mobility devices market during the advent of the forecast period.

Personal Mobility Devices Market

To know more about this report | Request Free Sample Copy

logoSegmentation Analysis

The global personal mobility devices market is segmented into product, end-users, and region.

On the basis of product, the global personal mobility devices market is divided into wheelchairs, scooters, and others. The segment pertaining to wheelchairs is expected to witness the largest market share during the advent of the forecast period owing to the rising number of accidental and innate mobility-based deformities coupled with increasing demand for indoor and outdoor-based devices to name a few.

Additionally, rising availability and accessibility measures pertaining to wheelchairs coupled with increasing disposable income among users will further cement the growth of the latter segment to a high market share. Based on end-user, the global personal mobility devices market is bifurcated into personal and institutional. The segment pertaining to personalized usage is expected to occupy the largest market share during the advent of the forecast period owing to rising incidences of arthritis and development of earlier disabilities among children to name a few. Moreover, rapid usage of mobile devices coupled with increased demand for customized medical devices will cement the dominant market position of the latter segment during the forecast period.

logo Report Scope

Report Attribute

Details

Market Size in 2020

USD 11.9 Billion

Projected Market Size in 2026

USD 18.3 Billion

CAGR Growth Rate

6.8% CAGR

Base Year

2020

Forecast Years

2021-2026

Key Market Players

Drive DeVilbiss Healthcare, GF Health Products, Inc., Invacare Corporation, Carex Health Brands, Inc., Kaye Products, Inc., Briggs Healthcare, Medline Industries, Inc., NOVA Medical Products, Performance Health, Rollz International, Ottobock, Sunrise Medical Limited, and Permobil, and Others

Key Segment

Product, End-User, and Region

Major Regions Covered

North America, Europe, Asia Pacific, Latin America, and Middle East & Africa

Purchase Options

Request customized purchase options to meet your research needs. Explore purchase options

logo Regional Analysis

North America is expected to witness the largest market share during the advent of the forecast period owing to the rising number of patients being diagnosed with mobility-based disorders coupled with the rising number of geriatric population to name a few. Additionally, the rising number of key market players in the region coupled with favorable reimbursement policies by policies brokers will increase the footprint of the personal mobility devices market during the advent of the forecast period. Europe is expected to witness a substantial market share during the forecast period owing to the rising patient population with mobility disabilities coupled with the presence of well-established healthcare infrastructure to name a few. Moreover, the increased population in terms of age-associated diseases coupled with rising healthcare spending among the government bodies will boost the growth of the personal mobility devices market during the forecast period to a larger boundary.

logo Competitive Players

  • Drive DeVilbiss Healthcare
  • GF Health Products Inc.
  • Invacare Corporation
  • Carex Health Brands Inc.
  • Kaye Products Inc.
  • Briggs Healthcare
  • Medline Industries Inc.
  • NOVA Medical Products
  • Performance Health
  • Rollz International
  • Ottobock
  • Sunrise Medical Limited
  • Permobil

logo By Product Segment Analysis

  • Wheelchairs
    • By Type
      • Manual
      • Powered
    • By Application
      • Standard
      • Bariatric
      • Sports
  • Scooters
    • By Wheels
      • 3 Wheels
      • 4 Wheels
      • Others
  • Others

logo By End-User Segment Analysis

  • Personal
  • Institutional

logo By Regional Segment Analysis

  • North America
    • U.S.
    • Canada
  • Europe
    • UK
    • France
    • Germany
    • Italy
    • Spain
    • Rest of Europe
  • Asia Pacific
    • China
    • Japan
    • India
    • South Korea
    • Southeast Asia
    • Rest of Asia Pacific
  • Latin America
    • Brazil
    • Mexico
    • Rest of Latin America
  • Middle East and Africa
    • GCC Countries
    • South Africa
    • Rest of MEA

Table of Content

  1. Chapter 1 Executive Summary
    1. 1.1. Introduction of Personal Mobility Devices
    2. 1.2. Global Personal Mobility Devices Market, 2019 & 2026 (USD Billion)
    3. 1.3. Global Personal Mobility Devices Market, 2016 – 2026 (USD Billion)
    4. 1.4. Global Personal Mobility Devices Market Absolute Revenue Opportunity, 2016 – 2026 (USD Billion)
    5. 1.5. Global Personal Mobility Devices Market Incremental Revenue Opportunity, 2020 – 2026 (USD Billion)
  2. Chapter 2 Personal Mobility Devices Market – Product Analysis
    1. 2.1. Global Personal Mobility Devices Market – Product Overview
    2. 2.2. Global Personal Mobility Devices Market Share, by Product, 2019 & 2026 (USD Billion)
    3. 2.3. Wheelchairs
      1. 2.3.1. Global Wheelchairs Personal Mobility Devices Market, 2016 – 2026 (USD Billion)
    4. 2.4. Wheelchairs
      1. 2.4.1. Global Wheelchairs Personal Mobility Devices Market, 2016 – 2026 (USD Billion)
    5. 2.5. Others
      1. 2.5.1. Global Others Personal Mobility Devices Market, 2016 – 2026 (USD Billion)
  3. Chapter 3 Personal Mobility Devices Market – End-User Analysis
    1. 3.1. Global Personal Mobility Devices Market – End-User Overview
    2. 3.2. Global Personal Mobility Devices Market Share, by End-User, 2019 & 2026 (USD Billion)
    3. 3.3. Personal
      1. 3.3.1. Global Personal Personal Mobility Devices Market, 2016 – 2026 (USD Billion)
    4. 3.4. Institutional
      1. 3.4.1. Global Institutional Personal Mobility Devices Market, 2016 – 2026 (USD Billion)
  4. Chapter 4 Personal Mobility Devices Market – Regional Analysis
    1. 4.1. Global Personal Mobility Devices Market Regional Overview
    2. 4.2. Global Personal Mobility Devices Market Share, by Region, 2019 & 2026 (USD Billion)
    3. 4.3. North America
      1. 4.3.1. North America Personal Mobility Devices Market, 2016 – 2026 (USD Billion)
        1. 4.3.1.1. North America Personal Mobility Devices Market, by Country, 2016 - 2026 (USD Billion)
      2. 4.3.2. North America Personal Mobility Devices Market, by Product, 2016 – 2026
        1. 4.3.2.1. North America Personal Mobility Devices Market, by Product, 2016 – 2026 (USD Billion)
      3. 4.3.3. North America Personal Mobility Devices Market, by End-User, 2016 – 2026
        1. 4.3.3.1. North America Personal Mobility Devices Market, by End-User, 2016 – 2026 (USD Billion)
      4. 4.3.4. U.S.
        1. 4.3.4.1. U.S. Personal Mobility Devices Market, 2016 – 2026 (USD Billion)
      5. 4.3.5. Canada
        1. 4.3.5.1. Canada Personal Mobility Devices Market, 2016 – 2026 (USD Billion)
    4. 4.4. Europe
      1. 4.4.1. Europe Personal Mobility Devices Market, 2016 – 2026 (USD Billion)
        1. 4.4.1.1. Europe Personal Mobility Devices Market, by Country, 2016 - 2026 (USD Billion)
      2. 4.4.2. Europe Personal Mobility Devices Market, by Product, 2016 – 2026
        1. 4.4.2.1. Europe Personal Mobility Devices Market, by Product, 2016 – 2026 (USD Billion)
      3. 4.4.3. Europe Personal Mobility Devices Market, by End-User, 2016 – 2026
        1. 4.4.3.1. Europe Personal Mobility Devices Market, by End-User, 2016 – 2026 (USD Billion)
      4. 4.4.4. Germany
        1. 4.4.4.1. Germany Personal Mobility Devices Market, 2016 – 2026 (USD Billion)
      5. 4.4.5. France
        1. 4.4.5.1. France Personal Mobility Devices Market, 2016 – 2026 (USD Billion)
      6. 4.4.6. U.K.
        1. 4.4.6.1. U.K. Personal Mobility Devices Market, 2016 – 2026 (USD Billion)
      7. 4.4.7. Italy
        1. 4.4.7.1. Italy Personal Mobility Devices Market, 2016 – 2026 (USD Billion)
      8. 4.4.8. Spain
        1. 4.4.8.1. Spain Personal Mobility Devices Market, 2016 – 2026 (USD Billion)
      9. 4.4.9. Rest of Europe
        1. 4.4.9.1. Rest of Europe Personal Mobility Devices Market, 2016 – 2026 (USD Billion)
    5. 4.5. Asia Pacific
      1. 4.5.1. Asia Pacific Personal Mobility Devices Market, 2016 – 2026 (USD Billion)
        1. 4.5.1.1. Asia Pacific Personal Mobility Devices Market, by Country, 2016 - 2026 (USD Billion)
      2. 4.5.2. Asia Pacific Personal Mobility Devices Market, by Product, 2016 – 2026
        1. 4.5.2.1. Asia Pacific Personal Mobility Devices Market, by Product, 2016 – 2026 (USD Billion)
      3. 4.5.3. Asia Pacific Personal Mobility Devices Market, by End-User, 2016 – 2026
        1. 4.5.3.1. Asia Pacific Personal Mobility Devices Market, by End-User, 2016 – 2026 (USD Billion)
      4. 4.5.4. China
        1. 4.5.4.1. China Personal Mobility Devices Market, 2016 – 2026 (USD Billion)
      5. 4.5.5. Japan
        1. 4.5.5.1. Japan Personal Mobility Devices Market, 2016 – 2026 (USD Billion)
      6. 4.5.6. India
        1. 4.5.6.1. India Personal Mobility Devices Market, 2016 – 2026 (USD Billion)
      7. 4.5.7. South Korea
        1. 4.5.7.1. South Korea Personal Mobility Devices Market, 2016 – 2026 (USD Billion)
      8. 4.5.8. South-East Asia
        1. 4.5.8.1. South-East Asia Personal Mobility Devices Market, 2016 – 2026 (USD Billion)
      9. 4.5.9. Rest of Asia Pacific
        1. 4.5.9.1. Rest of Asia Pacific Personal Mobility Devices Market, 2016 – 2026 (USD Billion)
    6. 4.6. Latin America
      1. 4.6.1. Latin America Personal Mobility Devices Market, 2016 – 2026 (USD Billion)
        1. 4.6.1.1. Latin America Personal Mobility Devices Market, by Country, 2016 - 2026 (USD Billion)
      2. 4.6.2. Latin America Personal Mobility Devices Market, by Product, 2016 – 2026
        1. 4.6.2.1. Latin America Personal Mobility Devices Market, by Product, 2016 – 2026 (USD Billion)
      3. 4.6.3. Latin America Personal Mobility Devices Market, by End-User, 2016 – 2026
        1. 4.6.3.1. Latin America Personal Mobility Devices Market, by End-User, 2016 – 2026 (USD Billion)
      4. 4.6.4. Brazil
        1. 4.6.4.1. Brazil Personal Mobility Devices Market, 2016 – 2026 (USD Billion)
      5. 4.6.5. Mexico
        1. 4.6.5.1. Mexico Personal Mobility Devices Market, 2016 – 2026 (USD Billion)
      6. 4.6.6. Rest of Latin America
        1. 4.6.6.1. Rest of Latin America Personal Mobility Devices Market, 2016 – 2026 (USD Billion)
    7. 4.7. The Middle-East and Africa
      1. 4.7.1. The Middle-East and Africa Personal Mobility Devices Market, 2016 – 2026 (USD Billion)
        1. 4.7.1.1. The Middle-East and Africa Personal Mobility Devices Market, by Country, 2016 - 2026 (USD Billion)
      2. 4.7.2. The Middle-East and Africa Personal Mobility Devices Market, by Product, 2016 – 2026
        1. 4.7.2.1. The Middle-East and Africa Personal Mobility Devices Market, by Product, 2016 – 2026 (USD Billion)
      3. 4.7.3. The Middle-East and Africa Personal Mobility Devices Market, by End-User, 2016 – 2026
        1. 4.7.3.1. The Middle-East and Africa Personal Mobility Devices Market, by End-User, 2016 – 2026 (USD Billion)
      4. 4.7.4. GCC Countries
        1. 4.7.4.1. GCC Countries Personal Mobility Devices Market, 2016 – 2026 (USD Billion)
      5. 4.7.5. South Africa
        1. 4.7.5.1. South Africa Personal Mobility Devices Market, 2016 – 2026 (USD Billion)
      6. 4.7.6. Rest of Middle-East Africa
        1. 4.7.6.1. Rest of Middle-East Africa Personal Mobility Devices Market, 2016 – 2026 (USD Billion)
  5. Chapter 5 Personal Mobility Devices Market – Competitive Landscape
    1. 5.1. Competitor Market Share – Revenue
    2. 5.2. Market Concentration Rate Analysis, Top 3 and Top 5 Players
    3. 5.3. Strategic Developments
      1. 5.3.1. Acquisitions and Mergers
      2. 5.3.2. New Products
      3. 5.3.3. Research & Development Activities
  6. Chapter 6 Company Profiles
    1. 6.1. Drive DeVilbiss Healthcare
      1. 6.1.1. Company Overview
      2. 6.1.2. Product/Service Portfolio
      3. 6.1.3. Drive DeVilbiss Healthcare Sales, Revenue, and Gross Margin
      4. 6.1.4. Drive DeVilbiss Healthcare Revenue and Growth Rate
      5. 6.1.5. Drive DeVilbiss Healthcare Market Share
      6. 6.1.6. Recent Initiatives, Funding/VC Activities, and Technological Innovations
    2. 6.2. GF Health Products Inc
      1. 6.2.1. Company Overview
      2. 6.2.2. Product/Service Portfolio
      3. 6.2.3. GF Health Products Inc Sales, Revenue, and Gross Margin
      4. 6.2.4. GF Health Products Inc Revenue and Growth Rate
      5. 6.2.5. GF Health Products Inc Market Share
      6. 6.2.6. Recent Initiatives, Funding/VC Activities, and Technological Innovations
    3. 6.3. Invacare Corporation
      1. 6.3.1. Company Overview
      2. 6.3.2. Product/Service Portfolio
      3. 6.3.3. Invacare Corporation Sales, Revenue, and Gross Margin
      4. 6.3.4. Invacare Corporation Revenue and Growth Rate
      5. 6.3.5. Invacare Corporation Market Share
      6. 6.3.6. Recent Initiatives, Funding/VC Activities, and Technological Innovations
    4. 6.4. Carex Health Brands Inc
      1. 6.4.1. Company Overview
      2. 6.4.2. Product/Service Portfolio
      3. 6.4.3. Carex Health Brands Inc Sales, Revenue, and Gross Margin
      4. 6.4.4. Carex Health Brands Inc Revenue and Growth Rate
      5. 6.4.5. Carex Health Brands Inc Market Share
      6. 6.4.6. Recent Initiatives, Funding/VC Activities, and Technological Innovations
    5. 6.5. Kaye Products Inc
      1. 6.5.1. Company Overview
      2. 6.5.2. Product/Service Portfolio
      3. 6.5.3. Kaye Products Inc Sales, Revenue, and Gross Margin
      4. 6.5.4. Kaye Products Inc Revenue and Growth Rate
      5. 6.5.5. Kaye Products Inc Market Share
      6. 6.5.6. Recent Initiatives, Funding/VC Activities, and Technological Innovations
    6. 6.6. Briggs Healthcare
      1. 6.6.1. Company Overview
      2. 6.6.2. Product/Service Portfolio
      3. 6.6.3. Briggs Healthcare Sales, Revenue, and Gross Margin
      4. 6.6.4. Briggs Healthcare Revenue and Growth Rate
      5. 6.6.5. Briggs Healthcare Market Share
      6. 6.6.6. Recent Initiatives, Funding/VC Activities, and Technological Innovations
    7. 6.7. Medline Industries Inc
      1. 6.7.1. Company Overview
      2. 6.7.2. Product/Service Portfolio
      3. 6.7.3. Medline Industries Inc Sales, Revenue, and Gross Margin
      4. 6.7.4. Medline Industries Inc Revenue and Growth Rate
      5. 6.7.5. Medline Industries Inc Market Share
      6. 6.7.6. Recent Initiatives, Funding/VC Activities, and Technological Innovations
    8. 6.8. NOVA Medical Products
      1. 6.8.1. Company Overview
      2. 6.8.2. Product/Service Portfolio
      3. 6.8.3. NOVA Medical Products Sales, Revenue, and Gross Margin
      4. 6.8.4. NOVA Medical Products Revenue and Growth Rate
      5. 6.8.5. NOVA Medical Products Market Share
      6. 6.8.6. Recent Initiatives, Funding/VC Activities, and Technological Innovations
    9. 6.9. Performance Health
      1. 6.9.1. Company Overview
      2. 6.9.2. Product/Service Portfolio
      3. 6.9.3. Performance Health Sales, Revenue, and Gross Margin
      4. 6.9.4. Performance Health Revenue and Growth Rate
      5. 6.9.5. Performance Health Market Share
      6. 6.9.6. Recent Initiatives, Funding/VC Activities, and Technological Innovations
    10. 6.10. Rollz International
      1. 6.10.1. Company Overview
      2. 6.10.2. Product/Service Portfolio
      3. 6.10.3. Rollz International Sales, Revenue, and Gross Margin
      4. 6.10.4. Rollz International Revenue and Growth Rate
      5. 6.10.5. Rollz International Market Share
      6. 6.10.6. Recent Initiatives, Funding/VC Activities, and Technological Innovations
    11. 6.11. Ottobock
      1. 6.11.1. Company Overview
      2. 6.11.2. Product/Service Portfolio
      3. 6.11.3. Ottobock Sales, Revenue, and Gross Margin
      4. 6.11.4. Ottobock Revenue and Growth Rate
      5. 6.11.5. Ottobock Market Share
      6. 6.11.6. Recent Initiatives, Funding/VC Activities, and Technological Innovations
    12. 6.12. Sunrise Medical Limited
      1. 6.12.1. Company Overview
      2. 6.12.2. Product/Service Portfolio
      3. 6.12.3. Sunrise Medical Limited Sales, Revenue, and Gross Margin
      4. 6.12.4. Sunrise Medical Limited Revenue and Growth Rate
      5. 6.12.5. Sunrise Medical Limited Market Share
      6. 6.12.6. Recent Initiatives, Funding/VC Activities, and Technological Innovations
    13. 6.13. Permobil
      1. 6.13.1. Company Overview
      2. 6.13.2. Product/Service Portfolio
      3. 6.13.3. Permobil Sales, Revenue, and Gross Margin
      4. 6.13.4. Permobil Revenue and Growth Rate
      5. 6.13.5. Permobil Market Share
      6. 6.13.6. Recent Initiatives, Funding/VC Activities, and Technological Innovations
  7. Chapter 7 Personal Mobility Devices — Industry Analysis
    1. 7.1. Introduction and Taxonomy
    2. 7.2. Personal Mobility Devices Market – Key Trends
      1. 7.2.1. Market Drivers
      2. 7.2.2. Market Restraints
      3. 7.2.3. Market Opportunities
    3. 7.3. Value Chain Analysis
    4. 7.4. Key Mandates and Regulations
    5. 7.5. Technology Roadmap and Timeline
    6. 7.6. Personal Mobility Devices Market – Attractiveness Analysis
      1. 7.6.1. By Product
      2. 7.6.2. By End-User
      3. 7.6.3. By Region
  8. Chapter 8 Industrial Chain, Sourcing Strategy, and Downstream Buyers
    1. 8.1. Personal Mobility Devices Industrial Chain Analysis
    2. 8.2. Downstream Buyers
    3. 8.3. Distributors/Traders List
  9. Chapter 9 Marketing Strategy Analysis
    1. 9.1. Marketing Channel
    2. 9.2. Direct Marketing
    3. 9.3. Indirect Marketing
    4. 9.4. Marketing Channel Development Trends
    5. 9.5. Economic/Political Environmental Change
  10. Chapter 10 Report Conclusion & Key Insights
    1. 10.1. Key Insights from Primary Interviews & Surveys Respondents
    2. 10.2. Key Takeaways from Analysts, Consultants, and Industry Leaders
  11. Chapter 11 Research Approach & Methodology
    1. 11.1. Report Description
    2. 11.2. Research Scope
    3. 11.3. Research Methodology
      1. 11.3.1. Secondary Research
      2. 11.3.2. Primary Research
      3. 11.3.3. Statistical Models
        1. 11.3.3.1. Company Share Analysis Model
        2. 11.3.3.2. Revenue Based Modeling
      4. 11.3.4. Research Limitations

      List of Figures

      Fig.1	Product Picture of Personal Mobility Devices
      Fig.2	Global Personal Mobility Devices Market, 2016 – 2026 (USD Billion)
      Fig.3	Global Personal Mobility Devices Market Absolute Revenue Opportunity, 2016 – 2026 (USD Billion)
      Fig.4	Global Personal Mobility Devices Market Incremental Revenue Opportunity, 2020 – 2026 (USD Billion)
      Fig.5	Global Personal Mobility Devices Market Share, by Product, 2019 & 2026 (USD Billion)
      Fig.6	Global Wheelchairs  Personal Mobility Devices Market, 2016 – 2026 (USD Billion)
      Fig.7	Global Wheelchairs  Personal Mobility Devices Market, 2016 – 2026 (USD Billion)
      Fig.8	Global Others Personal Mobility Devices Market, 2016 – 2026 (USD Billion)
      Fig.9	Global Personal Mobility Devices Market Share, by End-User, 2019 & 2026 (USD Billion)
      Fig.10	Global Personal  Personal Mobility Devices Market, 2016 – 2026 (USD Billion)
      Fig.11	Global Institutional Personal Mobility Devices Market, 2016 – 2026 (USD Billion)
      Fig.12	Global Personal Mobility Devices Market Share, by Region, 2019 & 2026 (USD Billion)
      Fig.13	North America Personal Mobility Devices Market, 2016 – 2026 (USD Billion)
      Fig.14	U.S. Personal Mobility Devices Market, 2016 – 2026 (USD Billion)
      Fig.15	Canada Personal Mobility Devices Market, 2016 – 2026 (USD Billion)
      Fig.16	Europe Personal Mobility Devices Market, 2016 – 2026 (USD Billion)
      Fig.17	Germany Personal Mobility Devices Market, 2016 – 2026 (USD Billion)
      Fig.18	France Personal Mobility Devices Market, 2016 – 2026 (USD Billion)
      Fig.19	U.K. Personal Mobility Devices Market, 2016 – 2026 (USD Billion)
      Fig.20	Italy Personal Mobility Devices Market, 2016 – 2026 (USD Billion)
      Fig.21	Spain Personal Mobility Devices Market, 2016 – 2026 (USD Billion)
      Fig.22	Rest of Europe Personal Mobility Devices Market, 2016 – 2026 (USD Billion)
      Fig.23	Asia Pacific Personal Mobility Devices Market, 2016 – 2026 (USD Billion)
      Fig.24	China Personal Mobility Devices Market, 2016 – 2026 (USD Billion)
      Fig.25	Japan Personal Mobility Devices Market, 2016 – 2026 (USD Billion)
      Fig.26	India Personal Mobility Devices Market, 2016 – 2026 (USD Billion)
      Fig.27	South  Korea Personal Mobility Devices Market, 2016 – 2026 (USD Billion)
      Fig.28	South-East Asia Personal Mobility Devices Market, 2016 – 2026 (USD Billion)
      Fig.29	Rest of Asia Pacific Personal Mobility Devices Market, 2016 – 2026 (USD Billion)
      Fig.30	Latin America Personal Mobility Devices Market, 2016 – 2026 (USD Billion)
      Fig.31	Brazil Personal Mobility Devices Market, 2016 – 2026 (USD Billion)
      Fig.32	Mexico Personal Mobility Devices Market, 2016 – 2026 (USD Billion)
      Fig.33	Rest of Latin America Personal Mobility Devices Market, 2016 – 2026 (USD Billion)
      Fig.34	The Middle-East and Africa Personal Mobility Devices Market, 2016 – 2026 (USD Billion)
      Fig.35	GCC Countries Personal Mobility Devices Market, 2016 – 2026 (USD Billion)
      Fig.36	South Africa Personal Mobility Devices Market, 2016 – 2026 (USD Billion)
      Fig.37	Rest of Middle-East Africa Personal Mobility Devices Market, 2016 – 2026 (USD Billion)
      Fig.38	Competitor Market Share – Revenue
      Fig.39	Drive DeVilbiss Healthcare Revenue and Growth Rate
      Fig.40	Drive DeVilbiss Healthcare Market Share
      Fig.41	GF Health Products Inc Revenue and Growth Rate
      Fig.42	GF Health Products Inc Market Share
      Fig.43	Invacare Corporation Revenue and Growth Rate
      Fig.44	Invacare Corporation Market Share
      Fig.45	Carex Health Brands Inc Revenue and Growth Rate
      Fig.46	Carex Health Brands Inc Market Share
      Fig.47	Kaye Products Inc Revenue and Growth Rate
      Fig.48	Kaye Products Inc Market Share
      Fig.49	Briggs Healthcare Revenue and Growth Rate
      Fig.50	Briggs Healthcare Market Share
      Fig.51	Medline Industries Inc Revenue and Growth Rate
      Fig.52	Medline Industries Inc Market Share
      Fig.53	NOVA Medical Products Revenue and Growth Rate
      Fig.54	NOVA Medical Products Market Share
      Fig.55	Performance Health Revenue and Growth Rate
      Fig.56	Performance Health Market Share
      Fig.57	Rollz International Revenue and Growth Rate
      Fig.58	Rollz International Market Share
      Fig.59	Ottobock Revenue and Growth Rate
      Fig.60	Ottobock Market Share
      Fig.61	Sunrise Medical Limited Revenue and Growth Rate
      Fig.62	Sunrise Medical Limited Market Share
      Fig.63	Permobil Revenue and Growth Rate
      Fig.64	Permobil Market Share
      Fig.65	Market Dynamics
      Fig.66	Global Personal Mobility Devices – Value Chain Analysis
      Fig.67	Key Mandates and Regulations
      Fig.68	Technology Roadmap and Timeline
      Fig.69	Market Attractiveness Analysis – By Product
      Fig.70	Market Attractiveness Analysis – By End-User
      Fig.71	Market Attractiveness Analysis – By Region
      Fig.72	Personal Mobility Devices Industrial Chain Analysis
      Fig.73	Market Channels
      Fig.74	Marketing Channel Development Trend
      Fig.75	Growth in World Gross Product, 2008-2018
      

      List of Tables

      Table 1	Global Personal Mobility Devices Market, 2019 & 2026 (USD Billion)
      Table 2	Global Personal Mobility Devices Market, by Product, 2016 – 2026 (USD Billion)
      Table 3	Global Personal Mobility Devices Market, by End-User, 2016 – 2026 (USD Billion)
      Table 4	Global Personal Mobility Devices Market, by Region, 2016 – 2026 (USD Billion)
      Table 5	North America Personal Mobility Devices Market, by Country, 2016 – 2026 (USD Billion)
      Table 6	North America Personal Mobility Devices Market, by Product, 2016 – 2026 (USD Billion)
      Table 7	North America Personal Mobility Devices Market, by End-User, 2016 – 2026 (USD Billion)
      Table 8	Europe Personal Mobility Devices Market, by Country, 2016 – 2026 (USD Billion)
      Table 9	Europe Personal Mobility Devices Market, by Product, 2016 – 2026 (USD Billion)
      Table 10 Europe Personal Mobility Devices Market, by End-User, 2016 – 2026 (USD Billion)
      Table 11 Asia Pacific Personal Mobility Devices Market, by Country, 2016 – 2026 (USD Billion)
      Table 12 Asia Pacific Personal Mobility Devices Market, by Product, 2016 – 2026 (USD Billion)
      Table 13 Asia Pacific Personal Mobility Devices Market, by End-User, 2016 – 2026 (USD Billion)
      Table 14 Latin America Personal Mobility Devices Market, by Country, 2016 – 2026 (USD Billion)
      Table 15 Latin America Personal Mobility Devices Market, by Product, 2016 – 2026 (USD Billion)
      Table 16 Latin America Personal Mobility Devices Market, by End-User, 2016 – 2026 (USD Billion)
      Table 17 The Middle-East and Africa Personal Mobility Devices Market, by Country, 2016 – 2026 (USD Billion)
      Table 18 The Middle-East and Africa Personal Mobility Devices Market, by Product, 2016 – 2026 (USD Billion)
      Table 19 The Middle-East and Africa Personal Mobility Devices Market, by End-User, 2016 – 2026 (USD Billion)
      Table 20 Global Personal Mobility Devices Market - Company Revenue Analysis, 2016 – 2019 (USD Billion)
      Table 21 Global Personal Mobility Devices Market - Company Revenue Share Analysis, 2016 – 2019 (%)
      Table 22 Acquisitions and Mergers
      Table 23 Market Drivers – Impact Analysis
      Table 24 Market Restraints
      Table 25 Market Opportunities
      Table 26 Major Buyers of Personal Mobility Devices
      Table 27 Distributors/Traders of Personal Mobility Devices by Region
      

Industry Major Market Players

  • Drive DeVilbiss Healthcare
  • GF Health Products Inc.
  • Invacare Corporation
  • Carex Health Brands Inc.
  • Kaye Products Inc.
  • Briggs Healthcare
  • Medline Industries Inc.
  • NOVA Medical Products
  • Performance Health
  • Rollz International
  • Ottobock
  • Sunrise Medical Limited
  • Permobil