Search Market Research Report

Discover Our Latest Reports
Discover Our Featured Reports
Discover Top Selling Reports

Peanut Butter Market Size, Share Global Analysis Report, 2020–2026

report img

Peanut Butter Market By Type (Smooth Peanut Butter, Crunchy Peanut Butter, and Others) and By Distribution Channel (Supermarkets and Hypermarkets, Convenience Stores, Online Stores, and Others): Global Industry Outlook, Market Size, Business Intelligence, Consumer Preferences, Statistical Surveys, Comprehensive Analysis, Historical Developments, Current Trends, and Forecast 2020–2026

Industry Insights

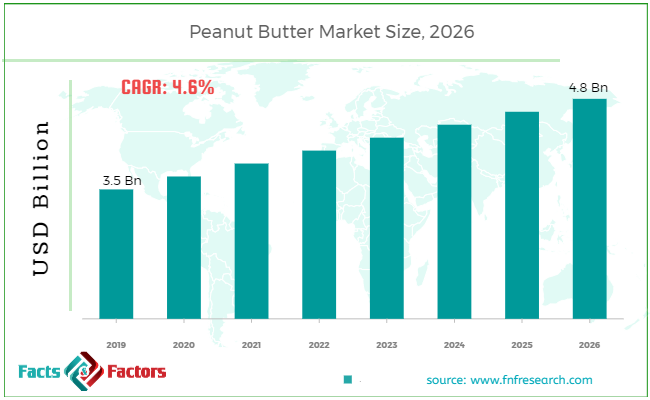
[190+ Pages Report] According to the report published by Facts Factors, the global peanut butter market size was worth around USD 3.5 billion in 2019 and is predicted to grow to around USD 4.8 billion by 2026 with a compound annual growth rate (CAGR) of roughly 4.6% between 2020 and 2026. The report analyzes the global peanut butter market drivers, restraints/challenges, and the effect they have on the demands during the projection period. In addition, the report explores emerging opportunities in the peanut butter market.

Peanut Butter Market Size

To know more about this report | Request Free Sample Copy

This specialized and expertise-oriented industry research report scrutinizes the technical and commercial business outlook of the peanut butter industry. The report analyzes and declares the historical and current trends analysis of the peanut butter industry and subsequently recommends the projected trends anticipated to be observed in the peanut butter market during the upcoming years.

The peanut butter market report analyzes and notifies the industry statistics at the global as well as regional and country levels in order to acquire a thorough perspective of the entire peanut butter market. The historical and past insights are provided for FY 2016 to FY 2019 whereas projected trends are delivered for FY 2020 to FY 2026. The quantitative and numerical data is represented in terms of both volume (Kilo Tons) and value (USD Million) from FY 2016 – 2026.


logoKey Insights from Primary Research

  • As per our primary respondents, the global peanut market is set to grow annually at a rate of around 4.6%
  • It was established through primary research that the global peanut butter market was valued at around USD 3.5 billion in 2019
  • The growing demand for nutritional and convenience foods is anticipated to boost the peanut butter market
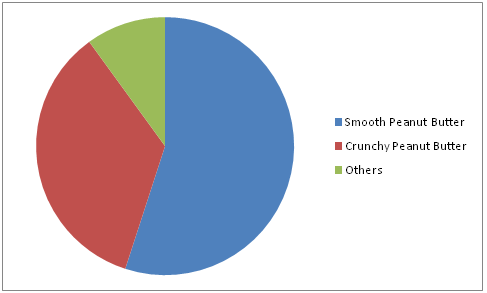
  • The “Smooth Peanut Butter” category, on the basis of type segmentation, was the leading revenue-generating category in 2019
  • The “Supermarkets and Hypermarkets” category, on the basis of application segmentation, was the leading revenue-generating category in 2019

logoKey Recommendations from Analysts

  • Due to the growing hectic lifestyle globally, people are more inclined towards convenience food. Hence the peanut butter market is expected to grow in the upcoming years.
  • North America region is anticipated to continue its dominance in the peanut butter market in the forecast period
  • Asia Pacific region is anticipated to register a significant growth rate in the peanut butter market due to emerging economies such as India, and China.
  • Peanut butter is rich with vitamin E, which is a strong source of antioxidants. Hence health enthusiasts are also expected to contribute to the peanut butter market as a breakfast or snack option.
  • Peanut butter applications in the cosmetics industry will boost in the upcoming years due to the growing vegan population globally

logoMarket Share in 2019 – By Type

Peanut Butter Market

To know more about this report | Request Free Sample Copy


The quantitative data is further underlined and reinforced by comprehensive qualitative data which comprises various across-the-board market dynamics. The rationales which directly or indirectly impact the peanut butter industry are exemplified through parameters such as growth drivers, restraints, challenges, and opportunities among other impacting factors.

Throughout our research report, we have encompassed all the proven models and tools of industry analysis and extensively illustrated all the key business strategies and business models adopted in the peanut butter industry. The report provides an all-inclusive and detailed competitive landscape prevalent in the peanut butter market.

The report utilizes established industry analysis tools and models such as Porter’s Five Forces framework to analyze and recognize critical business strategies adopted by various stakeholders involved in the entire value chain of the peanut butter industry. The peanut butter market report additionally employs SWOT analysis and PESTLE analysis models for further in-depth analysis.

The report study further includes an in-depth analysis of industry players' market shares and provides an overview of leading players' market position in the peanut butter sector. Key strategic developments in the peanut butter market competitive landscape such as acquisitions & mergers, inaugurations of different products and services, partnerships & joint ventures, MoU agreements, VC & funding activities, R&D activities, and geographic expansion among other noteworthy activities by key players of the peanut butter market are appropriately highlighted in the report.

The growing preference for nutritional food globally is anticipated to boost the peanut butter market. Peanut butter is rich in dietary fibers, vitamins, and low calories fats and hence is preferred worldwide by health enthusiasts. It can be used as a spread for snacks and breakfasts along for a variety of desserts and convenience foods. The growing hectic population globally has led to boost the peanut butter market because of the convenience it provides as well as acts as an energy booster.

North America is the major consumer of peanut butter and the U.S. has the highest consumption of peanut butter. However, in Asia Pacific region, there is a growing demand from emerging economies such as India and China.

The peanut butter market research report delivers an acute valuation and taxonomy of the peanut butter industry by practically splitting the market on the basis of different types, applications, and regions. Through the analysis of the historical and projected trends, all the segments and sub-segments were evaluated through the bottom-up approach, and different market sizes have been projected for FY 2020 to FY 2026.

logoReport Scope

Report Attribute

Details

Market Size in 2019

USD 3.5 Billion

Projected Market Size in 2026

USD 4.8 Billion

CAGR Growth Rate

4.6% CAGR

Base Year

2019

Forecast Years

2020-2026

Key Market Players

Hormel Foods Corporation, Kraft Canada Inc., The Hershey Company, Unilever, ConAgra Foods Inc., Algood Food Company Inc., Dr. Oetker India Pvt Ltd, Procter & Gamble, Boulder Brands Inc., and The J.M. Smucker Company., and Others

Key Segment

By Type, Distribution, and Region

Major Regions Covered

North America, Europe, Asia Pacific, Latin America, and the Middle East & Africa

Purchase Options

Request customized purchase options to meet your research needs.Explore purchase options

The regional segmentation of the peanut butter industry includes the complete classification of all the major continents including North America, Latin America, Europe, Asia Pacific, and the Middle East & Africa. Further, country-wise data for the peanut butter industry is provided for the leading economies of the world.

The peanut butter market is segmented based on type and application. On the basis of type segmentation, the market is classified into smooth peanut butter, crunchy peanut butter, and others. In terms of application segmentation, the market is bifurcated into supermarkets and hypermarkets, convenience stores, online stores, and others.

logoSome of the essential players operating in the peanut butter market, but not restricted to include

  •  Hormel Foods Corporation
  • Kraft Canada Inc.
  •  The Hershey Company
  •  Unilever
  •  ConAgra Foods Inc.
  •  Algood Food Company Inc.
  •  Dr. Oetker India Pvt Ltd
  •  Procter & Gamble
  •  Boulder Brands Inc.
  •  The J.M. Smucker Company

The taxonomy of the peanut butter industry by its scope and segmentation is as follows:

logo By Type Segmentation Analysis

  • Smooth Peanut Butter
  • Crunchy Peanut Butter
  • Others

logo By Distribution Channel Segmentation Analysis

  • Supermarkets and Hypermarkets
  • Convenience Stores
  • Online Stores
  • Others

logo By Regional Segmentation Analysis

  • North America
    • The U.S.
    • Canada
  • Europe
    • Germany
    • The UK
    • France
    • Spain
    • Italy
    • Rest of Europe
  • Asia Pacific
    • China
    • Japan
    • India
    • South Korea
    • Southeast Asia
    • Rest of Asia Pacific
  • Latin America
    • Brazil
    • Mexico
    • Rest of Latin America
  • Middle East & Africa
    • GCC
    • South Africa
    • Rest of Middle East & Africa

Table of Content

  1. Chapter 1 Executive Summary
    1. 1.1. Introduction of Peanut Butter
    2. 1.2. Global Peanut Butter Market, 2019 & 2026 (USD Million)
    3. 1.3. Global Peanut Butter Market, 2016 – 2026 (USD Million) (Kilo Tons)
    4. 1.4. Global Peanut Butter Market Absolute Revenue Opportunity, 2016 – 2026 (USD Million)
    5. 1.5. Global Peanut Butter Market Incremental Revenue Opportunity, 2020 – 2026 (USD Million)
  2. Chapter 2 Peanut Butter Market – Type Analysis
    1. 2.1. Global Peanut Butter Market – Type Overview
    2. 2.2. Global Peanut Butter Market Share, by Type, 2019 & 2026 (USD Million)
    3. 2.3. Global Peanut Butter Market share, by Type, 2019 & 2026 (Kilo Tons)
    4. 2.4. Smooth Peanut Butter
      1. 2.4.1. Global Smooth Peanut Butter Peanut Butter Market, 2016 – 2026 (USD Million)
      2. 2.4.2. Global Smooth Peanut Butter Peanut Butter Market, 2016 – 2026 (Kilo Tons)
    5. 2.5. Crunchy Peanut Butter
      1. 2.5.1. Global Crunchy Peanut Butter Peanut Butter Market, 2016 – 2026 (USD Million)
      2. 2.5.2. Global Crunchy Peanut Butter Peanut Butter Market, 2016 – 2026 (Kilo Tons)
    6. 2.6. Others
      1. 2.6.1. Global Others Peanut Butter Market, 2016 – 2026 (USD Million)
      2. 2.6.2. Global Others Peanut Butter Market, 2016 – 2026 (Kilo Tons)
  3. Chapter 3 Peanut Butter Market – Distribution Channel Analysis
    1. 3.1. Global Peanut Butter Market – Distribution Channel Overview
    2. 3.2. Global Peanut Butter Market Share, by Distribution Channel, 2019 & 2026 (USD Million)
    3. 3.3. Global Peanut Butter Market share, by Distribution Channel, 2019 & 2026 (Kilo Tons)
    4. 3.4. Supermarkets and Hypermarkets
      1. 3.4.1. Global Supermarkets and Hypermarkets Peanut Butter Market, 2016 – 2026 (USD Million)
      2. 3.4.2. Global Supermarkets and Hypermarkets Peanut Butter Market, 2016 – 2026 (Kilo Tons)
    5. 3.5. Convenience Stores
      1. 3.5.1. Global Convenience Stores Peanut Butter Market, 2016 – 2026 (USD Million)
      2. 3.5.2. Global Convenience Stores Peanut Butter Market, 2016 – 2026 (Kilo Tons)
    6. 3.6. Online Stores
      1. 3.6.1. Global Online Stores Peanut Butter Market, 2016 – 2026 (USD Million)
      2. 3.6.2. Global Online Stores Peanut Butter Market, 2016 – 2026 (Kilo Tons)
    7. 3.7. Others
      1. 3.7.1. Global Others Peanut Butter Market, 2016 – 2026 (USD Million)
      2. 3.7.2. Global Others Peanut Butter Market, 2016 – 2026 (Kilo Tons)
  4. Chapter 4 Peanut Butter Market – Regional Analysis
    1. 4.1. Global Peanut Butter Market Regional Overview
    2. 4.2. Global Peanut Butter Market Share, by Region, 2019 & 2026 (USD Million)
    3. 4.3. Global Peanut Butter Market Share, by Region, 2019 & 2026 (Kilo Tons)
    4. 4.4. North America
      1. 4.4.1. North America Peanut Butter Market, 2016 – 2026 (USD Million)
        1. 4.4.1.1. North America Peanut Butter Market, by Country, 2016 – 2026 (USD Million)
      2. 4.4.2. North America Market, 2016 – 2026 (Kilo Tons)
        1. 4.4.2.1. North America Peanut Butter Market, by Country, 2016 – 2026 (Kilo Tons)
      3. 4.4.3. North America Peanut Butter Market, by Type, 2016 – 2026
        1. 4.4.3.1. North America Peanut Butter Market, by Type, 2016 – 2026 (USD Million)
        2. 4.4.3.2. North America Peanut Butter Market, by Type, 2016 – 2026 (Kilo Tons)
      4. 4.4.4. North America Peanut Butter Market, by Distribution Channel, 2016 – 2026
        1. 4.4.4.1. North America Peanut Butter Market, by Distribution Channel, 2016 – 2026 (USD Million)
        2. 4.4.4.2. North America Peanut Butter Market, by Distribution Channel, 2016 – 2026 (Kilo Tons)
      5. 4.4.5. U.S.
        1. 4.4.5.1. U.S. Peanut Butter Market, 2016 – 2026 (USD Million)
        2. 4.4.5.2. U.S. Peanut Butter Market, 2016 – 2026 (Kilo Tons)
      6. 4.4.6. Canada
        1. 4.4.6.1. Canada Peanut Butter Market, 2016 – 2026 (USD Million)
        2. 4.4.6.2. Canada Peanut Butter Market, 2016 – 2026 (Kilo Tons)
    5. 4.5. Europe
      1. 4.5.1. Europe Peanut Butter Market, 2016 – 2026 (USD Million)
        1. 4.5.1.1. Europe Peanut Butter Market, by Country, 2016 – 2026 (USD Million)
      2. 4.5.2. Europe Market, 2016 – 2026 (Kilo Tons)
        1. 4.5.2.1. Europe Peanut Butter Market, by Country, 2016 – 2026 (Kilo Tons)
      3. 4.5.3. Europe Peanut Butter Market, by Type, 2016 – 2026
        1. 4.5.3.1. Europe Peanut Butter Market, by Type, 2016 – 2026 (USD Million)
        2. 4.5.3.2. Europe Peanut Butter Market, by Type, 2016 – 2026 (Kilo Tons)
      4. 4.5.4. Europe Peanut Butter Market, by Distribution Channel, 2016 – 2026
        1. 4.5.4.1. Europe Peanut Butter Market, by Distribution Channel, 2016 – 2026 (USD Million)
        2. 4.5.4.2. Europe Peanut Butter Market, by Distribution Channel, 2016 – 2026 (Kilo Tons)
      5. 4.5.5. Germany
        1. 4.5.5.1. Germany Peanut Butter Market, 2016 – 2026 (USD Million)
        2. 4.5.5.2. Germany Peanut Butter Market, 2016 – 2026 (Kilo Tons)
      6. 4.5.6. France
        1. 4.5.6.1. France Peanut Butter Market, 2016 – 2026 (USD Million)
        2. 4.5.6.2. France Peanut Butter Market, 2016 – 2026 (Kilo Tons)
      7. 4.5.7. U.K.
        1. 4.5.7.1. U.K. Peanut Butter Market, 2016 – 2026 (USD Million)
        2. 4.5.7.2. U.K. Peanut Butter Market, 2016 – 2026 (Kilo Tons)
      8. 4.5.8. Italy
        1. 4.5.8.1. Italy Peanut Butter Market, 2016 – 2026 (USD Million)
        2. 4.5.8.2. Italy Peanut Butter Market, 2016 – 2026 (Kilo Tons)
      9. 4.5.9. Spain
        1. 4.5.9.1. Spain Peanut Butter Market, 2016 – 2026 (USD Million)
        2. 4.5.9.2. Spain Peanut Butter Market, 2016 – 2026 (Kilo Tons)
      10. 4.5.10. Rest of Europe
        1. 4.5.10.1. Rest of Europe Peanut Butter Market, 2016 – 2026 (USD Million)
        2. 4.5.10.2. Rest of Europe Peanut Butter Market, 2016 – 2026 (Kilo Tons)
    6. 4.6. Asia Pacific
      1. 4.6.1. Asia Pacific Peanut Butter Market, 2016 – 2026 (USD Million)
        1. 4.6.1.1. Asia Pacific Peanut Butter Market, by Country, 2016 – 2026 (USD Million)
      2. 4.6.2. Asia Pacific Market, 2016 – 2026 (Kilo Tons)
        1. 4.6.2.1. Asia Pacific Peanut Butter Market, by Country, 2016 – 2026 (Kilo Tons)
      3. 4.6.3. Asia Pacific Peanut Butter Market, by Type, 2016 – 2026
        1. 4.6.3.1. Asia Pacific Peanut Butter Market, by Type, 2016 – 2026 (USD Million)
        2. 4.6.3.2. Asia Pacific Peanut Butter Market, by Type, 2016 – 2026 (Kilo Tons)
      4. 4.6.4. Asia Pacific Peanut Butter Market, by Distribution Channel, 2016 – 2026
        1. 4.6.4.1. Asia Pacific Peanut Butter Market, by Distribution Channel, 2016 – 2026 (USD Million)
        2. 4.6.4.2. Asia Pacific Peanut Butter Market, by Distribution Channel, 2016 – 2026 (Kilo Tons)
      5. 4.6.5. China
        1. 4.6.5.1. China Peanut Butter Market, 2016 – 2026 (USD Million)
        2. 4.6.5.2. China Peanut Butter Market, 2016 – 2026 (Kilo Tons)
      6. 4.6.6. Japan
        1. 4.6.6.1. Japan Peanut Butter Market, 2016 – 2026 (USD Million)
        2. 4.6.6.2. Japan Peanut Butter Market, 2016 – 2026 (Kilo Tons)
      7. 4.6.7. India
        1. 4.6.7.1. India Peanut Butter Market, 2016 – 2026 (USD Million)
        2. 4.6.7.2. India Peanut Butter Market, 2016 – 2026 (Kilo Tons)
      8. 4.6.8. South Korea
        1. 4.6.8.1. South Korea Peanut Butter Market, 2016 – 2026 (USD Million)
        2. 4.6.8.2. South Korea Peanut Butter Market, 2016 – 2026 (Kilo Tons)
      9. 4.6.9. South-East Asia
        1. 4.6.9.1. South-East Asia Peanut Butter Market, 2016 – 2026 (USD Million)
        2. 4.6.9.2. South-East Asia Peanut Butter Market, 2016 – 2026 (Kilo Tons)
      10. 4.6.10. Rest of Asia Pacific
        1. 4.6.10.1. Rest of Asia Pacific Peanut Butter Market, 2016 – 2026 (USD Million)
        2. 4.6.10.2. Rest of Asia Pacific Peanut Butter Market, 2016 – 2026 (Kilo Tons)
    7. 4.7. Latin America
      1. 4.7.1. Latin America Peanut Butter Market, 2016 – 2026 (USD Million)
        1. 4.7.1.1. Latin America Peanut Butter Market, by Country, 2016 – 2026 (USD Million)
      2. 4.7.2. Latin America Market, 2016 – 2026 (Kilo Tons)
        1. 4.7.2.1. Latin America Peanut Butter Market, by Country, 2016 – 2026 (Kilo Tons)
      3. 4.7.3. Latin America Peanut Butter Market, by Type, 2016 – 2026
        1. 4.7.3.1. Latin America Peanut Butter Market, by Type, 2016 – 2026 (USD Million)
        2. 4.7.3.2. Latin America Peanut Butter Market, by Type, 2016 – 2026 (Kilo Tons)
      4. 4.7.4. Latin America Peanut Butter Market, by Distribution Channel, 2016 – 2026
        1. 4.7.4.1. Latin America Peanut Butter Market, by Distribution Channel, 2016 – 2026 (USD Million)
        2. 4.7.4.2. Latin America Peanut Butter Market, by Distribution Channel, 2016 – 2026 (Kilo Tons)
      5. 4.7.5. Brazil
        1. 4.7.5.1. Brazil Peanut Butter Market, 2016 – 2026 (USD Million)
        2. 4.7.5.2. Brazil Peanut Butter Market, 2016 – 2026 (Kilo Tons)
      6. 4.7.6. Mexico
        1. 4.7.6.1. Mexico Peanut Butter Market, 2016 – 2026 (USD Million)
        2. 4.7.6.2. Mexico Peanut Butter Market, 2016 – 2026 (Kilo Tons)
      7. 4.7.7. Rest of Latin America
        1. 4.7.7.1. Rest of Latin America Peanut Butter Market, 2016 – 2026 (USD Million)
        2. 4.7.7.2. Rest of Latin America Peanut Butter Market, 2016 – 2026 (Kilo Tons)
    8. 4.8. The Middle-East and Africa
      1. 4.8.1. The Middle-East and Africa Peanut Butter Market, 2016 – 2026 (USD Million)
        1. 4.8.1.1. The Middle-East and Africa Peanut Butter Market, by Country, 2016 – 2026 (USD Million)
      2. 4.8.2. The Middle-East and Africa Market, 2016 – 2026 (Kilo Tons)
        1. 4.8.2.1. The Middle-East and Africa Peanut Butter Market, by Country, 2016 – 2026 (Kilo Tons)
      3. 4.8.3. The Middle-East and Africa Peanut Butter Market, by Type, 2016 – 2026
        1. 4.8.3.1. The Middle-East and Africa Peanut Butter Market, by Type, 2016 – 2026 (USD Million)
        2. 4.8.3.2. The Middle-East and Africa Peanut Butter Market, by Type, 2016 – 2026 (Kilo Tons)
      4. 4.8.4. The Middle-East and Africa Peanut Butter Market, by Distribution Channel, 2016 – 2026
        1. 4.8.4.1. The Middle-East and Africa Peanut Butter Market, by Distribution Channel, 2016 – 2026 (USD Million)
        2. 4.8.4.2. The Middle-East and Africa Peanut Butter Market, by Distribution Channel, 2016 – 2026 (Kilo Tons)
      5. 4.8.5. GCC Countries
        1. 4.8.5.1. GCC Countries Peanut Butter Market, 2016 – 2026 (USD Million)
        2. 4.8.5.2. GCC Countries Peanut Butter Market, 2016 – 2026 (Kilo Tons)
      6. 4.8.6. South Africa
        1. 4.8.6.1. South Africa Peanut Butter Market, 2016 – 2026 (USD Million)
        2. 4.8.6.2. South Africa Peanut Butter Market, 2016 – 2026 (Kilo Tons)
      7. 4.8.7. Rest of Middle-East Africa
        1. 4.8.7.1. Rest of Middle-East Africa Peanut Butter Market, 2016 – 2026 (USD Million)
        2. 4.8.7.2. Rest of Middle-East Africa Peanut Butter Market, 2016 – 2026 (Kilo Tons)
  5. Chapter 5 Peanut Butter Production, Consumption, Export, Import by Regions
    1. 5.1. Global Peanut Butter Production and Consumption, 2016 – 2026 (Kilo Tons)
    2. 5.2. Global Import and Export Analysis, by Region
  6. Chapter 6 Peanut Butter Market – Competitive Landscape
    1. 6.1. Competitor Market Share – Revenue
    2. 6.2. Market Concentration Rate Analysis, Top 3 and Top 5 Players
    3. 6.3. Competitor Market Share – Volume
    4. 6.4. Strategic Developments
      1. 6.4.1. Acquisitions and Mergers
      2. 6.4.2. New Products
      3. 6.4.3. Research & Development Activities
  7. Chapter 7 Company Profiles
    1. 7.1. Procter & Gamble
      1. 7.1.1. Company Overview
      2. 7.1.2. Product/Service Portfolio
      3. 7.1.3. Procter & Gamble Sales, Revenue, Price, and Gross Margin
      4. 7.1.4. Procter & Gamble Revenue and Growth Rate
      5. 7.1.5. Procter & Gamble Market Share
      6. 7.1.6. Recent Initiatives, Funding/VC Activities, and Technological Innovations
    2. 7.2. Unilever
      1. 7.2.1. Company Overview
      2. 7.2.2. Product/Service Portfolio
      3. 7.2.3. Unilever Sales, Revenue, Price, and Gross Margin
      4. 7.2.4. Unilever Revenue and Growth Rate
      5. 7.2.5. Unilever Market Share
      6. 7.2.6. Recent Initiatives, Funding/VC Activities, and Technological Innovations
    3. 7.3. The J.M. Smucker Company
      1. 7.3.1. Company Overview
      2. 7.3.2. Product/Service Portfolio
      3. 7.3.3. The J.M. Smucker Company Sales, Revenue, Price, and Gross Margin
      4. 7.3.4. The J.M. Smucker Company Revenue and Growth Rate
      5. 7.3.5. The J.M. Smucker Company Market Share
      6. 7.3.6. Recent Initiatives, Funding/VC Activities, and Technological Innovations
    4. 7.4. Hormel Foods Corporation
      1. 7.4.1. Company Overview
      2. 7.4.2. Product/Service Portfolio
      3. 7.4.3. Hormel Foods Corporation Sales, Revenue, Price, and Gross Margin
      4. 7.4.4. Hormel Foods Corporation Revenue and Growth Rate
      5. 7.4.5. Hormel Foods Corporation Market Share
      6. 7.4.6. Recent Initiatives, Funding/VC Activities, and Technological Innovations
    5. 7.5. Boulder Brands Inc.
      1. 7.5.1. Company Overview
      2. 7.5.2. Product/Service Portfolio
      3. 7.5.3. Boulder Brands Inc. Sales, Revenue, Price, and Gross Margin
      4. 7.5.4. Boulder Brands Inc. Revenue and Growth Rate
      5. 7.5.5. Boulder Brands Inc. Market Share
      6. 7.5.6. Recent Initiatives, Funding/VC Activities, and Technological Innovations
    6. 7.6. Kraft Canada Inc.
      1. 7.6.1. Company Overview
      2. 7.6.2. Product/Service Portfolio
      3. 7.6.3. Kraft Canada Inc. Sales, Revenue, Price, and Gross Margin
      4. 7.6.4. Kraft Canada Inc. Revenue and Growth Rate
      5. 7.6.5. Kraft Canada Inc. Market Share
      6. 7.6.6. Recent Initiatives, Funding/VC Activities, and Technological Innovations
    7. 7.7. Algood Food Company Inc.
      1. 7.7.1. Company Overview
      2. 7.7.2. Product/Service Portfolio
      3. 7.7.3. Algood Food Company Inc. Sales, Revenue, Price, and Gross Margin
      4. 7.7.4. Algood Food Company Inc. Revenue and Growth Rate
      5. 7.7.5. Algood Food Company Inc. Market Share
      6. 7.7.6. Recent Initiatives, Funding/VC Activities, and Technological Innovations
    8. 7.8. The Hershey Company
      1. 7.8.1. Company Overview
      2. 7.8.2. Product/Service Portfolio
      3. 7.8.3. The Hershey Company Sales, Revenue, Price, and Gross Margin
      4. 7.8.4. The Hershey Company Revenue and Growth Rate
      5. 7.8.5. The Hershey Company Market Share
      6. 7.8.6. Recent Initiatives, Funding/VC Activities, and Technological Innovations
    9. 7.9. ConAgra Foods Inc.
      1. 7.9.1. Company Overview
      2. 7.9.2. Product/Service Portfolio
      3. 7.9.3. ConAgra Foods Inc. Sales, Revenue, Price, and Gross Margin
      4. 7.9.4. ConAgra Foods Inc. Revenue and Growth Rate
      5. 7.9.5. ConAgra Foods Inc. Market Share
      6. 7.9.6. Recent Initiatives, Funding/VC Activities, and Technological Innovations
    10. 7.10. Dr. Oetker India Pvt Ltd
      1. 7.10.1. Company Overview
      2. 7.10.2. Product/Service Portfolio
      3. 7.10.3. Dr. Oetker India Pvt Ltd Sales, Revenue, Price, and Gross Margin
      4. 7.10.4. Dr. Oetker India Pvt Ltd Revenue and Growth Rate
      5. 7.10.5. Dr. Oetker India Pvt Ltd Market Share
      6. 7.10.6. Recent Initiatives, Funding/VC Activities, and Technological Innovations
  8. Chapter 8 Peanut Butter — Industry Analysis
    1. 8.1. Introduction and Taxonomy
    2. 8.2. Peanut Butter Market – Key Trends
      1. 8.2.1. Market Drivers
      2. 8.2.2. Market Restraints
      3. 8.2.3. Market Opportunities
    3. 8.3. Value Chain Analysis
    4. 8.4. Key Mandates and Regulations
    5. 8.5. Technology Roadmap and Timeline
    6. 8.6. Peanut Butter Market – Attractiveness Analysis
      1. 8.6.1. By Type
      2. 8.6.2. By Distribution Channel
      3. 8.6.3. By Region
  9. Chapter 9 Raw Material Analysis
    1. 9.1. Peanut Butter Key Raw Material Analysis
      1. 9.1.1. Key Raw Materials
      2. 9.1.2. Price Trend of Key Raw Materials
    2. 9.2. Key Suppliers of Raw Materials
    3. 9.3. Proportion of Manufacturing Cost Structure
      1. 9.3.1. Raw Materials Cost
      2. 9.3.2. Labor Cost
      3. 9.3.3. Manufacturing Expenses
      4. 9.3.4. Miscellaneous Expenses
    4. 9.4. Manufacturing Cost Analysis of Peanut Butter
  10. Chapter 10 Industrial Chain, Sourcing Strategy, and Downstream Buyers
    1. 10.1. Peanut Butter Industrial Chain Analysis
    2. 10.2. Upstream Raw Materials Sourcing
      1. 10.2.1. Risk Mitigation:
      2. 10.2.2. Supplier Relationships:
      3. 10.2.3. Business Processes:
      4. 10.2.4. Securing the Product:
    3. 10.3. Raw Materials Sources of Peanut Butter Major Manufacturers
    4. 10.4. Downstream Buyers
    5. 10.5. Distributors/Traders List
  11. Chapter 11 Marketing Strategy Analysis, Distributors
    1. 11.1. Marketing Channel
    2. 11.2. Direct Marketing
    3. 11.3. Indirect Marketing
    4. 11.4. Marketing Channel Development Trends
    5. 11.5. Economic/Political Environmental Change
  12. Chapter 12 Report Conclusion & Key Insights
    1. 12.1. Key Insights from Primary Interviews & Surveys Respondents
    2. 12.2. Key Takeaways from Analysts, Consultants, and Industry Leaders
  13. Chapter 13 Research Approach & Methodology
    1. 13.1. Report Description
    2. 13.2. Research Scope
    3. 13.3. Research Methodology
      1. 13.3.1. Secondary Research
      2. 13.3.2. Primary Research
      3. 13.3.3. Statistical Models
        1. 13.3.3.1. Company Share Analysis Model
        2. 13.3.3.2. Revenue Based Modeling
      4. 13.3.4. Research Limitations

      List of Figures

      Fig.1 Product Picture of Peanut Butter
      Fig.2 Global Peanut Butter Market, 2016 – 2026 (USD Million)
      Fig.3 Global Peanut Butter Market, 2016 – 2026 (Kilo Tons)
      Fig.4 Global Peanut Butter Market Absolute Revenue Opportunity, 2016 – 2026 (USD Million)
      Fig.5 Global Peanut Butter Market Incremental Revenue Opportunity, 2020 – 2026 (USD Million)
      Fig.6 Global Peanut Butter Market Share, by Type, 2019 & 2026 (USD Million)
      Fig.7 Global Peanut Butter Market Share, by Type, 2019 & 2026 (Kilo Tons)
      Fig.8 Global Smooth Peanut Butter Peanut Butter Market, 2016 – 2026 (USD Million)
      Fig.9 Global Smooth Peanut Butter Peanut Butter Market, 2016 – 2026 (Kilo Tons)
      Fig.10 Global Crunchy Peanut Butter Peanut Butter Market, 2016 – 2026 (USD Million)
      Fig.11 Global Crunchy Peanut Butter Peanut Butter Market, 2016 – 2026 (Kilo Tons)
      Fig.12 Global Others Peanut Butter Market, 2016 – 2026 (USD Million)
      Fig.13 Global Others Peanut Butter Market, 2016 – 2026 (Kilo Tons)
      Fig.14 Global Peanut Butter Market Share, by Distribution Channel, 2019 & 2026 (USD Million)
      Fig.15 Global Peanut Butter Market Share, by Distribution Channel, 2019 & 2026 (Kilo Tons)
      Fig.16 Global Supermarkets and Hypermarkets Peanut Butter Market, 2016 – 2026 (USD Million)
      Fig.17 Global Supermarkets and Hypermarkets Peanut Butter Market, 2016 – 2026 (Kilo Tons)
      Fig.18 Global Convenience Stores Peanut Butter Market, 2016 – 2026 (USD Million)
      Fig.19 Global Convenience Stores Peanut Butter Market, 2016 – 2026 (Kilo Tons)
      Fig.20 Global Online Stores Peanut Butter Market, 2016 – 2026 (USD Million)
      Fig.21 Global Online Stores Peanut Butter Market, 2016 – 2026 (Kilo Tons)
      Fig.22 Global Others Peanut Butter Market, 2016 – 2026 (USD Million)
      Fig.23 Global Others Peanut Butter Market, 2016 – 2026 (Kilo Tons)
      Fig.24 Global Peanut Butter Market Share, by Region, 2019 & 2026 (USD Million)
      Fig.25 Global Peanut Butter Market Share, by Region, 2019 & 2026 (Kilo Tons)
      Fig.26 North America Peanut Butter Market, 2016 – 2026 (USD Million)
      Fig.27 North America Peanut Butter Market, 2016 – 2026 (Kilo Tons)
      Fig.28 U.S. Peanut Butter Market, 2016 – 2026 (USD Million)
      Fig.29 U.S. Peanut Butter  Market, 2016 – 2026 (Kilo Tons)
      Fig.30 Canada Peanut Butter Market, 2016 – 2026 (USD Million)
      Fig.31 Canada Peanut Butter  Market, 2016 – 2026 (Kilo Tons)
      Fig.32 Europe Peanut Butter Market, 2016 – 2026 (USD Million)
      Fig.33 Europe Peanut Butter Market, 2016 – 2026 (Kilo Tons)
      Fig.34 Germany Peanut Butter Market, 2016 – 2026 (USD Million)
      Fig.35 Germany Peanut Butter  Market, 2016 – 2026 (Kilo Tons)
      Fig.36 France Peanut Butter Market, 2016 – 2026 (USD Million)
      Fig.37 France Peanut Butter  Market, 2016 – 2026 (Kilo Tons)
      Fig.38 U.K. Peanut Butter Market, 2016 – 2026 (USD Million)
      Fig.39 U.K. Peanut Butter  Market, 2016 – 2026 (Kilo Tons)
      Fig.40 Italy Peanut Butter Market, 2016 – 2026 (USD Million)
      Fig.41 Italy Peanut Butter  Market, 2016 – 2026 (Kilo Tons)
      Fig.42 Spain Peanut Butter Market, 2016 – 2026 (USD Million)
      Fig.43 Spain Peanut Butter  Market, 2016 – 2026 (Kilo Tons)
      Fig.44 Rest of Europe Peanut Butter Market, 2016 – 2026 (USD Million)
      Fig.45 Rest of Europe Peanut Butter  Market, 2016 – 2026 (Kilo Tons)
      Fig.46 Asia Pacific Peanut Butter Market, 2016 – 2026 (USD Million)
      Fig.47 Asia Pacific Peanut Butter Market, 2016 – 2026 (Kilo Tons)
      Fig.48 China Peanut Butter Market, 2016 – 2026 (USD Million)
      Fig.49 China Peanut Butter  Market, 2016 – 2026 (Kilo Tons)
      Fig.50 Japan Peanut Butter Market, 2016 – 2026 (USD Million)
      Fig.51 Japan Peanut Butter  Market, 2016 – 2026 (Kilo Tons)
      Fig.52 India Peanut Butter Market, 2016 – 2026 (USD Million)
      Fig.53 India Peanut Butter  Market, 2016 – 2026 (Kilo Tons)
      Fig.54 South  Korea Peanut Butter Market, 2016 – 2026 (USD Million)
      Fig.55 South  Korea Peanut Butter  Market, 2016 – 2026 (Kilo Tons)
      Fig.56 South-East Asia Peanut Butter Market, 2016 – 2026 (USD Million)
      Fig.57 South-East Asia Peanut Butter  Market, 2016 – 2026 (Kilo Tons)
      Fig.58 Rest of Asia Pacific Peanut Butter Market, 2016 – 2026 (USD Million)
      Fig.59 Rest of Asia Pacific Peanut Butter  Market, 2016 – 2026 (Kilo Tons)
      Fig.60 Latin America Peanut Butter Market, 2016 – 2026 (USD Million)
      Fig.61 Latin America Peanut Butter Market, 2016 – 2026 (Kilo Tons)
      Fig.62 Brazil Peanut Butter Market, 2016 – 2026 (USD Million)
      Fig.63 Brazil Peanut Butter  Market, 2016 – 2026 (Kilo Tons)
      Fig.64 Mexico Peanut Butter Market, 2016 – 2026 (USD Million)
      Fig.65 Mexico Peanut Butter  Market, 2016 – 2026 (Kilo Tons)
      Fig.66 Rest of Latin America Peanut Butter Market, 2016 – 2026 (USD Million)
      Fig.67 Rest of Latin America Peanut Butter  Market, 2016 – 2026 (Kilo Tons)
      Fig.68 The Middle-East and Africa Peanut Butter Market, 2016 – 2026 (USD Million)
      Fig.69 The Middle-East and Africa Peanut Butter Market, 2016 – 2026 (Kilo Tons)
      Fig.70 GCC Countries Peanut Butter Market, 2016 – 2026 (USD Million)
      Fig.71 GCC Countries Peanut Butter  Market, 2016 – 2026 (Kilo Tons)
      Fig.72 South Africa Peanut Butter Market, 2016 – 2026 (USD Million)
      Fig.73 South Africa Peanut Butter  Market, 2016 – 2026 (Kilo Tons)
      Fig.74 Rest of Middle-East Africa Peanut Butter Market, 2016 – 2026 (USD Million)
      Fig.75 Rest of Middle-East Africa Peanut Butter  Market, 2016 – 2026 (Kilo Tons)
      Fig.76 Global Peanut Butter Production and Consumption, 2016 – 2026 (Kilo Tons)
      Fig.77 North America Peanut Butter Production and Consumption, 2016 – 2026 (USD Million) (Kilo Tons)
      Fig.78 Europe Peanut Butter Production and Consumption, 2016 – 2026 (USD Million) (Kilo Tons)
      Fig.79 Asia Pacific Peanut Butter Production and Consumption, 2016 – 2026 (USD Million) (Kilo Tons)
      Fig.80 Latin America Peanut Butter Production and Consumption, 2016 – 2026 (USD Million) (Kilo Tons)
      Fig.81 The Middle-East and Africa Peanut Butter Production and Consumption, 2016 – 2026 (USD Million) (Kilo Tons)
      Fig.82 Competitor Market Share – Revenue
      Fig.83 Competitor Market Share – Volume
      Fig.84 Procter & Gamble Revenue and Growth Rate
      Fig.85 Procter & Gamble Market Share
      Fig.86 Unilever Revenue and Growth Rate
      Fig.87 Unilever Market Share
      Fig.88 The J.M. Smucker Company Revenue and Growth Rate
      Fig.89 The J.M. Smucker Company Market Share
      Fig.90 Hormel Foods Corporation Revenue and Growth Rate
      Fig.91 Hormel Foods Corporation Market Share
      Fig.92 Boulder Brands Inc. Revenue and Growth Rate
      Fig.93 Boulder Brands Inc. Market Share
      Fig.94 Kraft Canada Inc. Revenue and Growth Rate
      Fig.95 Kraft Canada Inc. Market Share
      Fig.96 Algood Food Company Inc. Revenue and Growth Rate
      Fig.97 Algood Food Company Inc. Market Share
      Fig.98 The Hershey Company Revenue and Growth Rate
      Fig.99 The Hershey Company Market Share
      Fig.100 ConAgra Foods Inc. Revenue and Growth Rate
      Fig.101 ConAgra Foods Inc. Market Share
      Fig.102 Dr. Oetker India Pvt Ltd Revenue and Growth Rate
      Fig.103 Dr. Oetker India Pvt Ltd Market Share
      Fig.104 Market Dynamics
      Fig.105 Global Peanut Butter – Value Chain Analysis
      Fig.106 Key Mandates and Regulations
      Fig.107 Technology Roadmap and Timeline
      Fig.108 Market Attractiveness Analysis – By Type
      Fig.109 Market Attractiveness Analysis – By Distribution Channel
      Fig.110 Market Attractiveness Analysis – By Region
      Fig.111 Manufacturing Cost Structure of Peanut Butter
      Fig.112 Peanut Butter Industrial Chain Analysis
      Fig.113 Market Channels
      Fig.114 Marketing Channel Development Trend
      Fig.115 Growth in World Gross Product, 2008-2018

      List of Tables

      Table 1 Global Peanut Butter Market, 2019 & 2026 (USD Million)
      Table 2 Global Peanut Butter Market, by Type, 2016 – 2026 (USD Million)
      Table 3 Global Peanut Butter Market, by Type, 2016 – 2026 (Kilo Tons)
      Table 4 Global Peanut Butter Market, by Distribution Channel, 2016 – 2026 (USD Million)
      Table 5 Global Peanut Butter Market, by Distribution Channel, 2016 – 2026 (Kilo Tons)
      Table 6 Global Peanut Butter Market, by Region, 2016 – 2026 (USD Million)
      Table 7 Global Peanut Butter Market, by Region, 2016 – 2026 (Kilo Tons)
      Table 8 North America Peanut Butter Market, by Country, 2016 – 2026 (USD Million)
      Table 9 North America Peanut Butter Market, by Country, 2016 – 2026 (Kilo Tons)
      Table 10 North America Peanut Butter Market, by Type, 2016 – 2026 (USD Million)
      Table 11 North America Peanut Butter Market, by Type, 2016 – 2026 (Kilo Tons)
      Table 12 North America Peanut Butter Market, by Distribution Channel, 2016 – 2026 (USD Million)
      Table 13 North America Peanut Butter Market, by Distribution Channel, 2016 – 2026 (Kilo Tons)
      Table 14 Europe Peanut Butter Market, by Country, 2016 – 2026 (USD Million)
      Table 15 Europe Peanut Butter Market, by Country, 2016 – 2026 (Kilo Tons)
      Table 16 Europe Peanut Butter Market, by Type, 2016 – 2026 (USD Million)
      Table 17 Europe Peanut Butter Market, by Type, 2016 – 2026 (Kilo Tons)
      Table 18 Europe Peanut Butter Market, by Distribution Channel, 2016 – 2026 (USD Million)
      Table 19 Europe Peanut Butter Market, by Distribution Channel, 2016 – 2026 (Kilo Tons)
      Table 20 Asia Pacific Peanut Butter Market, by Country, 2016 – 2026 (USD Million)
      Table 21 Asia Pacific Peanut Butter Market, by Country, 2016 – 2026 (Kilo Tons)
      Table 22 Asia Pacific Peanut Butter Market, by Type, 2016 – 2026 (USD Million)
      Table 23 Asia Pacific Peanut Butter Market, by Type, 2016 – 2026 (Kilo Tons)
      Table 24 Asia Pacific Peanut Butter Market, by Distribution Channel, 2016 – 2026 (USD Million)
      Table 25 Asia Pacific Peanut Butter Market, by Distribution Channel, 2016 – 2026 (Kilo Tons)
      Table 26 Latin America Peanut Butter Market, by Country, 2016 – 2026 (USD Million)
      Table 27 Latin America Peanut Butter Market, by Country, 2016 – 2026 (Kilo Tons)
      Table 28 Latin America Peanut Butter Market, by Type, 2016 – 2026 (USD Million)
      Table 29 Latin America Peanut Butter Market, by Type, 2016 – 2026 (Kilo Tons)
      Table 30 Latin America Peanut Butter Market, by Distribution Channel, 2016 – 2026 (USD Million)
      Table 31 Latin America Peanut Butter Market, by Distribution Channel, 2016 – 2026 (Kilo Tons)
      Table 32 The Middle-East and Africa Peanut Butter Market, by Country, 2016 – 2026 (USD Million)
      Table 33 The Middle-East and Africa Peanut Butter Market, by Country, 2016 – 2026 (Kilo Tons)
      Table 34 The Middle-East and Africa Peanut Butter Market, by Type, 2016 – 2026 (USD Million)
      Table 35 The Middle-East and Africa Peanut Butter Market, by Type, 2016 – 2026 (Kilo Tons)
      Table 36 The Middle-East and Africa Peanut Butter Market, by Distribution Channel, 2016 – 2026 (USD Million)
      Table 37 The Middle-East and Africa Peanut Butter Market, by Distribution Channel, 2016 – 2026 (Kilo Tons)
      Table 38 North America Peanut Butter Production, Consumption, Export, Import, 2016 – 2019
      Table 39 Europe Peanut Butter Production, Consumption, Export, Import, 2016 – 2019
      Table 40 Asia Pacific Peanut Butter Production, Consumption, Export, Import, 2016 – 2019
      Table 41 Latin America Peanut Butter Production, Consumption, Export, Import, 2016 – 2019
      Table 42 The Middle-East and Africa Peanut Butter Production, Consumption, Export, Import, 2016 – 2019
      Table 43 Global Peanut Butter Market - Company Revenue Analysis, 2016 – 2019 (USD Million)
      Table 44 Global Peanut Butter Market - Company Revenue Share Analysis, 2016 – 2019 (%)
      Table 45 Global Peanut Butter Market - Company Volume Analysis, 2016 – 2019 (Kilo Tons)
      Table 46 Global Peanut Butter Market - Company Volume Share Analysis, 2016 – 2019 (%)
      Table 47 Acquisitions and Mergers
      Table 48 Market Drivers – Impact Analysis
      Table 49 Market Restraints
      Table 50 Market Opportunities
      Table 51 Production Base and Market Concentration Rate of Raw Material
      Table 52 Key Suppliers of Raw Materials
      Table 53 Raw Materials Sources of Peanut Butter Major Manufacturers
      Table 54 Major Buyers of Peanut Butter
      Table 55 Distributors/Traders of Peanut Butter by Region

Industry Major Market Players

  •  Hormel Foods Corporation
  •  Kraft Canada Inc.
  •  The Hershey Company
  •  Unilever
  •  ConAgra Foods Inc.
  •  Algood Food Company Inc.
  •  Dr. Oetker India Pvt Ltd
  •  Procter & Gamble
  •  Boulder Brands Inc.
  •  The J.M. Smucker Company