Search Market Research Report

Discover Our Latest Reports
Discover Our Featured Reports
Discover Top Selling Reports

Payment HSMs Market Size, Share Global Analysis Report, 2020–2026

report img

Payment HSMs Market By Type (PCI Based, USB Based, Network Based, and Java Based) and By Application (Industrial and Manufacturing, Banking, Financial Services and Insurance (BFSI), and Government): Global Industry Outlook, Market Size, Business Intelligence, Consumer Preferences, Statistical Surveys, Comprehensive Analysis, Historical Developments, Current Trends, and Forecast 2020–2026

Industry Insights

The Payment HSMs market report analyzes and notifies the industry statistics at the global as well as regional and country levels in order to acquire a thorough perspective of the entire Payment HSMs market. The historical and past insights are provided for FY 2016 to FY 2019 whereas projected trends are delivered for FY 2020 to FY 2026. The quantitative and numerical data is represented in terms of both volume (K Units) and value (USD Million) from FY 2016 – 2026.

This specialized and expertise-oriented industry research report scrutinizes the technical and commercial business outlook of the Payment HSMs industry. The report analyzes and declares the historical and current trends analysis of the Payment HSMs industry and subsequently recommends the projected trends anticipated to be observed in the Payment HSMs market during the upcoming years.

Payment HSMs Market Size

To know more about this report | Request Free Sample Copy


logoKey Insights from Primary Research

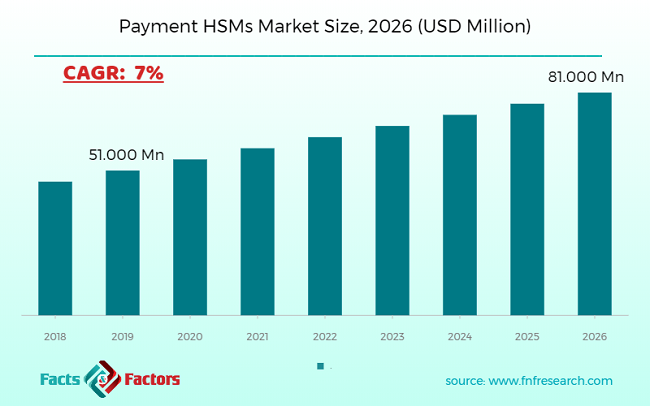
  • As per our major respondents, the payment HSMs market is set to grow annually at a rate of around 7%
  • It was established through primary research that the payment HSMs market was valued at around USD 340.00 Million in 2019
  • In terms of volume, the payment HSMs market stood at around 51,000.00 K Units, in 2019
  • Based on product type segmentation, the “Network-Based” category accounted for around 29% share, in 2019
  • Based on application segmentation, the “Banking” category held the leading share at more than 30%, in 2019

logoKey Recommendations from Analysts

  • As per our analysts, the North American market is estimated to grow at a CAGR of 7% during 2019-2026
  • As per our analysts, the common payment types of payment HSMs include Payment processors, financial giants, banks, and credit cards.
  • The payment HSMs product market used in Java-Based, PCI Based, Network-Based, and USB Based.
  • The North American market accounted for a major revenue share of USD 104% Million in 2019 and continues to lead the payment HSMs market.
  • The hardware safety element contains more protected cryptoprocessor chips.

The quantitative data is further underlined and reinforced by comprehensive qualitative data which comprises various across-the-board market dynamics. The rationales which directly or indirectly impact the Payment HSMs industry are exemplified through parameters such as growth drivers, restraints, challenges, and opportunities among other impacting factors.

Throughout our research report, we have encompassed all the proven models and tools of industry analysis and extensively illustrated all the key business strategies and business models adopted in the Payment HSMs industry. The report provides an all-inclusive and detailed competitive landscape prevalent in the Payment HSMs market.

The report utilizes established industry analysis tools and models such as Porter’s Five Forces framework to analyze and recognize critical business strategies adopted by various stakeholders involved in the entire value chain of the Payment HSMs industry. The Payment HSMs market report additionally employs SWOT analysis and PESTLE analysis models for further in-depth analysis.

The report study further includes an in-depth analysis of industry players' market shares and provides an overview of leading players' market position in the Payment HSMs sector. Key strategic developments in the Payment HSMs market competitive landscape such as acquisitions & mergers, inaugurations of different products and services, partnerships & joint ventures, MoU agreements, VC & funding activities, R&D activities, and geographic expansion among other noteworthy activities by key players of the Payment HSMs market are appropriately highlighted in the report.

Payment HSMs are used through the worldwide payment ecosystem by payment networks, issuers, processors, service providers, and acquirers. They show a necessary part in sensitive data protection, securing payment, card authentication, credential issuing, and user authentication, for both digital and remote payments. The cryptographic basics of altogether main payments used for a contactless chip, contact chip, mobile secure elements, and host card competition requests are maintained to report the developing security values after organizations with PCI SSC, EMVCo, and Global Stage as part of security requirements.

Some of their mutual usage in the payments ecosystem contains PIN generation, organization, and validation; Payment credentials used for mobile applications and payment cards, Point-to-point encryption (P2PE) key organization and secure data decryption, PIN block translation through the network transferring of POS transactions and ATM.

The Payment HSMs market research report delivers an acute valuation and taxonomy of the Payment HSMs industry by practically splitting the market based on different types, applications, and regions. Through the analysis of the historical and projected trends, all the segments and sub-segments were evaluated through the bottom-up approach, and different market sizes have been projected for FY 2020 to FY 2026. The regional segmentation of the Payment HSMs industry includes the complete classification of all the major continents including North America, Latin America, Europe, Asia Pacific, and the Middle East & Africa. Further, country-wise data for the Payment HSMs industry is provided for the leading economies of the world.

The Payment HSMs market is segmented based on Type and Application. Based on type segmentation, the market is classified into PCI-based, USB-based, network-based, and java based. In terms of application segmentation, the market is bifurcated into industrial and manufacturing, banking, financial services and insurance (BFSI), and government.

logoReport Scope

Report Attribute

Details

Market Size in 2019

USD 51.000 Million

Projected Market Size in 2026

USD 81.000 Million

CAGR Growth Rate

7% CAGR

Base Year

2019

Forecast Years

2020-2026

Key Market Players

Westone, Gemalto, Thales, Ultra Electronics, Utimaco, SWIFT, Atos SE, Yubico, Micro Focus, Futurex, JN UNION, JN TASS, SPYRUS Inc., Beijing SansecTechnologyand others.

Key Segment

By Type, By Application, By Region

Major Regions Covered

North America, Europe, Asia Pacific, Latin America, and the Middle East & Africa

Purchase Options

Request customized purchase options to meet your research needs. Explore purchase options

logoSome of the essential players operating in the Payment HSMs market, but not restricted to include: 

  •  Westone
  •  Gemalto
  •  Thales
  •  Ultra Electronics
  •  Utimaco
  •  SWIFT
  •  Atos SE
  •  Yubico
  •  Micro Focus
  •  Futurex
  •  JN UNION
  •  JN TASS
  •  SPYRUS Inc.
  •  Beijing Sansec Technology

The taxonomy of the Payment HSMs industry by its scope and segmentation is as follows:

logo By Type Segmentation Analysis

  • PCI Based
  • USB Based
  • Network-Based
  • Java Based

logo By Application Segmentation Analysis

  • Industrial and Manufacturing
  • Banking
  • Financial Services and Insurance (BFSI)
  • Government

logo Regional Segmentation Analysis (Customizable)

  • North America
    • The U.S.
    • Canada
  • Europe
    • Germany
    • The UK
    • France
    • Spain
    • Italy
    • Rest of Europe
  • Asia Pacific
    • China
    • Japan
    • India
    • South Korea
    • Southeast Asia
    • Rest of Asia Pacific
  • Latin America
    • Brazil
    • Mexico
    • Rest of Latin America
  • Middle East & Africa
    • GCC
    • South Africa
    • Rest of Middle East & Africa

Table of Content

  1. CHAPTER 1. Executive Summary
  2. CHAPTER 2. Payment HSMs market – Type Analysis
    1. 2.1. Global Payment HSMs Market – Type Overview
    2. 2.2. Global Payment HSMs Market Share, by Type, 2019 & 2026 (USD Million)
    3. 2.3. Global Payment HSMs Market share, by Type, 2019 & 2026 (K Units)
    4. 2.4. PCI Based
      1. 2.4.1. Global PCI Based Payment HSMs Market, 2016-2026 (USD Million)
      2. 2.4.2. Global PCI Based Payment HSMs Market, 2016-2026 (K Units)
    5. 2.5. USB Based
      1. 2.5.1. Global USB Based Payment HSMs Market, 2016-2026 (USD Million)
      2. 2.5.2. Global USB Based Payment HSMs Market, 2016-2026 (K Units)
    6. 2.6. Network Based
      1. 2.6.1. Global Network Based Payment HSMs Market, 2016-2026 (USD Million)
      2. 2.6.2. Global Network Based Payment HSMs Market, 2016-2026 (K Units)
    7. 2.7. Java Based
      1. 2.7.1. Global Java Based Payment HSMs Market, 2016-2026 (USD Million)
      2. 2.7.2. Global Java Based Payment HSMs Market, 2016-2026 (K Units)
  3. CHAPTER 3. Payment HSMs market – Application Analysis
    1. 3.1. Global Payment HSMs Market – Application Overview
    2. 3.2. Global Payment HSMs Market Share, by Application, 2019 & 2026 (USD Million)
    3. 3.3. Global Payment HSMs Market share, by Application, 2019 & 2026 (K Units)
    4. 3.4. Industrial and Manufacturing
      1. 3.4.1. Global Industrial and Manufacturing Payment HSMs Market, 2016-2026 (USD Million)
      2. 3.4.2. Global Industrial and Manufacturing Payment HSMs Market, 2016-2026 (K Units)
    5. 3.5. Banking
      1. 3.5.1. Global Banking Payment HSMs Market, 2016-2026 (USD Million)
      2. 3.5.2. Global Banking Payment HSMs Market, 2016-2026 (K Units)
    6. 3.6. Financial Services and Insurance (BFSI)
      1. 3.6.1. Global Financial Services and Insurance (BFSI) Payment HSMs Market, 2016-2026 (USD Million)
      2. 3.6.2. Global Financial Services and Insurance (BFSI) Payment HSMs Market, 2016-2026 (K Units)
    7. 3.7. Government)
      1. 3.7.1. Global Government) Payment HSMs Market, 2016-2026 (USD Million)
      2. 3.7.2. Global Government) Payment HSMs Market, 2016-2026 (K Units)
  4. CHAPTER 4. Payment HSMs market – Regional Analysis
    1. 4.1. Global Payment HSMs Market Regional Overview
    2. 4.2. Global Payment HSMs Market Share, by Region, 2019 & 2026 (Value)
    3. 4.3. Global Payment HSMs Market Share, by Region, 2019 & 2026 (Volume)
    4. 4.4. North America
      1. 4.4.1. North America Payment HSMs Market size and forecast, 2016-2026
      2. 4.4.2. North America Payment HSMs Market, by Country, 2018 - 2025 (USD Million)
      3. 4.4.3. North America Market size and forecast, 2016-2026 (K Units)
      4. 4.4.4. North America Payment HSMs Market, by Country, 2018 - 2025 (K Units)
      5. 4.4.5. North America Payment HSMs Market, by Type, 2016-2026
        1. 4.4.5.1. North America Payment HSMs Market, by Type, 2016-2026 (USD Million)
        2. 4.4.5.2. North America Payment HSMs Market, by Type, 2016-2026 (K Units)
      6. 4.4.6. North America Payment HSMs Market, by Application, 2016-2026
        1. 4.4.6.1. North America Payment HSMs Market, by Application, 2016-2026 (USD Million)
        2. 4.4.6.2. North America Payment HSMs Market, by Application, 2016-2026 (K Units)
      7. 4.4.7. U.S.
        1. 4.4.7.1. U.S. Market size and forecast, 2016-2026 (USD Million)
        2. 4.4.7.2. U.S. Market size and forecast, 2016-2026 (K Units)
      8. 4.4.8. Canada
        1. 4.4.8.1. Canada Market size and forecast, 2016-2026 (USD Million)
        2. 4.4.8.2. Canada Market size and forecast, 2016-2026 (K Units)
    5. 4.5. Europe
      1. 4.5.1. Europe Payment HSMs Market size and forecast, 2016-2026
      2. 4.5.2. Europe Payment HSMs Market, by Country, 2018 - 2025 (USD Million)
      3. 4.5.3. Europe Market size and forecast, 2016-2026 (K Units)
      4. 4.5.4. Europe Payment HSMs Market, by Country, 2018 - 2025 (K Units)
      5. 4.5.5. Europe Payment HSMs Market, by Type, 2016-2026
        1. 4.5.5.1. Europe Payment HSMs Market, by Type, 2016-2026 (USD Million)
        2. 4.5.5.2. Europe Payment HSMs Market, by Type, 2016-2026 (K Units)
      6. 4.5.6. Europe Payment HSMs Market, by Application, 2016-2026
        1. 4.5.6.1. Europe Payment HSMs Market, by Application, 2016-2026 (USD Million)
        2. 4.5.6.2. Europe Payment HSMs Market, by Application, 2016-2026 (K Units)
      7. 4.5.7. Germany
        1. 4.5.7.1. Germany Market size and forecast, 2016-2026 (USD Million)
        2. 4.5.7.2. Germany Market size and forecast, 2016-2026 (K Units)
      8. 4.5.8. France
        1. 4.5.8.1. France Market size and forecast, 2016-2026 (USD Million)
        2. 4.5.8.2. France Market size and forecast, 2016-2026 (K Units)
      9. 4.5.9. U.K.
        1. 4.5.9.1. U.K. Market size and forecast, 2016-2026 (USD Million)
        2. 4.5.9.2. U.K. Market size and forecast, 2016-2026 (K Units)
      10. 4.5.10. Italy
        1. 4.5.10.1. Italy Market size and forecast, 2016-2026 (USD Million)
        2. 4.5.10.2. Italy Market size and forecast, 2016-2026 (K Units)
      11. 4.5.11. Spain
        1. 4.5.11.1. Spain Market size and forecast, 2016-2026 (USD Million)
        2. 4.5.11.2. Spain Market size and forecast, 2016-2026 (K Units)
      12. 4.5.12. Rest of Europe
        1. 4.5.12.1. Rest of Europe Market size and forecast, 2016-2026 (USD Million)
        2. 4.5.12.2. Rest of Europe Market size and forecast, 2016-2026 (K Units)
    6. 4.6. Asia Pacific
      1. 4.6.1. Asia Pacific Payment HSMs Market size and forecast, 2016-2026
      2. 4.6.2. Asia Pacific Payment HSMs Market, by Country, 2018 - 2025 (USD Million)
      3. 4.6.3. Asia Pacific Market size and forecast, 2016-2026 (K Units)
      4. 4.6.4. Asia Pacific Payment HSMs Market, by Country, 2018 - 2025 (K Units)
      5. 4.6.5. Asia Pacific Payment HSMs Market, by Type, 2016-2026
        1. 4.6.5.1. Asia Pacific Payment HSMs Market, by Type, 2016-2026 (USD Million)
        2. 4.6.5.2. Asia Pacific Payment HSMs Market, by Type, 2016-2026 (K Units)
      6. 4.6.6. Asia Pacific Payment HSMs Market, by Application, 2016-2026
        1. 4.6.6.1. Asia Pacific Payment HSMs Market, by Application, 2016-2026 (USD Million)
        2. 4.6.6.2. Asia Pacific Payment HSMs Market, by Application, 2016-2026 (K Units)
      7. 4.6.7. China
        1. 4.6.7.1. China Market size and forecast, 2016-2026 (USD Million)
        2. 4.6.7.2. China Market size and forecast, 2016-2026 (K Units)
      8. 4.6.8. Japan
        1. 4.6.8.1. Japan Market size and forecast, 2016-2026 (USD Million)
        2. 4.6.8.2. Japan Market size and forecast, 2016-2026 (K Units)
      9. 4.6.9. India
        1. 4.6.9.1. India Market size and forecast, 2016-2026 (USD Million)
        2. 4.6.9.2. India Market size and forecast, 2016-2026 (K Units)
      10. 4.6.10. South Korea
        1. 4.6.10.1. South Korea Market size and forecast, 2016-2026 (USD Million)
        2. 4.6.10.2. South Korea Market size and forecast, 2016-2026 (K Units)
      11. 4.6.11. South-East Asia
        1. 4.6.11.1. South-East Asia Market size and forecast, 2016-2026 (USD Million)
        2. 4.6.11.2. South-East Asia Market size and forecast, 2016-2026 (K Units)
      12. 4.6.12. Rest of Asia Pacific
        1. 4.6.12.1. Rest of Asia Pacific Market size and forecast, 2016-2026 (USD Million)
        2. 4.6.12.2. Rest of Asia Pacific Market size and forecast, 2016-2026 (K Units)
    7. 4.7. Latin America
      1. 4.7.1. Latin America Payment HSMs Market size and forecast, 2016-2026
      2. 4.7.2. Latin America Payment HSMs Market, by Country, 2018 - 2025 (USD Million)
      3. 4.7.3. Latin America Market size and forecast, 2016-2026 (K Units)
      4. 4.7.4. Latin America Payment HSMs Market, by Country, 2018 - 2025 (K Units)
      5. 4.7.5. Latin America Payment HSMs Market, by Type, 2016-2026
        1. 4.7.5.1. Latin America Payment HSMs Market, by Type, 2016-2026 (USD Million)
        2. 4.7.5.2. Latin America Payment HSMs Market, by Type, 2016-2026 (K Units)
      6. 4.7.6. Latin America Payment HSMs Market, by Application, 2016-2026
        1. 4.7.6.1. Latin America Payment HSMs Market, by Application, 2016-2026 (USD Million)
        2. 4.7.6.2. Latin America Payment HSMs Market, by Application, 2016-2026 (K Units)
      7. 4.7.7. Brazil
        1. 4.7.7.1. Brazil Market size and forecast, 2016-2026 (USD Million)
        2. 4.7.7.2. Brazil Market size and forecast, 2016-2026 (K Units)
      8. 4.7.8. Mexico
        1. 4.7.8.1. Mexico Market size and forecast, 2016-2026 (USD Million)
        2. 4.7.8.2. Mexico Market size and forecast, 2016-2026 (K Units)
      9. 4.7.9. Rest of Latin America
        1. 4.7.9.1. Rest of Latin America Market size and forecast, 2016-2026 (USD Million)
        2. 4.7.9.2. Rest of Latin America Market size and forecast, 2016-2026 (K Units)
    8. 4.8. The Middle-East and Africa
      1. 4.8.1. The Middle-East and Africa Payment HSMs Market size and forecast, 2016-2026
      2. 4.8.2. The Middle-East and Africa Payment HSMs Market, by Country, 2018 - 2025 (USD Million)
      3. 4.8.3. The Middle-East and Africa Market size and forecast, 2016-2026 (K Units)
      4. 4.8.4. The Middle-East and Africa Payment HSMs Market, by Country, 2018 - 2025 (K Units)
      5. 4.8.5. The Middle-East and Africa Payment HSMs Market, by Type, 2016-2026
        1. 4.8.5.1. The Middle-East and Africa Payment HSMs Market, by Type, 2016-2026 (USD Million)
        2. 4.8.5.2. The Middle-East and Africa Payment HSMs Market, by Type, 2016-2026 (K Units)
      6. 4.8.6. The Middle-East and Africa Payment HSMs Market, by Application, 2016-2026
        1. 4.8.6.1. The Middle-East and Africa Payment HSMs Market, by Application, 2016-2026 (USD Million)
        2. 4.8.6.2. The Middle-East and Africa Payment HSMs Market, by Application, 2016-2026 (K Units)
      7. 4.8.7. GCC Countries
        1. 4.8.7.1. GCC Countries Market size and forecast, 2016-2026 (USD Million)
        2. 4.8.7.2. GCC Countries Market size and forecast, 2016-2026 (K Units)
      8. 4.8.8. South Africa
        1. 4.8.8.1. South Africa Market size and forecast, 2016-2026 (USD Million)
        2. 4.8.8.2. South Africa Market size and forecast, 2016-2026 (K Units)
      9. 4.8.9. Rest of Middle-East Africa
        1. 4.8.9.1. Rest of Middle-East Africa Market size and forecast, 2016-2026 (USD Million)
        2. 4.8.9.2. Rest of Middle-East Africa Market size and forecast, 2016-2026 (K Units)
  5. CHAPTER 5. Payment HSMs Production, Consumption, Export, Import by Regions
    1. 5.1. Global Payment HSMs production and revenue, 2015-2025 (USD Million) (K Units)
    2. 5.2. Global Import and Export Analysis, by Region
  6. CHAPTER 6. Payment HSMs market – Competitive Landscape
    1. 6.1. Competitor Market Share – Revenue
    2. 6.2. Market Concentration Rate Analysis, Top 3 and Top 5 Players
    3. 6.3. Competitor Market Share – Volume
    4. 6.4. Strategic Development
      1. 6.4.1. Acquisitions and Mergers
      2. 6.4.2. New Products
      3. 6.4.3. Research & Development Activities
  7. CHAPTER 7. Company Profiles
    1. 7.1. Westone
      1. 7.1.1. Company Overview
      2. 7.1.2. Westone Sales, Revenue, Price, and Gross Margin
      3. 7.1.3. Product portfolio
      4. 7.1.4. Recent initiatives
    2. 7.2. Gemalto
      1. 7.2.1. Company Overview
      2. 7.2.2. Gemalto Sales, Revenue, Price, and Gross Margin
      3. 7.2.3. Product portfolio
      4. 7.2.4. Recent initiatives
    3. 7.3. Thales
      1. 7.3.1. Company Overview
      2. 7.3.2. Thales Sales, Revenue, Price, and Gross Margin
      3. 7.3.3. Product portfolio
      4. 7.3.4. Recent initiatives
    4. 7.4. Ultra Electronics
      1. 7.4.1. Company Overview
      2. 7.4.2. Ultra Electronics Sales, Revenue, Price, and Gross Margin
      3. 7.4.3. Product portfolio
      4. 7.4.4. Recent initiatives
    5. 7.5. Utimaco
      1. 7.5.1. Company Overview
      2. 7.5.2. Utimaco Sales, Revenue, Price, and Gross Margin
      3. 7.5.3. Product portfolio
      4. 7.5.4. Recent initiatives
    6. 7.6. SWIFT
      1. 7.6.1. Company Overview
      2. 7.6.2. SWIFT Sales, Revenue, Price, and Gross Margin
      3. 7.6.3. Product portfolio
      4. 7.6.4. Recent initiatives
    7. 7.7. Atos SE
      1. 7.7.1. Company Overview
      2. 7.7.2. Atos SE Sales, Revenue, Price, and Gross Margin
      3. 7.7.3. Product portfolio
      4. 7.7.4. Recent initiatives
    8. 7.8. Yubico
      1. 7.8.1. Company Overview
      2. 7.8.2. Yubico Sales, Revenue, Price, and Gross Margin
      3. 7.8.3. Product portfolio
      4. 7.8.4. Recent initiatives
    9. 7.9. Micro Focus
      1. 7.9.1. Company Overview
      2. 7.9.2. Micro Focus Sales, Revenue, Price, and Gross Margin
      3. 7.9.3. Product portfolio
      4. 7.9.4. Recent initiatives
    10. 7.10. Futurex
      1. 7.10.1. Company Overview
      2. 7.10.2. Futurex Sales, Revenue, Price, and Gross Margin
      3. 7.10.3. Product portfolio
      4. 7.10.4. Recent initiatives
    11. 7.11. JN UNION
      1. 7.11.1. Company Overview
      2. 7.11.2. JN UNION Sales, Revenue, Price, and Gross Margin
      3. 7.11.3. Product portfolio
      4. 7.11.4. Recent initiatives
    12. 7.12. JN TASS
      1. 7.12.1. Company Overview
      2. 7.12.2. JN TASS Sales, Revenue, Price, and Gross Margin
      3. 7.12.3. Product portfolio
      4. 7.12.4. Recent initiatives
    13. 7.13. SPYRUS Inc.
      1. 7.13.1. Company Overview
      2. 7.13.2. SPYRUS Inc. Sales, Revenue, Price, and Gross Margin
      3. 7.13.3. Product portfolio
      4. 7.13.4. Recent initiatives
    14. 7.14. Beijing Sansec Technology
      1. 7.14.1. Company Overview
      2. 7.14.2. Beijing Sansec Technology Sales, Revenue, Price, and Gross Margin
      3. 7.14.3. Product portfolio
      4. 7.14.4. Recent initiatives
    15. 7.15. and others
      1. 7.15.1. Company Overview
      2. 7.15.2. and others Sales, Revenue, Price, and Gross Margin
      3. 7.15.3. Product portfolio
      4. 7.15.4. Recent initiatives
  8. CHAPTER 8. Payment HSMs — Industry Analysis
    1. 8.1. Introduction and Taxonomy
    2. 8.2. Payment HSMs Market – Key Trends
      1. 8.2.1. Market Drivers
      2. 8.2.2. Market Restraints
      3. 8.2.3. Market Opportunities
    3. 8.3. Value Chain Analysis
    4. 8.4. Key Mandates and Regulations
    5. 8.5. Technology Roadmap and Timeline
    6. 8.6. Payment HSMs market – Attractiveness Analysis
      1. 8.6.1. By Type
      2. 8.6.2. By Application
      3. 8.6.3. By Region
  9. CHAPTER 9. Raw Material analysis
    1. 9.1. Payment HSMs Key Raw Material Analysis
      1. 9.1.1. Key Raw Materials
      2. 9.1.2. Price Trend of Key Raw Materials
    2. 9.2. Key Suppliers of Raw Materials
    3. 9.3. Proportion of Manufacturing Cost Structure
      1. 9.3.1. Raw Materials
      2. 9.3.2. Labor Cost
    4. 9.4. Manufacturing Expenses Analysis of Payment HSMs
  10. CHAPTER 10. Industrial Chain, Sourcing Strategy and Downstream Buyers
    1. 10.1. Payment HSMs Industrial Chain Analysis
    2. 10.2. Upstream Raw Materials Sourcing
      1. 10.2.1. Risk Mitigation:
      2. 10.2.2. Supplier Relationships:
      3. 10.2.3. Business Processes:
      4. 10.2.4. Securing the Product:
    3. 10.3. Raw Materials Sources of Payment HSMs Major Manufacturers in 2016
    4. 10.4. Downstream Buyers
    5. 10.5. Distributors/Traders List
  11. CHAPTER 11. Marketing Strategy Analysis, Distributors
    1. 11.1. Marketing Channel
    2. 11.2. Direct Marketing
    3. 11.3. Indirect Marketing
    4. 11.4. Marketing Channel Development Trend
    5. 11.5. Economic/Political Environmental Change
  12. CHAPTER 12. Report Conclusion
  13. CHAPTER 13. Research Approach & Methodology
    1. 13.1. Report Description
    2. 13.2. Research Scope
    3. 13.3. Research Methodology
      1. 13.3.1. Secondary Research
      2. 13.3.2. Primary Research
      3. 13.3.3. Models
        1. 13.3.3.1. Company Share Analysis Model
        2. 13.3.3.2. Revenue Based Modeling
        3. 13.3.3.3. Research Limitations

        List of Figures

        FIG. 1 Global Payment HSMs Market, 2016-2026 (USD Million)
        FIG. 2 Global Payment HSMs Market Share, by Type, 2019 & 2026 (USD Million)
        FIG. 3 Global Payment HSMs Market share, by Type, 2019 & 2026 (K Units)
        FIG. 4 Global PCI Based Payment HSMs Market, 2016-2026 (USD Million)
        FIG. 5 Global PCI Based Payment HSMs  Market, 2016-2026 (K Units)
        FIG. 6 Global USB Based Payment HSMs Market, 2016-2026 (USD Million)
        FIG. 7 Global USB Based Payment HSMs  Market, 2016-2026 (K Units)
        FIG. 8 Global Network Based Payment HSMs Market, 2016-2026 (USD Million)
        FIG. 9 Global Network Based Payment HSMs  Market, 2016-2026 (K Units)
        FIG. 10 Global Java Based Payment HSMs Market, 2016-2026 (USD Million)
        FIG. 11 Global Java Based Payment HSMs  Market, 2016-2026 (K Units)
        FIG. 12 Global Payment HSMs Market Share, by Application, 2019 & 2026 (USD Million)
        FIG. 13 Global Payment HSMs Market share, by Application, 2019 & 2026 (K Units)
        FIG. 14 Global Industrial and Manufacturing Payment HSMs Market, 2016-2026 (USD Million)
        FIG. 15 Global Industrial and Manufacturing Payment HSMs  Market, 2016-2026 (K Units)
        FIG. 16 Global Banking Payment HSMs Market, 2016-2026 (USD Million)
        FIG. 17 Global Banking Payment HSMs  Market, 2016-2026 (K Units)
        FIG. 18 Global Financial Services and Insurance (BFSI) Payment HSMs Market, 2016-2026 (USD Million)
        FIG. 19 Global Financial Services and Insurance (BFSI) Payment HSMs  Market, 2016-2026 (K Units)
        FIG. 20 Global Government) Payment HSMs Market, 2016-2026 (USD Million)
        FIG. 21 Global Government) Payment HSMs  Market, 2016-2026 (K Units)
        FIG. 22 Global Payment HSMs Market Share, by Region, 2019 & 2026
        FIG. 23 Global Payment HSMs Market Share, by Region, 2019 & 2026
        FIG. 24 North America Payment HSMs Market, 2016-2026
        FIG. 25 North America Payment HSMs  Market, 2016-2026 (K Units)
        FIG. 26 U.S. Payment HSMs Market, 2016-2026
        FIG. 27 U.S. Payment HSMs  Market, 2016-2026 (K Units)
        FIG. 28 Canada Payment HSMs Market, 2016-2026
        FIG. 29 Canada Payment HSMs  Market, 2016-2026 (K Units)
        FIG. 30 Europe Payment HSMs Market, 2016-2026
        FIG. 31 Europe Payment HSMs  Market, 2016-2026 (K Units)
        FIG. 32 Germany Payment HSMs Market, 2016-2026
        FIG. 33 Germany Payment HSMs  Market, 2016-2026 (K Units)
        FIG. 34 France Payment HSMs Market, 2016-2026
        FIG. 35 France Payment HSMs  Market, 2016-2026 (K Units)
        FIG. 36 U.K. Payment HSMs Market, 2016-2026
        FIG. 37 U.K. Payment HSMs  Market, 2016-2026 (K Units)
        FIG. 38 Italy Payment HSMs Market, 2016-2026
        FIG. 39 Italy Payment HSMs  Market, 2016-2026 (K Units)
        FIG. 40 Spain Payment HSMs Market, 2016-2026
        FIG. 41 Spain Payment HSMs  Market, 2016-2026 (K Units)
        FIG. 42 Rest of Europe Payment HSMs Market, 2016-2026
        FIG. 43 Rest of Europe Payment HSMs  Market, 2016-2026 (K Units)
        FIG. 44 Asia Pacific Payment HSMs Market, 2016-2026
        FIG. 45 Asia Pacific Payment HSMs  Market, 2016-2026 (K Units)
        FIG. 46 China Payment HSMs Market, 2016-2026
        FIG. 47 China Payment HSMs  Market, 2016-2026 (K Units)
        FIG. 48 Japan Payment HSMs Market, 2016-2026
        FIG. 49 Japan Payment HSMs  Market, 2016-2026 (K Units)
        FIG. 50 India Payment HSMs Market, 2016-2026
        FIG. 51 India Payment HSMs  Market, 2016-2026 (K Units)
        FIG. 52 South  Korea Payment HSMs Market, 2016-2026
        FIG. 53 South  Korea Payment HSMs  Market, 2016-2026 (K Units)
        FIG. 54 South-East Asia Payment HSMs Market, 2016-2026
        FIG. 55 South-East Asia Payment HSMs  Market, 2016-2026 (K Units)
        FIG. 56 Rest of Asia Pacific Payment HSMs Market, 2016-2026
        FIG. 57 Rest of Asia Pacific Payment HSMs  Market, 2016-2026 (K Units)
        FIG. 58 Latin America Payment HSMs Market, 2016-2026
        FIG. 59 Latin America Payment HSMs  Market, 2016-2026 (K Units)
        FIG. 60 Brazil Payment HSMs Market, 2016-2026
        FIG. 61 Brazil Payment HSMs  Market, 2016-2026 (K Units)
        FIG. 62 Mexico Payment HSMs Market, 2016-2026
        FIG. 63 Mexico Payment HSMs  Market, 2016-2026 (K Units)
        FIG. 64 Rest of Latin America Payment HSMs Market, 2016-2026
        FIG. 65 Rest of Latin America Payment HSMs  Market, 2016-2026 (K Units)
        FIG. 66 The Middle-East and Africa Payment HSMs Market, 2016-2026
        FIG. 67 The Middle-East and Africa Payment HSMs  Market, 2016-2026 (K Units)
        FIG. 68 GCC Countries Payment HSMs Market, 2016-2026
        FIG. 69 GCC Countries Payment HSMs  Market, 2016-2026 (K Units)
        FIG. 70 South Africa Payment HSMs Market, 2016-2026
        FIG. 71 South Africa Payment HSMs  Market, 2016-2026 (K Units)
        FIG. 72 Rest of Middle-East Africa Payment HSMs Market, 2016-2026
        FIG. 73 Rest of Middle-East Africa Payment HSMs  Market, 2016-2026 (K Units)
        FIG. 74 Global Payment HSMs production and revenue, 2015-2025 (USD Million) (K Units)
        FIG. 75 North America Payment HSMs production and revenue, 2015-2025 (USD Million) (K Units)
        FIG. 76 Europe Payment HSMs production and revenue, 2015-2025 (USD Million) (K Units)
        FIG. 77 Asia Pacific Payment HSMs production and revenue, 2015-2025 (USD Million) (K Units)
        FIG. 78 Latin America Payment HSMs production and revenue, 2015-2025 (USD Million) (K Units)
        FIG. 79 Middle East and Africa Payment HSMs production and revenue, 2015-2025 (USD Million) (K Units)
        FIG. 80 Competitor Market Share – Revenue
        FIG. 81 Competitor Market Share – Volume
        FIG. 82 Westone Revenue and Growth Rate
        FIG. 83 Westone Market Share
        FIG. 84 Gemalto Revenue and Growth Rate
        FIG. 85 Gemalto Market Share
        FIG. 86 Thales Revenue and Growth Rate
        FIG. 87 Thales Market Share
        FIG. 88 Ultra Electronics Revenue and Growth Rate
        FIG. 89 Ultra Electronics Market Share
        FIG. 90 Utimaco Revenue and Growth Rate
        FIG. 91 Utimaco Market Share
        FIG. 92 SWIFT Revenue and Growth Rate
        FIG. 93 SWIFT Market Share
        FIG. 94 Atos SE Revenue and Growth Rate
        FIG. 95 Atos SE Market Share
        FIG. 96 Yubico Revenue and Growth Rate
        FIG. 97 Yubico Market Share
        FIG. 98 Micro Focus Revenue and Growth Rate
        FIG. 99 Micro Focus Market Share
        FIG. 100 Futurex Revenue and Growth Rate
        FIG. 101 Futurex Market Share
        FIG. 102 JN UNION Revenue and Growth Rate
        FIG. 103 JN UNION Market Share
        FIG. 104 JN TASS Revenue and Growth Rate
        FIG. 105 JN TASS Market Share
        FIG. 106 SPYRUS Inc. Revenue and Growth Rate
        FIG. 107 SPYRUS Inc. Market Share
        FIG. 108 Beijing Sansec Technology Revenue and Growth Rate
        FIG. 109 Beijing Sansec Technology Market Share
        FIG. 110 and others Revenue and Growth Rate
        FIG. 111 and others Market Share
        FIG. 112 Market Dynamics
        FIG. 113 Global Payment HSMs – Value Chain Analysis
        FIG. 114 Key Mandates and Regulations
        FIG. 115 Technology Roadmap and Timeline
        FIG. 116 Market Attractiveness Analysis – By Type
        FIG. 117 Market Attractiveness Analysis – By Application
        FIG. 118 Market Attractiveness Analysis – By Region
        FIG. 119 Manufacturing Cost Structure of Payment HSMs
        FIG. 120 Payment HSMs Industrial Chain Analysis
        FIG. 121 Market Channel
        FIG. 122 Marketing Channel Development Trend
        FIG. 123 Growth in World Gross Product, 2008-2018

        List of Tables

        TABLE 1 Global Payment HSMs market, 2019 & 2026 (USD Million)
        TABLE 2 Global Payment HSMs market, by Type, 2016-2026 (USD Million)
        TABLE 3 Global Payment HSMs market, by Type, 2016-2026 (K Units)
        TABLE 4 Global Payment HSMs market, by Application, 2016-2026 (USD Million)
        TABLE 5 Global Payment HSMs market, by Application, 2016-2026 (K Units)
        TABLE 6 Global Payment HSMs market, by region, 2016-2026 (USD Million)
        TABLE 7 Global Payment HSMs market, by region, 2016-2026 (K Units)
        TABLE 8 North America Payment HSMs Market, by Type, 2016-2026 (USD Million)
        TABLE 9 North America Payment HSMs Market, by Type, 2016-2026 (K Units)
        TABLE 10 North America Payment HSMs Market, by Application, 2016-2026 (USD Million)
        TABLE 11 North America Payment HSMs Market, by Application, 2016-2026 (K Units)
        TABLE 12 Europe Payment HSMs Market, by Type, 2016-2026 (USD Million)
        TABLE 13 Europe Payment HSMs Market, by Type, 2016-2026 (K Units)
        TABLE 14 Europe Payment HSMs Market, by Application, 2016-2026 (USD Million)
        TABLE 15 Europe Payment HSMs Market, by Application, 2016-2026 (K Units)
        TABLE 16 Asia Pacific Payment HSMs Market, by Type, 2016-2026 (USD Million)
        TABLE 17 Asia Pacific Payment HSMs Market, by Type, 2016-2026 (K Units)
        TABLE 18 Asia Pacific Payment HSMs Market, by Application, 2016-2026 (USD Million)
        TABLE 19 Asia Pacific Payment HSMs Market, by Application, 2016-2026 (K Units)
        TABLE 20 Latin America Payment HSMs Market, by Type, 2016-2026 (USD Million)
        TABLE 21 Latin America Payment HSMs Market, by Type, 2016-2026 (K Units)
        TABLE 22 Latin America Payment HSMs Market, by Application, 2016-2026 (USD Million)
        TABLE 23 Latin America Payment HSMs Market, by Application, 2016-2026 (K Units)
        TABLE 24 The Middle-East and Africa Payment HSMs Market, by Type, 2016-2026 (USD Million)
        TABLE 25 The Middle-East and Africa Payment HSMs Market, by Type, 2016-2026 (K Units)
        TABLE 26 The Middle-East and Africa Payment HSMs Market, by Application, 2016-2026 (USD Million)
        TABLE 27 The Middle-East and Africa Payment HSMs Market, by Application, 2016-2026 (K Units)
        TABLE 28 North America Payment HSMs Production, Consumption, Export, Import, 2016-2019
        TABLE 29 Europe Payment HSMs Production, Consumption, Export, Import, 2016-2019
        TABLE 30 Asia Pacific Payment HSMs Production, Consumption, Export, Import, 2016-2019
        TABLE 31 Latin America Payment HSMs Production, Consumption, Export, Import, 2016-2019
        TABLE 32 Middle East & Africa Payment HSMs Production, Consumption, Export, Import, 2016-2019
        TABLE 33 Global Payment HSMs Market - Company Revenue Analysis 2016-2019 (USD Million)
        TABLE 34 Global Payment HSMs Market - Company Revenue Share Analysis 2016-2019(%)
        TABLE 35 Global Payment HSMs Market - Company Volume Analysis 2016-2019 (K Units)
        TABLE 36 Global Payment HSMs Market - Company Volume Share Analysis 2016-2019(%)
        TABLE 37 Acquisitions and Mergers
        TABLE 38 New Product/Service Launch
        TABLE 39 Research & Development Activities
        TABLE 40 Market Drivers
        TABLE 41 Market Restraints
        TABLE 42 Market Opportunities
        TABLE 43 Production Base and Market Concentration Rate of Raw Material
        TABLE 44 Key Suppliers of Raw Materials
        TABLE 45 Raw Materials Sources of Payment HSMs Major Manufacturers in 2016
        TABLE 46 Major Buyers of Payment HSMs
        TABLE 47 Distributors/Traders of Payment HSMs by Region

Industry Major Market Players

  •  Westone
  •  Gemalto
  •  Thales
  •  Ultra Electronics
  •  Utimaco
  •  SWIFT
  •  Atos SE
  •  Yubico
  •  Micro Focus
  •  Futurex
  •  JN UNION
  •  JN TASS
  •  SPYRUS Inc.
  •  Beijing Sansec Technology