Search Market Research Report

Discover Our Latest Reports
Discover Our Featured Reports
Discover Top Selling Reports

Paste PVC Resin Market Size, Share Global Analysis Report, 2020–2026

report img

Paste PVC Resin Market By Commercial Type (Micro Suspension Method, Emulsion Method), By Grade Type (Vinyl Acetate Copolymer Grade, Low K Value Grade, Medium K Value Grade And High K Value Grade) and By Application (Plastic Floor And Wallpaper, Automotive Sealing, Paint And Coatings, Artificial Leather And Others (Gloves, Toys, etc.): Global Industry Outlook, Market Size, Business Intelligence, Consumer Preferences, Statistical Surveys, Comprehensive Analysis, Historical Developments, Current Trends, and Forecast 2020–2026

Industry Insights

The Paste PVC resin market report analyzes and notifies the industry statistics at the global as well as regional and country levels in order to acquire a thorough perspective of the entire paste PVC resin market. The historical and past insights are provided for FY 2016 to FY 2019 whereas projected trends are delivered for FY 2020 to FY 2026. The quantitative and numerical data is represented in terms of value (USD Million) and volume (Kilo Tons) from FY 2016 – 2026.

This specialized and expertise-oriented industry research report scrutinizes the technical and commercial business outlook of the paste PVC resin industry. The report analyzes and declares the historical and current trends analysis of the paste PVC resin industry and subsequently recommends the projected trends anticipated to be observed in the paste PVC resin market during the upcoming years.

Paste PVC Resin Market Size

To know more about this report | Request Free Sample Copy


logoKey Insights from Primary Research

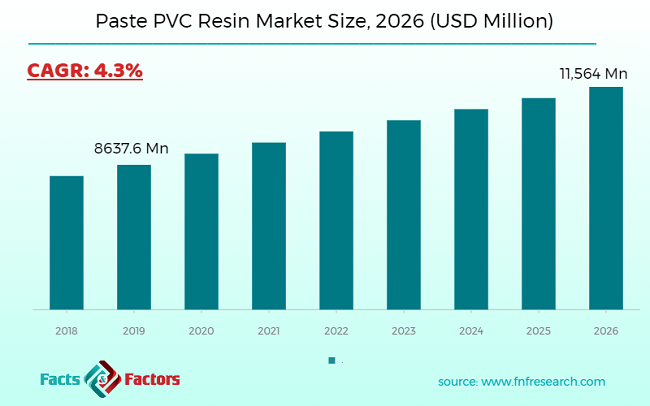
  • With wide-ranging interviews with CEOs of the companies engaged in the manufacturing of paste PVC resin, we analyzed that the global paste PVC resin market to undergo a robust growth in the vicinity of 4.3 % till 2026 end.
  • The interviewee’s insights anticipated that the global value of the paste PVC resin market to surpass the value of USD 11500 Million by 2026. We authenticated the projected numeral with our secondary research undertaken by our senior analysts.
  • The representatives predict the emulsion method of PVC production to continue the trend of dominance with the highest market share while exhibiting the highest growth rate. The high k-value grade PVC material is expected to be the most widely used material.
  • The Asia Pacific region is expected to continue the trend of dominance while generating the highest revenue during the forecast period. CXOs also believe the Asia Pacific region to exhibit the fastest growth, especially in China.
  • The North American region is expected to hold the second largest market value for the global paste PVC resin market with the United States expected to contribute the highest among the North American countries.

logoKey Recommendations from Analysts

  • Our analysts recommend increased concentration in the Asia Pacific region. China and India are major economies in the Asia Pacific region with rising populations and expanding construction and automotive industry. The governments in these countries are increasingly investing in infrastructure projects and the adoption of electric vehicles.
  • The market in Asia Pacific holds significant potential owing to rising economic conditions in the region. Japan, Korea, and major South East Asian countries are expected to further catalyze the market growth in the region.
  • With new technologies coming into the market with respect to manufacturing and end users, the market is expected to experience higher growth in the near future.

logo
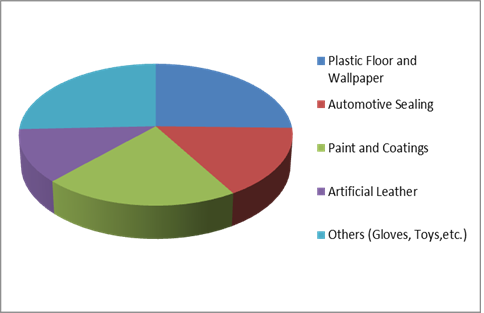
Key Market Application-Application Analysis

Paste PVC resin Market

To know more about this report | Request Free Sample Copy


The quantitative data is further underlined and reinforced by comprehensive qualitative data which comprises various across-the-board market dynamics. The rationales which directly or indirectly impact the paste PVC resin industry are exemplified through parameters such as growth drivers, restraints, challenges, and opportunities among other impacting factors.

Throughout our research report, we have encompassed all the proven models and tools of industry analysis and extensively illustrated all the key business strategies and business models adopted in the Paste PVC resin industry. The report provides an all-inclusive and detailed competitive landscape prevalent in the Paste PVC Resin market.

The report utilizes established industry analysis tools and models such as Porter’s Five Forces framework to analyze and recognize critical business strategies adopted by various stakeholders involved in the entire value chain of the paste PVC resin industry. The paste PVC resin market report additionally employs SWOT analysis and PESTLE analysis models for further in-depth analysis.

The report study further includes an in-depth analysis of industry players' market shares and provides an overview of leading players' market position in the paste PVC resin sector. Key strategic developments in the paste PVC resin market competitive landscape such as acquisitions & mergers, inaugurations of different products and services, partnerships & joint ventures, MoU agreements, VC & funding activities, R&D activities, and geographic expansion among other noteworthy activities by key players of the paste PVC resin market are appropriately highlighted in the report.

The rising infrastructure investment has been propelling the growth of the construction sector. With the rising construction sector, the demand for low-cost construction material is been increasing wherein conventional materials like wood, clay, concrete, and metal are been replaced.

Additionally, with the world rapidly moving towards the adoption of electric vehicles, manufacturers are consistently incorporating lightweight materials to increase the efficiency and performance of the battery-driven electric vehicle. The demand from automotive manufacturers for lightweight components is expected to further propel the market growth of paste PVC resin.

The paste PVC resin market research report delivers an acute valuation and taxonomy of the paste PVC resin industry by practically splitting the market on the basis of different commercial types, grade types, applications, and regions. Through the analysis of the historical and projected trends, all the segments and sub-segments were evaluated through the bottom-up approach, and different market sizes have been projected for FY 2020 to FY 2026. The regional segmentation of the paste PVC resin industry includes the complete classification of all the major continents including North America, Latin America, Europe, Asia Pacific, and the Middle East & Africa. Further, country-wise data for the paste PVC resin industry is provided for the leading economies of the world.

The paste PVC resin market is segmented based on commercial type, grade type, and application. On the basis of commercial-type segmentation, the market is classified into a micro-suspension method and an emulsion method. On the basis of grade type segmentation, the market is classified into vinyl acetate copolymer grade, low k-value grade, medium k-value grade, and high k-value grade. In terms of Application segmentation, the market is bifurcated into plastic floor and wallpaper, automotive sealing, paint and coatings, artificial leather, and others (gloves, toys, etc.).

logoReport Scope

Report Attribute

Details

Market Size in 2019

USD 8637.6 Million

Projected Market Size in 2026

USD 11564 Million

CAGR Growth Rate

4.3% CAGR

Base Year

2019

Forecast Years

2020-2026

Key Market Players

Vinnolit GmbH & Co. KG, Kem One, Mexichem S.A.B. de C.V., Solvay S.A., Shin-Etsu Chemical, Cires SA, Braskem, SCG Chemicals, LG Chem, Gogara International, The Sanmar Group and Tosoh Corporation.

Key Segment

By Commercial Type, By Application, By Grade, By Region

Major Regions Covered

North America, Europe, Asia Pacific, Latin America, and the Middle East & Africa

Purchase Options

Request customized purchase options to meet your research needs. Explore purchase options

logoSome of the essential players operating in the paste PVC resin market, but not restricted to include

  •  Vinnolit GmbH & Co. KG
  •  Kem One
  •  Mexichem S.A.B. de C.V.
  •  Solvay S.A.
  •  Shin-Etsu Chemical
  •  Cires SA
  •  Braskem
  •  SCG chemicals
  •  LG Chem
  •  Gogara International
  •  The Sanmar Group 
  •  Tosoh Corporation.

The taxonomy of the paste PVC resin industry by its scope and segmentation is as follows:

logo By Commercial Type Segmentation Analysis

  • Micro-Suspension Method
  • Emulsion Method

logo By Grade Type Segmentation Analysis

  • Vinyl Acetate Copolymer Grade
  • Low K Value Grade
  • Medium K Value Grade
  • High K Value Grade

logo By Application Segmentation Analysis

  • Plastic Floor and Wallpaper
  • Automotive Sealing
  • Paint and Coatings
  • Artificial Leather
  • Others (Gloves, Toys, etc.)

logo Regional Segmentation Analysis

  • North America
    • The U.S.
    • Canada
  • Europe
    • France
    • The UK
    • Spain
    • Germany
    • Italy
    • Rest of Europe
  • Asia Pacific
    • China
    • Japan
    • India
    • South Korea
    • Southeast Asia
    • Rest of Asia Pacific
  • Latin America
    • Brazil
    • Mexico
    • Rest of Latin America
  • Middle East & Africa
    • GCC
    • South Africa
    • Rest of the Middle East & Africa

logoKEY BUSINESS POINTERS ADDRESSED & FOREMOST REASONS TO PROCURE THE REPORT:

  • Statistical Analysis of the Past, Current, and Future Trends of the Industry with Validated Market Sizes Data
  • Direct and Indirect Rationales Impacting the Industry
  • In-depth and Micro Analysis of Viable Segments and Sub-segments
  • Companies and Vendors Market Share, Competitive Landscape, and Player Positioning Analysis
  • Demand Side (Consumption) and Supply Side (Production) Perspective and Analysis wherever applicable
  • Key Buyers and End-Users Analysis
  • Value Chain and Manufacturing Cost Structure Analysis wherever relevant
  • Key Marketing Strategies as well as Key Sales Channels adopted in the market
  • Investment Opportunity Analysis & Patents Analysis wherever feasible
  • Technological Road Map & Technical Analysis
  • Robust Research Methodology comprising dynamic mix (65%~35%) of Extensive Primary Research (primary interviews, ad-hoc surveys, questionnaires) and Protracted Secondary Research (proprietary in-house database, paid external databases, publically available validated sources)

Table of Content

  1. CHAPTER 1. Executive Summary
  2. CHAPTER 2. Paste PVC Resin market – Commercial Type Analysis
    1. 2.1. Global Paste PVC Resin Market – Commercial Type Overview
    2. 2.2. Global Paste PVC Resin Market Share, by Commercial Type, 2019 & 2026 (USD Million)
    3. 2.3. Global Paste PVC Resin Market share, by Commercial Type, 2019 & 2026 (Kilo Tons)
    4. 2.4. Micro Suspension Method
      1. 2.4.1. Global Micro Suspension Method Paste PVC Resin Market, 2016-2026 (USD Million)
      2. 2.4.2. Global Micro Suspension Method Paste PVC Resin Market, 2016-2026 (Kilo Tons)
    5. 2.5. Emulsion Method
      1. 2.5.1. Global Emulsion Method Paste PVC Resin Market, 2016-2026 (USD Million)
      2. 2.5.2. Global Emulsion Method Paste PVC Resin Market, 2016-2026 (Kilo Tons)
  3. CHAPTER 3. Paste PVC Resin market – Grade Type Analysis
    1. 3.1. Global Paste PVC Resin Market – Grade Type Overview
    2. 3.2. Global Paste PVC Resin Market Share, by Grade Type, 2019 & 2026 (USD Million)
    3. 3.3. Global Paste PVC Resin Market share, by Grade Type, 2019 & 2026 (Kilo Tons)
    4. 3.4. Vinyl Acetate Copolymer Grade
      1. 3.4.1. Global Vinyl Acetate Copolymer Grade Paste PVC Resin Market, 2016-2026 (USD Million)
      2. 3.4.2. Global Vinyl Acetate Copolymer Grade Paste PVC Resin Market, 2016-2026 (Kilo Tons)
    5. 3.5. Low K Value Grade
      1. 3.5.1. Global Low K Value Grade Paste PVC Resin Market, 2016-2026 (USD Million)
      2. 3.5.2. Global Low K Value Grade Paste PVC Resin Market, 2016-2026 (Kilo Tons)
    6. 3.6. Medium K Value Grade
      1. 3.6.1. Global Medium K Value Grade Paste PVC Resin Market, 2016-2026 (USD Million)
      2. 3.6.2. Global Medium K Value Grade Paste PVC Resin Market, 2016-2026 (Kilo Tons)
    7. 3.7. High K Value Grade
      1. 3.7.1. Global High K Value Grade Paste PVC Resin Market, 2016-2026 (USD Million)
      2. 3.7.2. Global High K Value Grade Paste PVC Resin Market, 2016-2026 (Kilo Tons)
  4. CHAPTER 4. Paste PVC Resin market – Applications Analysis
    1. 4.1. Global Paste PVC Resin Market – Applications Overview
    2. 4.2. Global Paste PVC Resin Market Share, by Applications, 2019 & 2026 (USD Million)
    3. 4.3. Global Paste PVC Resin Market share, by Applications, 2019 & 2026 (Kilo Tons)
    4. 4.4. Plastic Floor and Wallpaper
      1. 4.4.1. Global Plastic Floor and Wallpaper Paste PVC Resin Market, 2016-2026 (USD Million)
      2. 4.4.2. Global Plastic Floor and Wallpaper Paste PVC Resin Market, 2016-2026 (Kilo Tons)
    5. 4.5. Automotive Sealing
      1. 4.5.1. Global Automotive Sealing Paste PVC Resin Market, 2016-2026 (USD Million)
      2. 4.5.2. Global Automotive Sealing Paste PVC Resin Market, 2016-2026 (Kilo Tons)
    6. 4.6. Paint and Coatings
      1. 4.6.1. Global Paint and Coatings Paste PVC Resin Market, 2016-2026 (USD Million)
      2. 4.6.2. Global Paint and Coatings Paste PVC Resin Market, 2016-2026 (Kilo Tons)
    7. 4.7. Artificial Leather
      1. 4.7.1. Global Artificial Leather Paste PVC Resin Market, 2016-2026 (USD Million)
      2. 4.7.2. Global Artificial Leather Paste PVC Resin Market, 2016-2026 (Kilo Tons)
    8. 4.8. Others (Gloves, Toys,etc.)
      1. 4.8.1. Global Others (Gloves, Toys,etc.) Paste PVC Resin Market, 2016-2026 (USD Million)
      2. 4.8.2. Global Others (Gloves, Toys,etc.) Paste PVC Resin Market, 2016-2026 (Kilo Tons)
  5. CHAPTER 5. Paste PVC Resin market – Regional Analysis
    1. 5.1. Global Paste PVC Resin Market Regional Overview
    2. 5.2. Global Paste PVC Resin Market Share, by Region, 2019 & 2026 (Value)
    3. 5.3. Global Paste PVC Resin Market Share, by Region, 2019 & 2026 (Volume)
    4. 5.4. North America
      1. 5.4.1. North America Paste PVC Resin Market size and forecast, 2016-2026
      2. 5.4.2. North America Paste PVC Resin Market, by Country, 2019 - 2026 (USD Million)
      3. 5.4.3. North America Market size and forecast, 2016-2026 (Kilo Tons)
      4. 5.4.4. North America Paste PVC Resin Market, by Country, 2019 - 2026 (Kilo Tons)
      5. 5.4.5. North America Paste PVC Resin Market, by Commercial Type, 2016-2026
        1. 5.4.5.1. North America Paste PVC Resin Market, by Commercial Type, 2016-2026 (USD Million)
        2. 5.4.5.2. North America Paste PVC Resin Market, by Commercial Type, 2016-2026 (Kilo Tons)
      6. 5.4.6. North America Paste PVC Resin Market, by Grade Type, 2016-2026
        1. 5.4.6.1. North America Paste PVC Resin Market, by Grade Type, 2016-2026 (USD Million)
        2. 5.4.6.2. North America Paste PVC Resin Market, by Grade Type, 2016-2026 (Kilo Tons)
      7. 5.4.7. North America Paste PVC Resin Market, by Applications, 2016-2026
        1. 5.4.7.1. North America Paste PVC Resin Market, by Applications, 2016-2026 (USD Million)
        2. 5.4.7.2. North America Paste PVC Resin Market, by Applications, 2016-2026 (Kilo Tons)
      8. 5.4.8. U.S.
        1. 5.4.8.1. U.S. Market size and forecast, 2016-2026 (USD Million)
        2. 5.4.8.2. U.S. Market size and forecast, 2016-2026 (Kilo Tons)
      9. 5.4.9. Canada
        1. 5.4.9.1. Canada Market size and forecast, 2016-2026 (USD Million)
        2. 5.4.9.2. Canada Market size and forecast, 2016-2026 (Kilo Tons)
    5. 5.5. Europe
      1. 5.5.1. Europe Paste PVC Resin Market size and forecast, 2016-2026
      2. 5.5.2. Europe Paste PVC Resin Market, by Country, 2019 - 2026 (USD Million)
      3. 5.5.3. Europe Market size and forecast, 2016-2026 (Kilo Tons)
      4. 5.5.4. Europe Paste PVC Resin Market, by Country, 2019 - 2026 (Kilo Tons)
      5. 5.5.5. Europe Paste PVC Resin Market, by Commercial Type, 2016-2026
        1. 5.5.5.1. Europe Paste PVC Resin Market, by Commercial Type, 2016-2026 (USD Million)
        2. 5.5.5.2. Europe Paste PVC Resin Market, by Commercial Type, 2016-2026 (Kilo Tons)
      6. 5.5.6. Europe Paste PVC Resin Market, by Grade Type, 2016-2026
        1. 5.5.6.1. Europe Paste PVC Resin Market, by Grade Type, 2016-2026 (USD Million)
        2. 5.5.6.2. Europe Paste PVC Resin Market, by Grade Type, 2016-2026 (Kilo Tons)
      7. 5.5.7. Europe Paste PVC Resin Market, by Applications, 2016-2026
        1. 5.5.7.1. Europe Paste PVC Resin Market, by Applications, 2016-2026 (USD Million)
        2. 5.5.7.2. Europe Paste PVC Resin Market, by Applications, 2016-2026 (Kilo Tons)
      8. 5.5.8. Germany
        1. 5.5.8.1. Germany Market size and forecast, 2016-2026 (USD Million)
        2. 5.5.8.2. Germany Market size and forecast, 2016-2026 (Kilo Tons)
      9. 5.5.9. France
        1. 5.5.9.1. France Market size and forecast, 2016-2026 (USD Million)
        2. 5.5.9.2. France Market size and forecast, 2016-2026 (Kilo Tons)
      10. 5.5.10. U.K.
        1. 5.5.10.1. U.K. Market size and forecast, 2016-2026 (USD Million)
        2. 5.5.10.2. U.K. Market size and forecast, 2016-2026 (Kilo Tons)
      11. 5.5.11. Italy
        1. 5.5.11.1. Italy Market size and forecast, 2016-2026 (USD Million)
        2. 5.5.11.2. Italy Market size and forecast, 2016-2026 (Kilo Tons)
      12. 5.5.12. Spain
        1. 5.5.12.1. Spain Market size and forecast, 2016-2026 (USD Million)
        2. 5.5.12.2. Spain Market size and forecast, 2016-2026 (Kilo Tons)
      13. 5.5.13. Rest of Europe
        1. 5.5.13.1. Rest of Europe Market size and forecast, 2016-2026 (USD Million)
        2. 5.5.13.2. Rest of Europe Market size and forecast, 2016-2026 (Kilo Tons)
    6. 5.6. Asia Pacific
      1. 5.6.1. Asia Pacific Paste PVC Resin Market size and forecast, 2016-2026
      2. 5.6.2. Asia Pacific Paste PVC Resin Market, by Country, 2019 - 2026 (USD Million)
      3. 5.6.3. Asia Pacific Market size and forecast, 2016-2026 (Kilo Tons)
      4. 5.6.4. Asia Pacific Paste PVC Resin Market, by Country, 2019 - 2026 (Kilo Tons)
      5. 5.6.5. Asia Pacific Paste PVC Resin Market, by Commercial Type, 2016-2026
        1. 5.6.5.1. Asia Pacific Paste PVC Resin Market, by Commercial Type, 2016-2026 (USD Million)
        2. 5.6.5.2. Asia Pacific Paste PVC Resin Market, by Commercial Type, 2016-2026 (Kilo Tons)
      6. 5.6.6. Asia Pacific Paste PVC Resin Market, by Grade Type, 2016-2026
        1. 5.6.6.1. Asia Pacific Paste PVC Resin Market, by Grade Type, 2016-2026 (USD Million)
        2. 5.6.6.2. Asia Pacific Paste PVC Resin Market, by Grade Type, 2016-2026 (Kilo Tons)
      7. 5.6.7. Asia Pacific Paste PVC Resin Market, by Applications, 2016-2026
        1. 5.6.7.1. Asia Pacific Paste PVC Resin Market, by Applications, 2016-2026 (USD Million)
        2. 5.6.7.2. Asia Pacific Paste PVC Resin Market, by Applications, 2016-2026 (Kilo Tons)
      8. 5.6.8. China
        1. 5.6.8.1. China Market size and forecast, 2016-2026 (USD Million)
        2. 5.6.8.2. China Market size and forecast, 2016-2026 (Kilo Tons)
      9. 5.6.9. Japan
        1. 5.6.9.1. Japan Market size and forecast, 2016-2026 (USD Million)
        2. 5.6.9.2. Japan Market size and forecast, 2016-2026 (Kilo Tons)
      10. 5.6.10. India
        1. 5.6.10.1. India Market size and forecast, 2016-2026 (USD Million)
        2. 5.6.10.2. India Market size and forecast, 2016-2026 (Kilo Tons)
      11. 5.6.11. South Korea
        1. 5.6.11.1. South Korea Market size and forecast, 2016-2026 (USD Million)
        2. 5.6.11.2. South Korea Market size and forecast, 2016-2026 (Kilo Tons)
      12. 5.6.12. South-East Asia
        1. 5.6.12.1. South-East Asia Market size and forecast, 2016-2026 (USD Million)
        2. 5.6.12.2. South-East Asia Market size and forecast, 2016-2026 (Kilo Tons)
      13. 5.6.13. Rest of Asia Pacific
        1. 5.6.13.1. Rest of Asia Pacific Market size and forecast, 2016-2026 (USD Million)
        2. 5.6.13.2. Rest of Asia Pacific Market size and forecast, 2016-2026 (Kilo Tons)
    7. 5.7. Latin America
      1. 5.7.1. Latin America Paste PVC Resin Market size and forecast, 2016-2026
      2. 5.7.2. Latin America Paste PVC Resin Market, by Country, 2019 - 2026 (USD Million)
      3. 5.7.3. Latin America Market size and forecast, 2016-2026 (Kilo Tons)
      4. 5.7.4. Latin America Paste PVC Resin Market, by Country, 2019 - 2026 (Kilo Tons)
      5. 5.7.5. Latin America Paste PVC Resin Market, by Commercial Type, 2016-2026
        1. 5.7.5.1. Latin America Paste PVC Resin Market, by Commercial Type, 2016-2026 (USD Million)
        2. 5.7.5.2. Latin America Paste PVC Resin Market, by Commercial Type, 2016-2026 (Kilo Tons)
      6. 5.7.6. Latin America Paste PVC Resin Market, by Grade Type, 2016-2026
        1. 5.7.6.1. Latin America Paste PVC Resin Market, by Grade Type, 2016-2026 (USD Million)
        2. 5.7.6.2. Latin America Paste PVC Resin Market, by Grade Type, 2016-2026 (Kilo Tons)
      7. 5.7.7. Latin America Paste PVC Resin Market, by Applications, 2016-2026
        1. 5.7.7.1. Latin America Paste PVC Resin Market, by Applications, 2016-2026 (USD Million)
        2. 5.7.7.2. Latin America Paste PVC Resin Market, by Applications, 2016-2026 (Kilo Tons)
      8. 5.7.8. Brazil
        1. 5.7.8.1. Brazil Market size and forecast, 2016-2026 (USD Million)
        2. 5.7.8.2. Brazil Market size and forecast, 2016-2026 (Kilo Tons)
      9. 5.7.9. Mexico
        1. 5.7.9.1. Mexico Market size and forecast, 2016-2026 (USD Million)
        2. 5.7.9.2. Mexico Market size and forecast, 2016-2026 (Kilo Tons)
      10. 5.7.10. Rest of Latin America
        1. 5.7.10.1. Rest of Latin America Market size and forecast, 2016-2026 (USD Million)
        2. 5.7.10.2. Rest of Latin America Market size and forecast, 2016-2026 (Kilo Tons)
    8. 5.8. The Middle-East and Africa
      1. 5.8.1. The Middle-East and Africa Paste PVC Resin Market size and forecast, 2016-2026
      2. 5.8.2. The Middle-East and Africa Paste PVC Resin Market, by Country, 2019 - 2026 (USD Million)
      3. 5.8.3. The Middle-East and Africa Market size and forecast, 2016-2026 (Kilo Tons)
      4. 5.8.4. The Middle-East and Africa Paste PVC Resin Market, by Country, 2019 - 2026 (Kilo Tons)
      5. 5.8.5. The Middle-East and Africa Paste PVC Resin Market, by Commercial Type, 2016-2026
        1. 5.8.5.1. The Middle-East and Africa Paste PVC Resin Market, by Commercial Type, 2016-2026 (USD Million)
        2. 5.8.5.2. The Middle-East and Africa Paste PVC Resin Market, by Commercial Type, 2016-2026 (Kilo Tons)
      6. 5.8.6. The Middle-East and Africa Paste PVC Resin Market, by Grade Type, 2016-2026
        1. 5.8.6.1. The Middle-East and Africa Paste PVC Resin Market, by Grade Type, 2016-2026 (USD Million)
        2. 5.8.6.2. The Middle-East and Africa Paste PVC Resin Market, by Grade Type, 2016-2026 (Kilo Tons)
      7. 5.8.7. The Middle-East and Africa Paste PVC Resin Market, by Applications, 2016-2026
        1. 5.8.7.1. The Middle-East and Africa Paste PVC Resin Market, by Applications, 2016-2026 (USD Million)
        2. 5.8.7.2. The Middle-East and Africa Paste PVC Resin Market, by Applications, 2016-2026 (Kilo Tons)
      8. 5.8.8. GCC Countries
        1. 5.8.8.1. GCC Countries Market size and forecast, 2016-2026 (USD Million)
        2. 5.8.8.2. GCC Countries Market size and forecast, 2016-2026 (Kilo Tons)
      9. 5.8.9. South Africa
        1. 5.8.9.1. South Africa Market size and forecast, 2016-2026 (USD Million)
        2. 5.8.9.2. South Africa Market size and forecast, 2016-2026 (Kilo Tons)
      10. 5.8.10. Rest of Middle-East Africa
        1. 5.8.10.1. Rest of Middle-East Africa Market size and forecast, 2016-2026 (USD Million)
        2. 5.8.10.2. Rest of Middle-East Africa Market size and forecast, 2016-2026 (Kilo Tons)
  6. CHAPTER 6. Paste PVC Resin Production, Consumption, Export, Import by Regions
    1. 6.1. Global Paste PVC Resin production and revenue, 2016-2026 (USD Million) (Kilo Tons)
    2. 6.2. Global Import and Export Analysis, by Region
  7. CHAPTER 7. Paste PVC Resin market – Competitive Landscape
    1. 7.1. Competitor Market Share – Revenue
    2. 7.2. Market Concentration Rate Analysis, Top 3 and Top 5 Players
    3. 7.3. Competitor Market Share – Volume
    4. 7.4. Strategic Development
      1. 7.4.1. Acquisitions and Mergers
      2. 7.4.2. New Products
      3. 7.4.3. Research & Development Activities
  8. CHAPTER 8. Company Profiles
    1. 8.1. Vinnolit GmbH & Co. KG
      1. 8.1.1. Company Overview
      2. 8.1.2. Vinnolit GmbH & Co. KG Sales, Revenue, Price, and Gross Margin
      3. 8.1.3. Product portfolio
      4. 8.1.4. Recent initiatives
    2. 8.2. Kem One
      1. 8.2.1. Company Overview
      2. 8.2.2. Kem One Sales, Revenue, Price, and Gross Margin
      3. 8.2.3. Product portfolio
      4. 8.2.4. Recent initiatives
    3. 8.3. Mexichem S.A.B. de C.V.
      1. 8.3.1. Company Overview
      2. 8.3.2. Mexichem S.A.B. de C.V. Sales, Revenue, Price, and Gross Margin
      3. 8.3.3. Product portfolio
      4. 8.3.4. Recent initiatives
    4. 8.4. Solvay S.A.
      1. 8.4.1. Company Overview
      2. 8.4.2. Solvay S.A. Sales, Revenue, Price, and Gross Margin
      3. 8.4.3. Product portfolio
      4. 8.4.4. Recent initiatives
    5. 8.5. Shin-Etsu Chemical
      1. 8.5.1. Company Overview
      2. 8.5.2. Shin-Etsu Chemical Sales, Revenue, Price, and Gross Margin
      3. 8.5.3. Product portfolio
      4. 8.5.4. Recent initiatives
    6. 8.6. Cires SA
      1. 8.6.1. Company Overview
      2. 8.6.2. Cires SA Sales, Revenue, Price, and Gross Margin
      3. 8.6.3. Product portfolio
      4. 8.6.4. Recent initiatives
    7. 8.7. Braskem
      1. 8.7.1. Company Overview
      2. 8.7.2. Braskem Sales, Revenue, Price, and Gross Margin
      3. 8.7.3. Product portfolio
      4. 8.7.4. Recent initiatives
    8. 8.8. SCG chemicals
      1. 8.8.1. Company Overview
      2. 8.8.2. SCG chemicals Sales, Revenue, Price, and Gross Margin
      3. 8.8.3. Product portfolio
      4. 8.8.4. Recent initiatives
    9. 8.9. LG Chem
      1. 8.9.1. Company Overview
      2. 8.9.2. LG Chem Sales, Revenue, Price, and Gross Margin
      3. 8.9.3. Product portfolio
      4. 8.9.4. Recent initiatives
    10. 8.10. Gogara International
      1. 8.10.1. Company Overview
      2. 8.10.2. Gogara International Sales, Revenue, Price, and Gross Margin
      3. 8.10.3. Product portfolio
      4. 8.10.4. Recent initiatives
    11. 8.11. The Sanmar Group
      1. 8.11.1. Company Overview
      2. 8.11.2. The Sanmar Group Sales, Revenue, Price, and Gross Margin
      3. 8.11.3. Product portfolio
      4. 8.11.4. Recent initiatives
    12. 8.12. Tosoh Corporation
      1. 8.12.1. Company Overview
      2. 8.12.2. Tosoh Corporation Sales, Revenue, Price, and Gross Margin
      3. 8.12.3. Product portfolio
      4. 8.12.4. Recent initiatives
  9. CHAPTER 9. Paste PVC Resin — Industry Analysis
    1. 9.1. Introduction and Taxonomy
    2. 9.2. Paste PVC Resin Market – Key Trends
      1. 9.2.1. Market Drivers
      2. 9.2.2. Market Restraints
      3. 9.2.3. Market Opportunities
    3. 9.3. Value Chain Analysis
    4. 9.4. Key Mandates and Regulations
    5. 9.5. Technology Roadmap and Timeline
    6. 9.6. Paste PVC Resin market – Attractiveness Analysis
      1. 9.6.1. By Commercial Type
      2. 9.6.2. By Grade Type
      3. 9.6.3. By Applications
      4. 9.6.4. By Region
  10. CHAPTER 10. Raw Material analysis
    1. 10.1. Paste PVC Resin Key Raw Material Analysis
      1. 10.1.1. Key Raw Materials
      2. 10.1.2. Price Trend of Key Raw Materials
    2. 10.2. Key Suppliers of Raw Materials
    3. 10.3. Proportion of Manufacturing Cost Structure
      1. 10.3.1. Raw Materials
      2. 10.3.2. Labor Cost
    4. 10.4. Manufacturing Expenses Analysis of Paste PVC Resin
  11. CHAPTER 11. Industrial Chain, Sourcing Strategy and Downstream Buyers
    1. 11.1. Paste PVC Resin Industrial Chain Analysis
    2. 11.2. Upstream Raw Materials Sourcing
      1. 11.2.1. Risk Mitigation:
      2. 11.2.2. Supplier Relationships:
      3. 11.2.3. Business Processes:
      4. 11.2.4. Securing the Product:
    3. 11.3. Raw Materials Sources of Paste PVC Resin Major Manufacturers in 2016
    4. 11.4. Downstream Buyers
    5. 11.5. Distributors/Traders List
  12. CHAPTER 12. Marketing Strategy Analysis, Distributors
    1. 12.1. Marketing Channel
    2. 12.2. Direct Marketing
    3. 12.3. Indirect Marketing
    4. 12.4. Marketing Channel Development Trend
    5. 12.5. Economic/Political Environmental Change
  13. CHAPTER 13. Report Conclusion
  14. CHAPTER 14. Research Approach & Methodology
    1. 14.1. Report Description
    2. 14.2. Research Scope
    3. 14.3. Research Methodology
      1. 14.3.1. Secondary Research
      2. 14.3.2. Primary Research
      3. 14.3.3. Models
        1. 14.3.3.1. Company Share Analysis Model
        2. 14.3.3.2. Revenue Based Modeling
        3. 14.3.3.3. Research Limitations

        List of Figures

        FIG. 1 Global Paste PVC Resin Market, 2016-2026 (USD Million)
        FIG. 2 Global Paste PVC Resin Market Share, by Commercial Type, 2019 & 2026 (USD Million)
        FIG. 3 Global Paste PVC Resin Market share, by Commercial Type, 2019 & 2026 (Kilo Tons)
        FIG. 4 Global Micro Suspension Method Paste PVC Resin Market, 2016-2026 (USD Million)
        FIG. 5 Global Micro Suspension Method Paste PVC Resin  Market, 2016-2026 (Kilo Tons)
        FIG. 6 Global Emulsion Method Paste PVC Resin Market, 2016-2026 (USD Million)
        FIG. 7 Global Emulsion Method Paste PVC Resin  Market, 2016-2026 (Kilo Tons)
        FIG. 8 Global Paste PVC Resin Market Share, by Grade Type, 2019 & 2026 (USD Million)
        FIG. 9 Global Paste PVC Resin Market share, by Grade Type, 2019 & 2026 (Kilo Tons)
        FIG. 10 Global Vinyl Acetate Copolymer Grade Paste PVC Resin Market, 2016-2026 (USD Million)
        FIG. 11 Global Vinyl Acetate Copolymer Grade Paste PVC Resin  Market, 2016-2026 (Kilo Tons)
        FIG. 12 Global Low K Value Grade Paste PVC Resin Market, 2016-2026 (USD Million)
        FIG. 13 Global Low K Value Grade Paste PVC Resin  Market, 2016-2026 (Kilo Tons)
        FIG. 14 Global Medium K Value Grade Paste PVC Resin Market, 2016-2026 (USD Million)
        FIG. 15 Global Medium K Value Grade Paste PVC Resin  Market, 2016-2026 (Kilo Tons)
        FIG. 16 Global High K Value Grade Paste PVC Resin Market, 2016-2026 (USD Million)
        FIG. 17 Global High K Value Grade Paste PVC Resin  Market, 2016-2026 (Kilo Tons)
        FIG. 18 Global Paste PVC Resin Market Share, by Applications, 2019 & 2026 (USD Million)
        FIG. 19 Global Paste PVC Resin Market share, by Applications, 2019 & 2026 (Kilo Tons)
        FIG. 20 Global Plastic Floor and Wallpaper Paste PVC Resin Market, 2016-2026 (USD Million)
        FIG. 21 Global Plastic Floor and Wallpaper Paste PVC Resin  Market, 2016-2026 (Kilo Tons)
        FIG. 22 Global Automotive Sealing Paste PVC Resin Market, 2016-2026 (USD Million)
        FIG. 23 Global Automotive Sealing Paste PVC Resin  Market, 2016-2026 (Kilo Tons)
        FIG. 24 Global Paint and Coatings Paste PVC Resin Market, 2016-2026 (USD Million)
        FIG. 25 Global Paint and Coatings Paste PVC Resin  Market, 2016-2026 (Kilo Tons)
        FIG. 26 Global Artificial Leather Paste PVC Resin Market, 2016-2026 (USD Million)
        FIG. 27 Global Artificial Leather Paste PVC Resin  Market, 2016-2026 (Kilo Tons)
        FIG. 28 Global Others (Gloves, Toys,etc.) Paste PVC Resin Market, 2016-2026 (USD Million)
        FIG. 29 Global Others (Gloves, Toys,etc.) Paste PVC Resin  Market, 2016-2026 (Kilo Tons)
        FIG. 30 Global Paste PVC Resin Market Share, by Region, 2019 & 2026
        FIG. 31 Global Paste PVC Resin Market Share, by Region, 2019 & 2026
        FIG. 32 North America Paste PVC Resin Market, 2016-2026
        FIG. 33 North America Paste PVC Resin  Market, 2016-2026 (Kilo Tons)
        FIG. 34 U.S. Paste PVC Resin Market, 2016-2026
        FIG. 35 U.S. Paste PVC Resin  Market, 2016-2026 (Kilo Tons)
        FIG. 36 Canada Paste PVC Resin Market, 2016-2026
        FIG. 37 Canada Paste PVC Resin  Market, 2016-2026 (Kilo Tons)
        FIG. 38 Europe Paste PVC Resin Market, 2016-2026
        FIG. 39 Europe Paste PVC Resin  Market, 2016-2026 (Kilo Tons)
        FIG. 40 Germany Paste PVC Resin Market, 2016-2026
        FIG. 41 Germany Paste PVC Resin  Market, 2016-2026 (Kilo Tons)
        FIG. 42 France Paste PVC Resin Market, 2016-2026
        FIG. 43 France Paste PVC Resin  Market, 2016-2026 (Kilo Tons)
        FIG. 44 U.K. Paste PVC Resin Market, 2016-2026
        FIG. 45 U.K. Paste PVC Resin  Market, 2016-2026 (Kilo Tons)
        FIG. 46 Italy Paste PVC Resin Market, 2016-2026
        FIG. 47 Italy Paste PVC Resin  Market, 2016-2026 (Kilo Tons)
        FIG. 48 Spain Paste PVC Resin Market, 2016-2026
        FIG. 49 Spain Paste PVC Resin  Market, 2016-2026 (Kilo Tons)
        FIG. 50 Rest of Europe Paste PVC Resin Market, 2016-2026
        FIG. 51 Rest of Europe Paste PVC Resin  Market, 2016-2026 (Kilo Tons)
        FIG. 52 Asia Pacific Paste PVC Resin Market, 2016-2026
        FIG. 53 Asia Pacific Paste PVC Resin  Market, 2016-2026 (Kilo Tons)
        FIG. 54 China Paste PVC Resin Market, 2016-2026
        FIG. 55 China Paste PVC Resin  Market, 2016-2026 (Kilo Tons)
        FIG. 56 Japan Paste PVC Resin Market, 2016-2026
        FIG. 57 Japan Paste PVC Resin  Market, 2016-2026 (Kilo Tons)
        FIG. 58 India Paste PVC Resin Market, 2016-2026
        FIG. 59 India Paste PVC Resin  Market, 2016-2026 (Kilo Tons)
        FIG. 60 South  Korea Paste PVC Resin Market, 2016-2026
        FIG. 61 South  Korea Paste PVC Resin  Market, 2016-2026 (Kilo Tons)
        FIG. 62 South-East Asia Paste PVC Resin Market, 2016-2026
        FIG. 63 South-East Asia Paste PVC Resin  Market, 2016-2026 (Kilo Tons)
        FIG. 64 Rest of Asia Pacific Paste PVC Resin Market, 2016-2026
        FIG. 65 Rest of Asia Pacific Paste PVC Resin  Market, 2016-2026 (Kilo Tons)
        FIG. 66 Latin America Paste PVC Resin Market, 2016-2026
        FIG. 67 Latin America Paste PVC Resin  Market, 2016-2026 (Kilo Tons)
        FIG. 68 Brazil Paste PVC Resin Market, 2016-2026
        FIG. 69 Brazil Paste PVC Resin  Market, 2016-2026 (Kilo Tons)
        FIG. 70 Mexico Paste PVC Resin Market, 2016-2026
        FIG. 71 Mexico Paste PVC Resin  Market, 2016-2026 (Kilo Tons)
        FIG. 72 Rest of Latin America Paste PVC Resin Market, 2016-2026
        FIG. 73 Rest of Latin America Paste PVC Resin  Market, 2016-2026 (Kilo Tons)
        FIG. 74 The Middle-East and Africa Paste PVC Resin Market, 2016-2026
        FIG. 75 The Middle-East and Africa Paste PVC Resin  Market, 2016-2026 (Kilo Tons)
        FIG. 76 GCC Countries Paste PVC Resin Market, 2016-2026
        FIG. 77 GCC Countries Paste PVC Resin  Market, 2016-2026 (Kilo Tons)
        FIG. 78 South Africa Paste PVC Resin Market, 2016-2026
        FIG. 79 South Africa Paste PVC Resin  Market, 2016-2026 (Kilo Tons)
        FIG. 80 Rest of Middle-East Africa Paste PVC Resin Market, 2016-2026
        FIG. 81 Rest of Middle-East Africa Paste PVC Resin  Market, 2016-2026 (Kilo Tons)
        FIG. 82 Global Paste PVC Resin production and revenue, 2016-2026 (USD Million) (Kilo Tons)
        FIG. 83 North America Paste PVC Resin production and revenue, 2016-2026 (USD Million) (Kilo Tons)
        FIG. 84 Europe Paste PVC Resin production and revenue, 2016-2026 (USD Million) (Kilo Tons)
        FIG. 85 Asia Pacific Paste PVC Resin production and revenue, 2016-2026 (USD Million) (Kilo Tons)
        FIG. 86 Latin America Paste PVC Resin production and revenue, 2016-2026 (USD Million) (Kilo Tons)
        FIG. 87 Middle East and Africa Paste PVC Resin production and revenue, 2016-2026 (USD Million) (Kilo Tons)
        FIG. 88 Competitor Market Share – Revenue
        FIG. 89 Competitor Market Share – Volume
        FIG. 90 Vinnolit GmbH & Co. KG Revenue and Growth Rate
        FIG. 91 Vinnolit GmbH & Co. KG Market Share
        FIG. 92 Kem One Revenue and Growth Rate
        FIG. 93 Kem One Market Share
        FIG. 94 Mexichem S.A.B. de C.V. Revenue and Growth Rate
        FIG. 95 Mexichem S.A.B. de C.V. Market Share
        FIG. 96 Solvay S.A. Revenue and Growth Rate
        FIG. 97 Solvay S.A. Market Share
        FIG. 98 Shin-Etsu Chemical Revenue and Growth Rate
        FIG. 99 Shin-Etsu Chemical Market Share
        FIG. 100 Cires SA Revenue and Growth Rate
        FIG. 101 Cires SA Market Share
        FIG. 102 Braskem Revenue and Growth Rate
        FIG. 103 Braskem Market Share
        FIG. 104 SCG chemicals Revenue and Growth Rate
        FIG. 105 SCG chemicals Market Share
        FIG. 106 LG Chem Revenue and Growth Rate
        FIG. 107 LG Chem Market Share
        FIG. 108 Gogara International Revenue and Growth Rate
        FIG. 109 Gogara International Market Share
        FIG. 110 The Sanmar Group Revenue and Growth Rate
        FIG. 111 The Sanmar Group Market Share
        FIG. 112 Tosoh Corporation Revenue and Growth Rate
        FIG. 113 Tosoh Corporation Market Share
        FIG. 114 Market Dynamics
        FIG. 115 Global Paste PVC Resin – Value Chain Analysis
        FIG. 116 Key Mandates and Regulations
        FIG. 117 Technology Roadmap and Timeline
        FIG. 118 Market Attractiveness Analysis – By Commercial Type
        FIG. 119 Market Attractiveness Analysis – By Grade Type
        FIG. 120 Market Attractiveness Analysis – By Applications
        FIG. 121 Market Attractiveness Analysis – By Region
        FIG. 122 Manufacturing Cost Structure of Paste PVC Resin
        FIG. 123 Paste PVC Resin Industrial Chain Analysis
        FIG. 124 Market Channel
        FIG. 125 Marketing Channel Development Trend
        FIG. 126 Growth in World Gross Product, 2008-2019

        List of Tables

        TABLE 1 Global Paste PVC Resin market, 2019 & 2026 (USD Million)
        TABLE 2 Global Paste PVC Resin market, by Commercial Type, 2016-2026 (USD Million)
        TABLE 3 Global Paste PVC Resin market, by Commercial Type, 2016-2026 (Kilo Tons)
        TABLE 4 Global Paste PVC Resin market, by Grade Type, 2016-2026 (USD Million)
        TABLE 5 Global Paste PVC Resin market, by Grade Type, 2016-2026 (Kilo Tons)
        TABLE 6 Global Paste PVC Resin market, by Applications, 2016-2026 (USD Million)
        TABLE 7 Global Paste PVC Resin market, by Applications, 2016-2026 (Kilo Tons)
        TABLE 8 Global Paste PVC Resin market, by region, 2016-2026 (USD Million)
        TABLE 9 Global Paste PVC Resin market, by region, 2016-2026 (Kilo Tons)
        TABLE 10 North America Paste PVC Resin Market, by Commercial Type, 2016-2026 (USD Million)
        TABLE 11 North America Paste PVC Resin Market, by Commercial Type, 2016-2026 (Kilo Tons)
        TABLE 12 North America Paste PVC Resin Market, by Grade Type, 2016-2026 (USD Million)
        TABLE 13 North America Paste PVC Resin Market, by Grade Type, 2016-2026 (Kilo Tons)
        TABLE 14 North America Paste PVC Resin Market, by Applications, 2016-2026 (USD Million)
        TABLE 15 North America Paste PVC Resin Market, by Applications, 2016-2026 (Kilo Tons)
        TABLE 16 Europe Paste PVC Resin Market, by Commercial Type, 2016-2026 (USD Million)
        TABLE 17 Europe Paste PVC Resin Market, by Commercial Type, 2016-2026 (Kilo Tons)
        TABLE 18 Europe Paste PVC Resin Market, by Grade Type, 2016-2026 (USD Million)
        TABLE 19 Europe Paste PVC Resin Market, by Grade Type, 2016-2026 (Kilo Tons)
        TABLE 20 Europe Paste PVC Resin Market, by Applications, 2016-2026 (USD Million)
        TABLE 21 Europe Paste PVC Resin Market, by Applications, 2016-2026 (Kilo Tons)
        TABLE 22 Asia Pacific Paste PVC Resin Market, by Commercial Type, 2016-2026 (USD Million)
        TABLE 23 Asia Pacific Paste PVC Resin Market, by Commercial Type, 2016-2026 (Kilo Tons)
        TABLE 24 Asia Pacific Paste PVC Resin Market, by Grade Type, 2016-2026 (USD Million)
        TABLE 25 Asia Pacific Paste PVC Resin Market, by Grade Type, 2016-2026 (Kilo Tons)
        TABLE 26 Asia Pacific Paste PVC Resin Market, by Applications, 2016-2026 (USD Million)
        TABLE 27 Asia Pacific Paste PVC Resin Market, by Applications, 2016-2026 (Kilo Tons)
        TABLE 28 Latin America Paste PVC Resin Market, by Commercial Type, 2016-2026 (USD Million)
        TABLE 29 Latin America Paste PVC Resin Market, by Commercial Type, 2016-2026 (Kilo Tons)
        TABLE 30 Latin America Paste PVC Resin Market, by Grade Type, 2016-2026 (USD Million)
        TABLE 31 Latin America Paste PVC Resin Market, by Grade Type, 2016-2026 (Kilo Tons)
        TABLE 32 Latin America Paste PVC Resin Market, by Applications, 2016-2026 (USD Million)
        TABLE 33 Latin America Paste PVC Resin Market, by Applications, 2016-2026 (Kilo Tons)
        TABLE 34 The Middle-East and Africa Paste PVC Resin Market, by Commercial Type, 2016-2026 (USD Million)
        TABLE 35 The Middle-East and Africa Paste PVC Resin Market, by Commercial Type, 2016-2026 (Kilo Tons)
        TABLE 36 The Middle-East and Africa Paste PVC Resin Market, by Grade Type, 2016-2026 (USD Million)
        TABLE 37 The Middle-East and Africa Paste PVC Resin Market, by Grade Type, 2016-2026 (Kilo Tons)
        TABLE 38 The Middle-East and Africa Paste PVC Resin Market, by Applications, 2016-2026 (USD Million)
        TABLE 39 The Middle-East and Africa Paste PVC Resin Market, by Applications, 2016-2026 (Kilo Tons)
        TABLE 40 North America Paste PVC Resin Production, Consumption, Export, Import, 2016-2019
        TABLE 41 Europe Paste PVC Resin Production, Consumption, Export, Import, 2016-2019
        TABLE 42 Asia Pacific Paste PVC Resin Production, Consumption, Export, Import, 2016-2019
        TABLE 43 Latin America Paste PVC Resin Production, Consumption, Export, Import, 2016-2019
        TABLE 44 Middle East & Africa Paste PVC Resin Production, Consumption, Export, Import, 2016-2019
        TABLE 45 Global Paste PVC Resin Market - Company Revenue Analysis 2016-2019 (USD Million)
        TABLE 46 Global Paste PVC Resin Market - Company Revenue Share Analysis 2016-2019(%)
        TABLE 47 Global Paste PVC Resin Market - Company Volume Analysis 2016-2019 (Kilo Tons)
        TABLE 48 Global Paste PVC Resin Market - Company Volume Share Analysis 2016-2019(%)
        TABLE 49 Acquisitions and Mergers
        TABLE 50 New Product/Service Launch
        TABLE 51 Research & Development Activities
        TABLE 52 Market Drivers
        TABLE 53 Market Restraints
        TABLE 54 Market Opportunities
        TABLE 55 Production Base and Market Concentration Rate of Raw Material
        TABLE 56 Key Suppliers of Raw Materials
        TABLE 57 Raw Materials Sources of Paste PVC Resin Major Manufacturers in 2016
        TABLE 58 Major Buyers of Paste PVC Resin
        TABLE 59 Distributors/Traders of Paste PVC Resin by Region
        

Industry Major Market Players

  •  Vinnolit GmbH & Co. KG
  •  Kem One
  •  Mexichem S.A.B. de C.V.
  •  Solvay S.A.
  •  Shin-Etsu Chemical
  •  Cires SA
  •  Braskem
  •  SCG chemicals
  •  LG Chem
  •  Gogara International
  •  The Sanmar Group 
  •  Tosoh Corporation.