Search Market Research Report

Discover Our Latest Reports
Discover Our Featured Reports
Discover Top Selling Reports

Para Nitrochlorobenzene (PNCB) Market Size, Share Global Analysis Report, 2020–2026

report img

Para Nitrochlorobenzene (PNCB) Market By Application (Agriculture, Pharmaceutical, Chemicals): Global Industry Outlook, Market Size, Business Intelligence, Consumer Preferences, Statistical Surveys, Comprehensive Analysis, Historical Developments, Current Trends, and Forecast 2020–2026

Industry Insights

The para nitro chlorobenzene (PNCB) market report analyzes and notifies the industry statistics at the global as well as regional and country levels to acquire a thorough perspective of the entire para nitro chlorobenzene (PNCB) market. The historical and past insights are provided for FY 2016 to FY 2019 whereas projected trends are delivered for FY 2020 to FY 2026. The quantitative and numerical data is represented in terms of both volume (Kilotons) and value (USD Million) from FY 2016 – 2026.

This specialized and expertise-oriented industry research report scrutinizes the technical and commercial business outlook of the para-nitro chlorobenzene (PNCB) industry. The report analyzes and declares the historical and current trends analysis of the para nitro chlorobenzene (PNCB) industry and subsequently recommends the projected trends anticipated to be observed in the para nitro chlorobenzene (PNCB) market during the upcoming years.

Para Nitrochlorobenzene (PNCB) Market

To know more about this report | Request Free Sample Copy


logoKey Insights from Primary Research

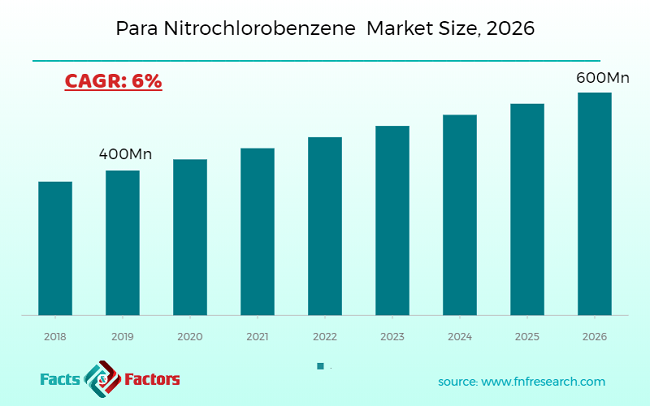
  • According to the CXO,s working in the para nitro chlorobenzene (PNCB) industry, the market is predicted to witness a substantial growth of above 6% during the years 2020-2026.
  • Due to the increasing demand for Para Nitrochlorobenzene (PNCB), the market is expected to develop over USD 600 million by 2026. In 2019, the market accounted for USD 400 million.
  • By application segment, the market is divided into agriculture, pharmaceutical, and chemicals. Among these, the chemical segment headed the market with a share of above 45%, in 2019 and it is expected to grow over the forecast period owing to its increasing demand in the chemical industry.
  • By geography, Asia Pacific is expected to be the fastest-growing market for para-nitro chlorobenzene (PNCB) in the years to come. In 2019, the Asia-pacific led the market with more than USD 235 million.
  • North America is projected to be the fastest-growing market owing to the growing demand for para nitro chlorobenzene (PNCB) in various industries in the North American region.

logoKey Recommendations from Analysts

  • Our analysts recommend that Europe is expected to be the fastest-growing market for Para Nitrochlorobenzene (PNCB) during the years to come attributed to the use of para nitro chlorobenzene in the various chemical industry.
  • Due to the growing demand for para nitro chlorobenzene in the agricultural sector as an insecticide, the agriculture category is anticipated to boost the market in the future years.
  • Owing to the use of para nitro chlorobenzene in the pharmaceuticals industry, the pharmaceuticals category is expected to bolster the market during the forthcoming years.
  • Due to the increasing demand for dyes in the textile and clothing industry and the growing demand for rubber chemicals due to the increasing use of rubber in the construction industry, the market is projected to grow over the forecast period.
  • Attributed to increasing demand for insecticides in the agricultural sector is also driving the market.

logoMarket Attractiveness By Application Analysis

Para Nitrochlorobenzene (PNCB)  Market

To know more about this report | Request Free Sample Copy


The quantitative data is further underlined and reinforced by comprehensive qualitative data which comprises various across-the-board market dynamics. The rationales which directly or indirectly impact the para nitro chlorobenzene (PNCB) industry are exemplified through parameters such as growth drivers, restraints, challenges, and opportunities among other impacting factors.

Throughout our research report, we have encompassed all the proven models and tools of industry analysis and extensively illustrated all the key business strategies and business models adopted in the para-nitro chlorobenzene (PNCB) industry. The report provides an all-inclusive and detailed competitive landscape prevalent in the para-nitro chlorobenzene (PNCB) market.

The report utilizes established industry analysis tools and models such as Porter’s Five Forces framework to analyze and recognize critical business strategies adopted by various stakeholders involved in the entire value chain of the para nitro chlorobenzene (PNCB) industry. The para nitro chlorobenzene (PNCB) market report additionally employs SWOT analysis and PESTLE analysis models for further in-depth analysis.

The report study further includes an in-depth analysis of industry players' market shares and provides an overview of leading players' market position in the para nitro chlorobenzene (PNCB) sector. Key strategic developments in the para nitro chlorobenzene (PNCB) market competitive landscape such as acquisitions & mergers, inaugurations of different products and services, partnerships & joint ventures, MoU agreements, VC & funding activities, R&D activities, and geographic expansion among other noteworthy activities by key players of the para nitro chlorobenzene (PNCB) market are appropriately highlighted in the report.

The formula for para nitro chlorobenzene is ClC6H4NO2 with a pale yellow solid. It is an organic compound. It gives a mixture of ~33% of o-nitro chlorobenzene and ~66% of p-nitro chlorobenzene. This mixture can not be isolated by distillation alone. 4-Nitrochlorobenzene is useful as an intermediate in many industries. The para nitro chlorobenzene is used in many pharmaceutical industries in the manufacturing of framycetin and paracetamol. The growing number of the pharmaceutical industry and the incidence of chronic diseases are driving the market. Furthermore, P-Nitrochlorobenzene (PNCB) is used in the manufacture of rubber, dyes, and pesticide as an intermediate. These factors are also driving the growth of the market. however, P-Nitrochlorobenzene can cause nose irritation, and affect when breathing. It also causes skin allergies. P-Nitrochlorobenzene is considered a hazardous substance. These factors may hinder market growth.

The para nitro chlorobenzene (PNCB) market research report delivers an acute valuation and taxonomy of the para nitro chlorobenzene (PNCB) industry by practically splitting the market on the basis of different types, applications, and regions. Through the analysis of the historical and projected trends, all the segments and sub-segments were evaluated through the bottom-up approach, and different market sizes have been projected for FY 2020 to FY 2026. The regional segmentation of the para nitro chlorobenzene (PNCB) industry includes the complete classification of all the major continents including North America, Latin America, Europe, Asia Pacific, and the Middle East & Africa. Further, country-wise data for the para nitro chlorobenzene (PNCB) industry is provided for the leading economies of the world.

The para nitro chlorobenzene (PNCB) market is segmented based on application. In terms of application segmentation, the market is bifurcated into agriculture, pharmaceutical, and chemicals.

logoReport Scope

Report Attribute

Details

Market Size in 2019

USD 400 Million

Projected Market Size in 2026

USD 600 Million

CAGR Growth Rate

6% CAGR

Base Year

2020

Forecast Years

2020-2026

Key Market Players

Anhui Bayi Chemical Industry Co. Ltd., Jiaxing Zhonghua Chemical Co. LTD., Liaoning Shixing Pharmaceutical & Chemical Co. Ltd., Aarti Industries Ltd, Chemieorganic Chemicals India, Seya Industries Ltd, Kutch Chemical Industries Ltd., Chemieorganic Chemicals, and others.

Key Segment

By Application, By Region

Major Regions Covered

North America, Europe, Asia Pacific, Latin America, and the Middle East & Africa

Purchase Options

Request customized purchase options to meet your research needs. Explore purchase options

logoSome of the essential players operating in the para nitro chlorobenzene (PNCB) market as follows:

  •  Kutch Chemical Industries Ltd.
  •  Chemieorganic Chemicals India
  •  Jiaxing Zhonghua Chemical Co. LTD.
  •  Liaoning Shixing Pharmaceutical & Chemical Co. Ltd.
  •  Anhui Bayi Chemical Industry Co. Ltd.
  •  Aarti Industries Ltd
  •  Seya Industries Ltd
  •  Chemieorganic Chemicals

The taxonomy of the para nitro chlorobenzene (PNCB) industry by its scope and segmentation is as follows:

logoGlobal Para Nitro Chlorobenzene (PNCB) Market: By Application Segmentation Analysis

  • Agriculture
  • Pharmaceutical
  • Chemicals

logoGlobal para nitrochlorobenzene (PNCB) Market: Regional Segmentation Analysis (Customizable)

  • North America
    • The U.S.
    • Canada
  • Europe
    • Germany
    • The UK
    • France
    • Spain
    • Italy
    • Rest of Europe
  • Asia Pacific
    • China
    • Japan
    • India
    • South Korea
    • Southeast Asia
    • Rest of Asia Pacific
  • Latin America
    • Brazil
    • Mexico
    • Rest of Latin America
  • Middle East & Africa
    • GCC
    • South Africa
    • Rest of Middle East & Africa

Table of Content

  1. CHAPTER 1. Executive Summary
  2. CHAPTER 2. Para Nitrochlorobenzene (PNCB) market – Applications Analysis
    1. 2.1. Global Para Nitrochlorobenzene (PNCB) Market – Applications Overview
    2. 2.2. Global Para Nitrochlorobenzene (PNCB) Market Share, by Applications, 2019& 2026 (USD Million)
    3. 2.3. Global Para Nitrochlorobenzene (PNCB) Market share, by Applications, 2019& 2026 (KiloTons)
    4. 2.4. Agriculture
      1. 2.4.1. Global Agriculture Para Nitrochlorobenzene (PNCB) Market, 2016-2026 (USD Million)
      2. 2.4.2. Global Agriculture Para Nitrochlorobenzene (PNCB) Market, 2016-2026 (KiloTons)
    5. 2.5. Pharmaceutical
      1. 2.5.1. Global Pharmaceutical Para Nitrochlorobenzene (PNCB) Market, 2016-2026 (USD Million)
      2. 2.5.2. Global Pharmaceutical Para Nitrochlorobenzene (PNCB) Market, 2016-2026 (KiloTons)
    6. 2.6. Chemicals
      1. 2.6.1. Global Chemicals Para Nitrochlorobenzene (PNCB) Market, 2016-2026 (USD Million)
      2. 2.6.2. Global Chemicals Para Nitrochlorobenzene (PNCB) Market, 2016-2026 (KiloTons)
  3. CHAPTER 3. Para Nitrochlorobenzene (PNCB) market – Regional Analysis
    1. 3.1. Global Para Nitrochlorobenzene (PNCB) Market Regional Overview
    2. 3.2. Global Para Nitrochlorobenzene (PNCB) Market Share, by Region, 2019& 2026 (Value)
    3. 3.3. Global Para Nitrochlorobenzene (PNCB) Market Share, by Region, 2019& 2026 (Volume)
    4. 3.4. North America
      1. 3.4.1. North America Para Nitrochlorobenzene (PNCB) Market size and forecast, 2016-2026
      2. 3.4.2. North America Para Nitrochlorobenzene (PNCB) Market, by Country, 2019- 2026 (USD Million)
      3. 3.4.3. North America Market size and forecast, 2016-2026 (KiloTons)
      4. 3.4.4. North America Para Nitrochlorobenzene (PNCB) Market, by Country, 2019- 2026 (KiloTons)
      5. 3.4.5. North America Para Nitrochlorobenzene (PNCB) Market, by Applications, 2016-2026
        1. 3.4.5.1. North America Para Nitrochlorobenzene (PNCB) Market, by Applications, 2016-2026 (USD Million)
        2. 3.4.5.2. North America Para Nitrochlorobenzene (PNCB) Market, by Applications, 2016-2026 (KiloTons)
      6. 3.4.6. U.S.
        1. 3.4.6.1. U.S. Market size and forecast, 2016-2026 (USD Million)
        2. 3.4.6.2. U.S. Market size and forecast, 2016-2026 (KiloTons)
      7. 3.4.7. Canada
        1. 3.4.7.1. Canada Market size and forecast, 2016-2026 (USD Million)
        2. 3.4.7.2. Canada Market size and forecast, 2016-2026 (KiloTons)
    5. 3.5. Europe
      1. 3.5.1. Europe Para Nitrochlorobenzene (PNCB) Market size and forecast, 2016-2026
      2. 3.5.2. Europe Para Nitrochlorobenzene (PNCB) Market, by Country, 2019- 2026 (USD Million)
      3. 3.5.3. Europe Market size and forecast, 2016-2026 (KiloTons)
      4. 3.5.4. Europe Para Nitrochlorobenzene (PNCB) Market, by Country, 2019- 2026 (KiloTons)
      5. 3.5.5. Europe Para Nitrochlorobenzene (PNCB) Market, by Applications, 2016-2026
        1. 3.5.5.1. Europe Para Nitrochlorobenzene (PNCB) Market, by Applications, 2016-2026 (USD Million)
        2. 3.5.5.2. Europe Para Nitrochlorobenzene (PNCB) Market, by Applications, 2016-2026 (KiloTons)
      6. 3.5.6. Germany
        1. 3.5.6.1. Germany Market size and forecast, 2016-2026 (USD Million)
        2. 3.5.6.2. Germany Market size and forecast, 2016-2026 (KiloTons)
      7. 3.5.7. France
        1. 3.5.7.1. France Market size and forecast, 2016-2026 (USD Million)
        2. 3.5.7.2. France Market size and forecast, 2016-2026 (KiloTons)
      8. 3.5.8. U.K.
        1. 3.5.8.1. U.K. Market size and forecast, 2016-2026 (USD Million)
        2. 3.5.8.2. U.K. Market size and forecast, 2016-2026 (KiloTons)
      9. 3.5.9. Italy
        1. 3.5.9.1. Italy Market size and forecast, 2016-2026 (USD Million)
        2. 3.5.9.2. Italy Market size and forecast, 2016-2026 (KiloTons)
      10. 3.5.10. Spain
        1. 3.5.10.1. Spain Market size and forecast, 2016-2026 (USD Million)
        2. 3.5.10.2. Spain Market size and forecast, 2016-2026 (KiloTons)
      11. 3.5.11. Rest of Europe
        1. 3.5.11.1. Rest of Europe Market size and forecast, 2016-2026 (USD Million)
        2. 3.5.11.2. Rest of Europe Market size and forecast, 2016-2026 (KiloTons)
    6. 3.6. Asia Pacific
      1. 3.6.1. Asia Pacific Para Nitrochlorobenzene (PNCB) Market size and forecast, 2016-2026
      2. 3.6.2. Asia Pacific Para Nitrochlorobenzene (PNCB) Market, by Country, 2019- 2026 (USD Million)
      3. 3.6.3. Asia Pacific Market size and forecast, 2016-2026 (KiloTons)
      4. 3.6.4. Asia Pacific Para Nitrochlorobenzene (PNCB) Market, by Country, 2019- 2026 (KiloTons)
      5. 3.6.5. Asia Pacific Para Nitrochlorobenzene (PNCB) Market, by Applications, 2016-2026
        1. 3.6.5.1. Asia Pacific Para Nitrochlorobenzene (PNCB) Market, by Applications, 2016-2026 (USD Million)
        2. 3.6.5.2. Asia Pacific Para Nitrochlorobenzene (PNCB) Market, by Applications, 2016-2026 (KiloTons)
      6. 3.6.6. China
        1. 3.6.6.1. China Market size and forecast, 2016-2026 (USD Million)
        2. 3.6.6.2. China Market size and forecast, 2016-2026 (KiloTons)
      7. 3.6.7. Japan
        1. 3.6.7.1. Japan Market size and forecast, 2016-2026 (USD Million)
        2. 3.6.7.2. Japan Market size and forecast, 2016-2026 (KiloTons)
      8. 3.6.8. India
        1. 3.6.8.1. India Market size and forecast, 2016-2026 (USD Million)
        2. 3.6.8.2. India Market size and forecast, 2016-2026 (KiloTons)
      9. 3.6.9. South Korea
        1. 3.6.9.1. South Korea Market size and forecast, 2016-2026 (USD Million)
        2. 3.6.9.2. South Korea Market size and forecast, 2016-2026 (KiloTons)
      10. 3.6.10. South-East Asia
        1. 3.6.10.1. South-East Asia Market size and forecast, 2016-2026 (USD Million)
        2. 3.6.10.2. South-East Asia Market size and forecast, 2016-2026 (KiloTons)
      11. 3.6.11. Rest of Asia Pacific
        1. 3.6.11.1. Rest of Asia Pacific Market size and forecast, 2016-2026 (USD Million)
        2. 3.6.11.2. Rest of Asia Pacific Market size and forecast, 2016-2026 (KiloTons)
    7. 3.7. Latin America
      1. 3.7.1. Latin America Para Nitrochlorobenzene (PNCB) Market size and forecast, 2016-2026
      2. 3.7.2. Latin America Para Nitrochlorobenzene (PNCB) Market, by Country, 2019- 2026 (USD Million)
      3. 3.7.3. Latin America Market size and forecast, 2016-2026 (KiloTons)
      4. 3.7.4. Latin America Para Nitrochlorobenzene (PNCB) Market, by Country, 2019- 2026 (KiloTons)
      5. 3.7.5. Latin America Para Nitrochlorobenzene (PNCB) Market, by Applications, 2016-2026
        1. 3.7.5.1. Latin America Para Nitrochlorobenzene (PNCB) Market, by Applications, 2016-2026 (USD Million)
        2. 3.7.5.2. Latin America Para Nitrochlorobenzene (PNCB) Market, by Applications, 2016-2026 (KiloTons)
      6. 3.7.6. Brazil
        1. 3.7.6.1. Brazil Market size and forecast, 2016-2026 (USD Million)
        2. 3.7.6.2. Brazil Market size and forecast, 2016-2026 (KiloTons)
      7. 3.7.7. Mexico
        1. 3.7.7.1. Mexico Market size and forecast, 2016-2026 (USD Million)
        2. 3.7.7.2. Mexico Market size and forecast, 2016-2026 (KiloTons)
      8. 3.7.8. Rest of Latin America
        1. 3.7.8.1. Rest of Latin America Market size and forecast, 2016-2026 (USD Million)
        2. 3.7.8.2. Rest of Latin America Market size and forecast, 2016-2026 (KiloTons)
    8. 3.8. The Middle-East and Africa
      1. 3.8.1. The Middle-East and Africa Para Nitrochlorobenzene (PNCB) Market size and forecast, 2016-2026
      2. 3.8.2. The Middle-East and Africa Para Nitrochlorobenzene (PNCB) Market, by Country, 2019- 2026 (USD Million)
      3. 3.8.3. The Middle-East and Africa Market size and forecast, 2016-2026 (KiloTons)
      4. 3.8.4. The Middle-East and Africa Para Nitrochlorobenzene (PNCB) Market, by Country, 2019- 2026 (KiloTons)
      5. 3.8.5. The Middle-East and Africa Para Nitrochlorobenzene (PNCB) Market, by Applications, 2016-2026
        1. 3.8.5.1. The Middle-East and Africa Para Nitrochlorobenzene (PNCB) Market, by Applications, 2016-2026 (USD Million)
        2. 3.8.5.2. The Middle-East and Africa Para Nitrochlorobenzene (PNCB) Market, by Applications, 2016-2026 (KiloTons)
      6. 3.8.6. GCC Countries
        1. 3.8.6.1. GCC Countries Market size and forecast, 2016-2026 (USD Million)
        2. 3.8.6.2. GCC Countries Market size and forecast, 2016-2026 (KiloTons)
      7. 3.8.7. South Africa
        1. 3.8.7.1. South Africa Market size and forecast, 2016-2026 (USD Million)
        2. 3.8.7.2. South Africa Market size and forecast, 2016-2026 (KiloTons)
      8. 3.8.8. Rest of Middle-East Africa
        1. 3.8.8.1. Rest of Middle-East Africa Market size and forecast, 2016-2026 (USD Million)
        2. 3.8.8.2. Rest of Middle-East Africa Market size and forecast, 2016-2026 (KiloTons)
  4. CHAPTER 4. Para Nitrochlorobenzene (PNCB) Production, Consumption, Export, Import by Regions
    1. 4.1. Global Para Nitrochlorobenzene (PNCB) production and revenue, 2016-2026 (USD Million) (KiloTons)
    2. 4.2. Global Import and Export Analysis, by Region
  5. CHAPTER 5. Para Nitrochlorobenzene (PNCB) market – Competitive Landscape
    1. 5.1. Competitor Market Share – Revenue
    2. 5.2. Market Concentration Rate Analysis, Top 3 and Top 5 Players
    3. 5.3. Competitor Market Share – Volume
    4. 5.4. Strategic Development
      1. 5.4.1. Acquisitions and Mergers
      2. 5.4.2. New Products
      3. 5.4.3. Research & Development Activities
  6. CHAPTER 6. Company Profiles
    1. 6.1. Anhui Bayi Chemical Industry Co. Ltd.
      1. 6.1.1. Company Overview
      2. 6.1.2. Anhui Bayi Chemical Industry Co. Ltd. Sales, Revenue, Price, and Gross Margin
      3. 6.1.3. Product portfolio
      4. 6.1.4. Recent initiatives
    2. 6.2. Jiaxing Zhonghua Chemical Co. LTD.
      1. 6.2.1. Company Overview
      2. 6.2.2. Jiaxing Zhonghua Chemical Co. LTD. Sales, Revenue, Price, and Gross Margin
      3. 6.2.3. Product portfolio
      4. 6.2.4. Recent initiatives
    3. 6.3. Liaoning Shixing Pharmaceutical & Chemical Co. Ltd.
      1. 6.3.1. Company Overview
      2. 6.3.2. Liaoning Shixing Pharmaceutical & Chemical Co. Ltd. Sales, Revenue, Price, and Gross Margin
      3. 6.3.3. Product portfolio
      4. 6.3.4. Recent initiatives
    4. 6.4. Aarti Industries Ltd
      1. 6.4.1. Company Overview
      2. 6.4.2. Aarti Industries Ltd Sales, Revenue, Price, and Gross Margin
      3. 6.4.3. Product portfolio
      4. 6.4.4. Recent initiatives
    5. 6.5. Chemieorganic Chemicals India
      1. 6.5.1. Company Overview
      2. 6.5.2. Chemieorganic Chemicals India Sales, Revenue, Price, and Gross Margin
      3. 6.5.3. Product portfolio
      4. 6.5.4. Recent initiatives
    6. 6.6. Seya Industries Ltd
      1. 6.6.1. Company Overview
      2. 6.6.2. Seya Industries Ltd Sales, Revenue, Price, and Gross Margin
      3. 6.6.3. Product portfolio
      4. 6.6.4. Recent initiatives
    7. 6.7. Kutch Chemical Industries Ltd.
      1. 6.7.1. Company Overview
      2. 6.7.2. Kutch Chemical Industries Ltd. Sales, Revenue, Price, and Gross Margin
      3. 6.7.3. Product portfolio
      4. 6.7.4. Recent initiatives
    8. 6.8. Chemieorganic Chemicals
      1. 6.8.1. Company Overview
      2. 6.8.2. Chemieorganic Chemicals Sales, Revenue, Price, and Gross Margin
      3. 6.8.3. Product portfolio
      4. 6.8.4. Recent initiatives
  7. CHAPTER 7. Para Nitrochlorobenzene (PNCB) — Industry Analysis
    1. 7.1. Introduction and Taxonomy
    2. 7.2. Para Nitrochlorobenzene (PNCB) Market – Key Trends
      1. 7.2.1. Market Drivers
      2. 7.2.2. Market Restraints
      3. 7.2.3. Market Opportunities
    3. 7.3. Value Chain Analysis
    4. 7.4. Key Mandates and Regulations
    5. 7.5. Technology Roadmap and Timeline
    6. 7.6. Para Nitrochlorobenzene (PNCB) market – Attractiveness Analysis
      1. 7.6.1. By Applications
      2. 7.6.2. By Region
  8. CHAPTER 8. Raw Material analysis
    1. 8.1. Para Nitrochlorobenzene (PNCB) Key Raw Material Analysis
      1. 8.1.1. Key Raw Materials
      2. 8.1.2. Price Trend of Key Raw Materials
    2. 8.2. Key Suppliers of Raw Materials
    3. 8.3. Proportion of Manufacturing Cost Structure
      1. 8.3.1. Raw Materials
      2. 8.3.2. Labor Cost
    4. 8.4. Manufacturing Expenses Analysis of Para Nitrochlorobenzene (PNCB)
  9. CHAPTER 9. Industrial Chain, Sourcing Strategy and Downstream Buyers
    1. 9.1. Para Nitrochlorobenzene (PNCB) Industrial Chain Analysis
    2. 9.2. Upstream Raw Materials Sourcing
      1. 9.2.1. Risk Mitigation:
      2. 9.2.2. Supplier Relationships:
      3. 9.2.3. Business Processes:
      4. 9.2.4. Securing the Product:
    3. 9.3. Raw Materials Sources of Para Nitrochlorobenzene (PNCB) Major Manufacturers in 2016
    4. 9.4. Downstream Buyers
    5. 9.5. Distributors/Traders List
  10. CHAPTER 10. Marketing Strategy Analysis, Distributors
    1. 10.1. Marketing Channel
    2. 10.2. Direct Marketing
    3. 10.3. Indirect Marketing
    4. 10.4. Marketing Channel Development Trend
    5. 10.5. Economic/Political Environmental Change
  11. CHAPTER 11. Report Conclusion
  12. CHAPTER 12. Research Approach & Methodology
    1. 12.1. Report Description
    2. 12.2. Research Scope
    3. 12.3. Research Methodology
      1. 12.3.1. Secondary Research
      2. 12.3.2. Primary Research
      3. 12.3.3. Models
        1. 12.3.3.1. Company Share Analysis Model
        2. 12.3.3.2. Revenue Based Modeling
        3. 12.3.3.3. Research Limitations

        List of Figures

        FIG. 1 Global Para Nitrochlorobenzene (PNCB) Market, 2016-2026 (USD Million)
        FIG. 2 Global Para Nitrochlorobenzene (PNCB) Market Share, by Applications, 2019& 2026 (USD Million)
        FIG. 3 Global Para Nitrochlorobenzene (PNCB) Market share, by Applications, 2019& 2026 (KiloTons)
        FIG. 4 Global Agriculture Para Nitrochlorobenzene (PNCB) Market, 2016-2026 (USD Million)
        FIG. 5 Global Agriculture Para Nitrochlorobenzene (PNCB)  Market, 2016-2026 (KiloTons)
        FIG. 6 Global Pharmaceutical Para Nitrochlorobenzene (PNCB) Market, 2016-2026 (USD Million)
        FIG. 7 Global Pharmaceutical Para Nitrochlorobenzene (PNCB)  Market, 2016-2026 (KiloTons)
        FIG. 8 Global Chemicals Para Nitrochlorobenzene (PNCB) Market, 2016-2026 (USD Million)
        FIG. 9 Global Chemicals Para Nitrochlorobenzene (PNCB)  Market, 2016-2026 (KiloTons)
        FIG. 10 Global Para Nitrochlorobenzene (PNCB) Market Share, by Region, 2019& 2026
        FIG. 11 Global Para Nitrochlorobenzene (PNCB) Market Share, by Region, 2019& 2026
        FIG. 12 North America Para Nitrochlorobenzene (PNCB) Market, 2016-2026
        FIG. 13 North America Para Nitrochlorobenzene (PNCB)  Market, 2016-2026 (KiloTons)
        FIG. 14 U.S. Para Nitrochlorobenzene (PNCB) Market, 2016-2026
        FIG. 15 U.S. Para Nitrochlorobenzene (PNCB)  Market, 2016-2026 (KiloTons)
        FIG. 16 Canada Para Nitrochlorobenzene (PNCB) Market, 2016-2026
        FIG. 17 Canada Para Nitrochlorobenzene (PNCB)  Market, 2016-2026 (KiloTons)
        FIG. 18 Europe Para Nitrochlorobenzene (PNCB) Market, 2016-2026
        FIG. 19 Europe Para Nitrochlorobenzene (PNCB)  Market, 2016-2026 (KiloTons)
        FIG. 20 Germany Para Nitrochlorobenzene (PNCB) Market, 2016-2026
        FIG. 21 Germany Para Nitrochlorobenzene (PNCB)  Market, 2016-2026 (KiloTons)
        FIG. 22 France Para Nitrochlorobenzene (PNCB) Market, 2016-2026
        FIG. 23 France Para Nitrochlorobenzene (PNCB)  Market, 2016-2026 (KiloTons)
        FIG. 24 U.K. Para Nitrochlorobenzene (PNCB) Market, 2016-2026
        FIG. 25 U.K. Para Nitrochlorobenzene (PNCB)  Market, 2016-2026 (KiloTons)
        FIG. 26 Italy Para Nitrochlorobenzene (PNCB) Market, 2016-2026
        FIG. 27 Italy Para Nitrochlorobenzene (PNCB)  Market, 2016-2026 (KiloTons)
        FIG. 28 Spain Para Nitrochlorobenzene (PNCB) Market, 2016-2026
        FIG. 29 Spain Para Nitrochlorobenzene (PNCB)  Market, 2016-2026 (KiloTons)
        FIG. 30 Rest of Europe Para Nitrochlorobenzene (PNCB) Market, 2016-2026
        FIG. 31 Rest of Europe Para Nitrochlorobenzene (PNCB)  Market, 2016-2026 (KiloTons)
        FIG. 32 Asia Pacific Para Nitrochlorobenzene (PNCB) Market, 2016-2026
        FIG. 33 Asia Pacific Para Nitrochlorobenzene (PNCB)  Market, 2016-2026 (KiloTons)
        FIG. 34 China Para Nitrochlorobenzene (PNCB) Market, 2016-2026
        FIG. 35 China Para Nitrochlorobenzene (PNCB)  Market, 2016-2026 (KiloTons)
        FIG. 36 Japan Para Nitrochlorobenzene (PNCB) Market, 2016-2026
        FIG. 37 Japan Para Nitrochlorobenzene (PNCB)  Market, 2016-2026 (KiloTons)
        FIG. 38 India Para Nitrochlorobenzene (PNCB) Market, 2016-2026
        FIG. 39 India Para Nitrochlorobenzene (PNCB)  Market, 2016-2026 (KiloTons)
        FIG. 40 South  Korea Para Nitrochlorobenzene (PNCB) Market, 2016-2026
        FIG. 41 South  Korea Para Nitrochlorobenzene (PNCB)  Market, 2016-2026 (KiloTons)
        FIG. 42 South-East Asia Para Nitrochlorobenzene (PNCB) Market, 2016-2026
        FIG. 43 South-East Asia Para Nitrochlorobenzene (PNCB)  Market, 2016-2026 (KiloTons)
        FIG. 44 Rest of Asia Pacific Para Nitrochlorobenzene (PNCB) Market, 2016-2026
        FIG. 45 Rest of Asia Pacific Para Nitrochlorobenzene (PNCB)  Market, 2016-2026 (KiloTons)
        FIG. 46 Latin America Para Nitrochlorobenzene (PNCB) Market, 2016-2026
        FIG. 47 Latin America Para Nitrochlorobenzene (PNCB)  Market, 2016-2026 (KiloTons)
        FIG. 48 Brazil Para Nitrochlorobenzene (PNCB) Market, 2016-2026
        FIG. 49 Brazil Para Nitrochlorobenzene (PNCB)  Market, 2016-2026 (KiloTons)
        FIG. 50 Mexico Para Nitrochlorobenzene (PNCB) Market, 2016-2026
        FIG. 51 Mexico Para Nitrochlorobenzene (PNCB)  Market, 2016-2026 (KiloTons)
        FIG. 52 Rest of Latin America Para Nitrochlorobenzene (PNCB) Market, 2016-2026
        FIG. 53 Rest of Latin America Para Nitrochlorobenzene (PNCB)  Market, 2016-2026 (KiloTons)
        FIG. 54 The Middle-East and Africa Para Nitrochlorobenzene (PNCB) Market, 2016-2026
        FIG. 55 The Middle-East and Africa Para Nitrochlorobenzene (PNCB)  Market, 2016-2026 (KiloTons)
        FIG. 56 GCC Countries Para Nitrochlorobenzene (PNCB) Market, 2016-2026
        FIG. 57 GCC Countries Para Nitrochlorobenzene (PNCB)  Market, 2016-2026 (KiloTons)
        FIG. 58 South Africa Para Nitrochlorobenzene (PNCB) Market, 2016-2026
        FIG. 59 South Africa Para Nitrochlorobenzene (PNCB)  Market, 2016-2026 (KiloTons)
        FIG. 60 Rest of Middle-East Africa Para Nitrochlorobenzene (PNCB) Market, 2016-2026
        FIG. 61 Rest of Middle-East Africa Para Nitrochlorobenzene (PNCB)  Market, 2016-2026 (KiloTons)
        FIG. 62 Global Para Nitrochlorobenzene (PNCB) production and revenue, 2016-2026 (USD Million) (KiloTons)
        FIG. 63 North America Para Nitrochlorobenzene (PNCB) production and revenue, 2016-2026 (USD Million) (KiloTons)
        FIG. 64 Europe Para Nitrochlorobenzene (PNCB) production and revenue, 2016-2026 (USD Million) (KiloTons)
        FIG. 65 Asia Pacific Para Nitrochlorobenzene (PNCB) production and revenue, 2016-2026 (USD Million) (KiloTons)
        FIG. 66 Latin America Para Nitrochlorobenzene (PNCB) production and revenue, 2016-2026 (USD Million) (KiloTons)
        FIG. 67 Middle East and Africa Para Nitrochlorobenzene (PNCB) production and revenue, 2016-2026 (USD Million) (KiloTons)
        FIG. 68 Competitor Market Share – Revenue
        FIG. 69 Competitor Market Share – Volume
        FIG. 70 Anhui Bayi Chemical Industry Co. Ltd. Revenue and Growth Rate
        FIG. 71 Anhui Bayi Chemical Industry Co. Ltd. Market Share
        FIG. 72 Jiaxing Zhonghua Chemical Co. LTD. Revenue and Growth Rate
        FIG. 73 Jiaxing Zhonghua Chemical Co. LTD. Market Share
        FIG. 74 Liaoning Shixing Pharmaceutical & Chemical Co. Ltd. Revenue and Growth Rate
        FIG. 75 Liaoning Shixing Pharmaceutical & Chemical Co. Ltd. Market Share
        FIG. 76 Aarti Industries Ltd Revenue and Growth Rate
        FIG. 77 Aarti Industries Ltd Market Share
        FIG. 78 Chemieorganic Chemicals India Revenue and Growth Rate
        FIG. 79 Chemieorganic Chemicals India Market Share
        FIG. 80 Seya Industries Ltd Revenue and Growth Rate
        FIG. 81 Seya Industries Ltd Market Share
        FIG. 82 Kutch Chemical Industries Ltd. Revenue and Growth Rate
        FIG. 83 Kutch Chemical Industries Ltd. Market Share
        FIG. 84 Chemieorganic Chemicals Revenue and Growth Rate
        FIG. 85 Chemieorganic Chemicals Market Share
        FIG. 86 Market Dynamics
        FIG. 87 Global Para Nitrochlorobenzene (PNCB) – Value Chain Analysis
        FIG. 88 Key Mandates and Regulations
        FIG. 89 Technology Roadmap and Timeline
        FIG. 90 Market Attractiveness Analysis – By Applications
        FIG. 91 Market Attractiveness Analysis – By Region
        FIG. 92 Manufacturing Cost Structure of Para Nitrochlorobenzene (PNCB)
        FIG. 93 Para Nitrochlorobenzene (PNCB) Industrial Chain Analysis
        FIG. 94 Market Channel
        FIG. 95 Marketing Channel Development Trend
        FIG. 96 Growth in World Gross Product, 2008-2018

        List of Tables

        TABLE 1 Global Para Nitrochlorobenzene (PNCB) market, 2019& 2026 (USD Million)
        TABLE 2 Global Para Nitrochlorobenzene (PNCB) market, by Applications, 2016-2026 (USD Million)
        TABLE 3 Global Para Nitrochlorobenzene (PNCB) market, by Applications, 2016-2026 (KiloTons)
        TABLE 4 Global Para Nitrochlorobenzene (PNCB) market, by region, 2016-2026 (USD Million)
        TABLE 5 Global Para Nitrochlorobenzene (PNCB) market, by region, 2016-2026 (KiloTons)
        TABLE 6 North America Para Nitrochlorobenzene (PNCB) Market, by Applications, 2016-2026 (USD Million)
        TABLE 7 North America Para Nitrochlorobenzene (PNCB) Market, by Applications, 2016-2026 (KiloTons)
        TABLE 8 Europe Para Nitrochlorobenzene (PNCB) Market, by Applications, 2016-2026 (USD Million)
        TABLE 9 Europe Para Nitrochlorobenzene (PNCB) Market, by Applications, 2016-2026 (KiloTons)
        TABLE 10 Asia Pacific Para Nitrochlorobenzene (PNCB) Market, by Applications, 2016-2026 (USD Million)
        TABLE 11 Asia Pacific Para Nitrochlorobenzene (PNCB) Market, by Applications, 2016-2026 (KiloTons)
        TABLE 12 Latin America Para Nitrochlorobenzene (PNCB) Market, by Applications, 2016-2026 (USD Million)
        TABLE 13 Latin America Para Nitrochlorobenzene (PNCB) Market, by Applications, 2016-2026 (KiloTons)
        TABLE 14 The Middle-East and Africa Para Nitrochlorobenzene (PNCB) Market, by Applications, 2016-2026 (USD Million)
        TABLE 15 The Middle-East and Africa Para Nitrochlorobenzene (PNCB) Market, by Applications, 2016-2026 (KiloTons)
        TABLE 16 North America Para Nitrochlorobenzene (PNCB) Production, Consumption, Export, Import, 2016-2018
        TABLE 17 Europe Para Nitrochlorobenzene (PNCB) Production, Consumption, Export, Import, 2016-2018
        TABLE 18 Asia Pacific Para Nitrochlorobenzene (PNCB) Production, Consumption, Export, Import, 2016-2018
        TABLE 19 Latin America Para Nitrochlorobenzene (PNCB) Production, Consumption, Export, Import, 2016-2018
        TABLE 20 Middle East & Africa Para Nitrochlorobenzene (PNCB) Production, Consumption, Export, Import, 2016-2018
        TABLE 21 Global Para Nitrochlorobenzene (PNCB) Market - Company Revenue Analysis 2016-2019(USD Million)
        TABLE 22 Global Para Nitrochlorobenzene (PNCB) Market - Company Revenue Share Analysis 2016-2018(%)
        TABLE 23 Global Para Nitrochlorobenzene (PNCB) Market - Company Volume Analysis 2016-2019(KiloTons)
        TABLE 24 Global Para Nitrochlorobenzene (PNCB) Market - Company Volume Share Analysis 2016-2018(%)
        TABLE 25 Acquisitions and Mergers
        TABLE 26 New Product/Service Launch
        TABLE 27 Research & Development Activities
        TABLE 28 Market Drivers
        TABLE 29 Market Restraints
        TABLE 30 Market Opportunities
        TABLE 31 Production Base and Market Concentration Rate of Raw Material
        TABLE 32 Key Suppliers of Raw Materials
        TABLE 33 Raw Materials Sources of Para Nitrochlorobenzene (PNCB) Major Manufacturers in 2016
        TABLE 34 Major Buyers of Para Nitrochlorobenzene (PNCB)
        TABLE 35 Distributors/Traders of Para Nitrochlorobenzene (PNCB) by Region
        

Industry Major Market Players

  •  Kutch Chemical Industries Ltd.
  •  Chemieorganic Chemicals India
  •  Jiaxing Zhonghua Chemical Co. LTD.
  •  Liaoning Shixing Pharmaceutical & Chemical Co. Ltd.
  •  Anhui Bayi Chemical Industry Co. Ltd.
  •  Aarti Industries Ltd
  •  Seya Industries Ltd
  •  Chemieorganic Chemicals