Search Market Research Report

Discover Our Latest Reports
Discover Our Featured Reports
Discover Top Selling Reports

Paper Straw Market Size, Share Global Analysis Report, 2021 – 2026

report img

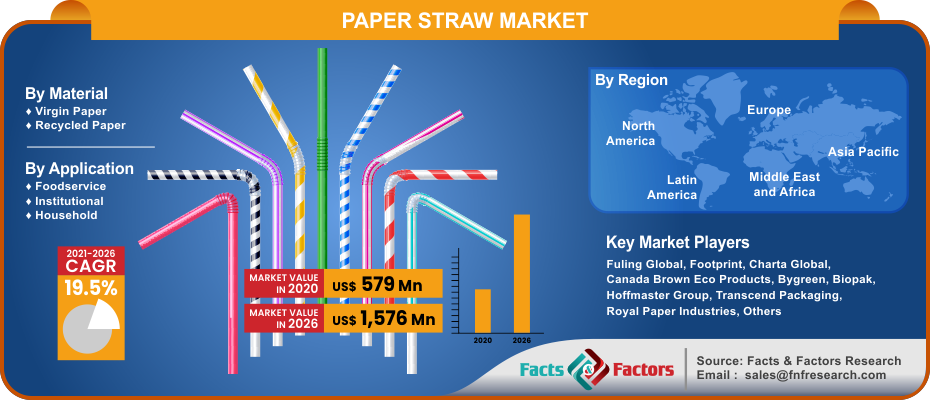
Paper Straw Market By Material (Virgin Paper & Recycled Paper), By Application (Foodservice, Institutional, & Household), And By Regions - Global & Regional Industry Perspective, Comprehensive Analysis, and Forecast 2021 – 2026

Industry Insights

[203+ Pages Report] The latest finding surrounding the “Global Paper Straw Market” published by Facts & Factors offers a neatly packaged and comprehensive read. In this report, the global paper straw market surrounding paper straw will reach a projected value of USD 1,576 Million by 2026 growing at a CAGR of 19.5% from an initial value of USD 579 Million in the year 2020.

logoMarket Overview

Paper straws are small pipes that often aid a user in consuming a compatible liquid in a more livid and convenient fashion. The main source of production of these straws is paper and oftentimes they are completely degradable. The current generation of paper straws is often recyclable and is gaining popularity due to the ability to be completely degraded within 2-6 weeks of the beginning of the cycle. Piles of papers are stacked atop each other and then mixed with a dash of water-based adhesive by a slot nozzle machine which gives the final shape to the product.

logoIndustry Growth Factors

The primary driving forces behind the significant rise of the global paper straw market are the rising applications in the foodservice sector and institutional services coupled with rising consumer demand for environmental-friendly straws to name a few. Additionally, factors such as the increasing number of government-based reforms aiding ban plastic straws coupled with increasing intolerance of consumers towards plastic straws will increase the footprint of the global paper straw market during the advent of the forecast period. Moreover, increasing sustainable targets coupled with significant demand from the food and beverage sector will boost the growth of the global paper straw market during the advent of the forecast period.

The global paper straw market is driven by the rapid development of technologies for excessive production methods coupled with the rising number of food wagons, catering services, and food stalls to name a few. The emergence of online food delivery platforms will further accelerate the growth of the global paper straw market due to increased integration to name a few. However, a higher cost of paper straws and a tangent taste accompanied with extended usage will hamper the growth of the global paper straw market during the advent of the forecast period.

Paper Straw Market

To know more about this report | Request Free Sample Copy

logoSegmentation Analysis

The global paper straw market is segmented into material, application, and region.

On the basis of material, the global paper straw market is divided into virgin paper and recycled paper. The virgin paper segment is expected to witness the largest market share during the advent of the forecast period owing to increased adoption owing to eco-friendly alternatives coupled with increased increments for putting a ban on plastic straws to name a few. Additionally, factors such as increased reliability and increased absorbency rates will cement the dominant market position of the latter during the forecast period. On the basis of application, the global paper straw market can be broken down into food service,

institutional, and household. The segment pertaining to food service is expected to witness the largest market share during the advent of the forecast period owing to rising products pertaining to single-use disposable measures coupled with increasing steps taken toward sustainability to name a few.

logo Report Scope

Report Attribute

Details

Market Size in 2020

USD 579 Million

Projected Market Size in 2026

USD 1,576 Million

CAGR Growth Rate

19.5% CAGR

Base Year

2020

Forecast Years

2021-2026

Key Market Players

Fuling Global, Footprint, Charta Global, Canada Brown Eco Products, Bygreen, Biopak, Hoffmaster Group, Transcend Packaging, Royal Paper Industries,Huhtamaki OYJ, Tetra Pak, Hello Straw, Nippon Paper Group, Soton Daily Necessity Co. Ltd, and Shenzhen Grizzlies Industries Co. Ltd, and Others

Key Segments

Material, Applications, and Region

Major Regions Covered

North America, Europe, Asia Pacific, Latin America, and Middle East & Africa

Purchase Options

Request customized purchase options to meet your research needs. Explore purchase options

logo Regional Analysis

The region of Europe is expected to witness the fastest growing CAGR during the advent of the forecast period owing to rising demand for paper straws from emerging economies such as Germany and the United Kingdom coupled with rising popularity from the European foodservice industry to name a few. Additionally, the increasing effect of environmental and government-based regulations and reforms pertaining to plastic straw bans will increase the footprint of the paper straw market in the region to a large extent. The region of Asia-Pacific will witness a substantial market share during the advent of the forecast period owing to rising government-based bans on plastic straws coupled with rising product awareness to name a few.

logo Competitive Players

  • Fuling Global
  • Footprint
  • Charta Global
  • Canada Brown Eco Products
  • Bygreen
  • Biopak
  • Hoffmaster Group
  • Transcend Packaging
  • Royal Paper Industries
  • Huhtamaki OYJ
  • Tetra Pak
  • Hello Straw
  • Nippon Paper Group
  • Soton Daily Necessity Co. Ltd
  • Shenzhen Grizzlies Industries Co. Ltd

logo By Material Segment Analysis

  • Virgin Paper
  • Recycled Paper

logo By Application Segment Analysis

  • Foodservice
  • Institutional
  • Household

logo By Regional Segment Analysis

  • North America
    • U.S.
    • Canada
  • Europe
    • UK
    • France
    • Germany
    • Italy
    • Spain
    • Rest of Europe
  • Asia Pacific
    • China
    • Japan
    • India
    • South Korea
    • Southeast Asia
    • Rest of Asia Pacific
  • Latin America
    • Brazil
    • Mexico
    • Rest of Latin America
  • Middle East and Africa
    • GCC Countries
    • South Africa
    • Rest of MEA

Table of Content

  1. Chapter 1 Executive Summary
    1. 1.1. Introduction of Paper Straw
    2. 1.2. Global Paper Straw Market, 2019 & 2026 (USD Million)
    3. 1.3. Global Paper Straw Market, 2016 – 2026 (USD Million)
    4. 1.4. Global Paper Straw Market Absolute Revenue Opportunity, 2016 – 2026 (USD Million)
    5. 1.5. Global Paper Straw Market Incremental Revenue Opportunity, 2020 – 2026 (USD Million)
  2. Chapter 2 Paper Straw Market – Material Analysis
    1. 2.1. Global Paper Straw Market – Material Overview
    2. 2.2. Global Paper Straw Market Share, by Material, 2019 & 2026 (USD Million)
    3. 2.3. Virgin Paper
      1. 2.3.1. Global Virgin Paper Paper Straw Market, 2016 – 2026 (USD Million)
    4. 2.4. Recycled Paper
      1. 2.4.1. Global Recycled Paper Paper Straw Market, 2016 – 2026 (USD Million)
  3. Chapter 3 Paper Straw Market – Application Analysis
    1. 3.1. Global Paper Straw Market – Application Overview
    2. 3.2. Global Paper Straw Market Share, by Application, 2019 & 2026 (USD Million)
    3. 3.3. Foodservice
      1. 3.3.1. Global Foodservice Paper Straw Market, 2016 – 2026 (USD Million)
    4. 3.4. Institutional
      1. 3.4.1. Global Institutional Paper Straw Market, 2016 – 2026 (USD Million)
    5. 3.5. Household
      1. 3.5.1. Global Household Paper Straw Market, 2016 – 2026 (USD Million)
  4. Chapter 4 Paper Straw Market – Regional Analysis
    1. 4.1. Global Paper Straw Market Regional Overview
    2. 4.2. Global Paper Straw Market Share, by Region, 2019 & 2026 (USD Million)
    3. 4.3. North America
      1. 4.3.1. North America Paper Straw Market, 2016 – 2026 (USD Million)
        1. 4.3.1.1. North America Paper Straw Market, by Country, 2016 - 2026 (USD Million)
      2. 4.3.2. North America Paper Straw Market, by Material, 2016 – 2026
        1. 4.3.2.1. North America Paper Straw Market, by Material, 2016 – 2026 (USD Million)
      3. 4.3.3. North America Paper Straw Market, by Application, 2016 – 2026
        1. 4.3.3.1. North America Paper Straw Market, by Application, 2016 – 2026 (USD Million)
      4. 4.3.4. U.S.
        1. 4.3.4.1. U.S. Paper Straw Market, 2016 – 2026 (USD Million)
      5. 4.3.5. Canada
        1. 4.3.5.1. Canada Paper Straw Market, 2016 – 2026 (USD Million)
    4. 4.4. Europe
      1. 4.4.1. Europe Paper Straw Market, 2016 – 2026 (USD Million)
        1. 4.4.1.1. Europe Paper Straw Market, by Country, 2016 - 2026 (USD Million)
      2. 4.4.2. Europe Paper Straw Market, by Material, 2016 – 2026
        1. 4.4.2.1. Europe Paper Straw Market, by Material, 2016 – 2026 (USD Million)
      3. 4.4.3. Europe Paper Straw Market, by Application, 2016 – 2026
        1. 4.4.3.1. Europe Paper Straw Market, by Application, 2016 – 2026 (USD Million)
      4. 4.4.4. Germany
        1. 4.4.4.1. Germany Paper Straw Market, 2016 – 2026 (USD Million)
      5. 4.4.5. France
        1. 4.4.5.1. France Paper Straw Market, 2016 – 2026 (USD Million)
      6. 4.4.6. U.K.
        1. 4.4.6.1. U.K. Paper Straw Market, 2016 – 2026 (USD Million)
      7. 4.4.7. Italy
        1. 4.4.7.1. Italy Paper Straw Market, 2016 – 2026 (USD Million)
      8. 4.4.8. Spain
        1. 4.4.8.1. Spain Paper Straw Market, 2016 – 2026 (USD Million)
      9. 4.4.9. Rest of Europe
        1. 4.4.9.1. Rest of Europe Paper Straw Market, 2016 – 2026 (USD Million)
    5. 4.5. Asia Pacific
      1. 4.5.1. Asia Pacific Paper Straw Market, 2016 – 2026 (USD Million)
        1. 4.5.1.1. Asia Pacific Paper Straw Market, by Country, 2016 - 2026 (USD Million)
      2. 4.5.2. Asia Pacific Paper Straw Market, by Material, 2016 – 2026
        1. 4.5.2.1. Asia Pacific Paper Straw Market, by Material, 2016 – 2026 (USD Million)
      3. 4.5.3. Asia Pacific Paper Straw Market, by Application, 2016 – 2026
        1. 4.5.3.1. Asia Pacific Paper Straw Market, by Application, 2016 – 2026 (USD Million)
      4. 4.5.4. China
        1. 4.5.4.1. China Paper Straw Market, 2016 – 2026 (USD Million)
      5. 4.5.5. Japan
        1. 4.5.5.1. Japan Paper Straw Market, 2016 – 2026 (USD Million)
      6. 4.5.6. India
        1. 4.5.6.1. India Paper Straw Market, 2016 – 2026 (USD Million)
      7. 4.5.7. South Korea
        1. 4.5.7.1. South Korea Paper Straw Market, 2016 – 2026 (USD Million)
      8. 4.5.8. South-East Asia
        1. 4.5.8.1. South-East Asia Paper Straw Market, 2016 – 2026 (USD Million)
      9. 4.5.9. Rest of Asia Pacific
        1. 4.5.9.1. Rest of Asia Pacific Paper Straw Market, 2016 – 2026 (USD Million)
    6. 4.6. Latin America
      1. 4.6.1. Latin America Paper Straw Market, 2016 – 2026 (USD Million)
        1. 4.6.1.1. Latin America Paper Straw Market, by Country, 2016 - 2026 (USD Million)
      2. 4.6.2. Latin America Paper Straw Market, by Material, 2016 – 2026
        1. 4.6.2.1. Latin America Paper Straw Market, by Material, 2016 – 2026 (USD Million)
      3. 4.6.3. Latin America Paper Straw Market, by Application, 2016 – 2026
        1. 4.6.3.1. Latin America Paper Straw Market, by Application, 2016 – 2026 (USD Million)
      4. 4.6.4. Brazil
        1. 4.6.4.1. Brazil Paper Straw Market, 2016 – 2026 (USD Million)
      5. 4.6.5. Mexico
        1. 4.6.5.1. Mexico Paper Straw Market, 2016 – 2026 (USD Million)
      6. 4.6.6. Rest of Latin America
        1. 4.6.6.1. Rest of Latin America Paper Straw Market, 2016 – 2026 (USD Million)
    7. 4.7. The Middle-East and Africa
      1. 4.7.1. The Middle-East and Africa Paper Straw Market, 2016 – 2026 (USD Million)
        1. 4.7.1.1. The Middle-East and Africa Paper Straw Market, by Country, 2016 - 2026 (USD Million)
      2. 4.7.2. The Middle-East and Africa Paper Straw Market, by Material, 2016 – 2026
        1. 4.7.2.1. The Middle-East and Africa Paper Straw Market, by Material, 2016 – 2026 (USD Million)
      3. 4.7.3. The Middle-East and Africa Paper Straw Market, by Application, 2016 – 2026
        1. 4.7.3.1. The Middle-East and Africa Paper Straw Market, by Application, 2016 – 2026 (USD Million)
      4. 4.7.4. GCC Countries
        1. 4.7.4.1. GCC Countries Paper Straw Market, 2016 – 2026 (USD Million)
      5. 4.7.5. South Africa
        1. 4.7.5.1. South Africa Paper Straw Market, 2016 – 2026 (USD Million)
      6. 4.7.6. Rest of Middle-East Africa
        1. 4.7.6.1. Rest of Middle-East Africa Paper Straw Market, 2016 – 2026 (USD Million)
  5. Chapter 5 Paper Straw Market – Competitive Landscape
    1. 5.1. Competitor Market Share – Revenue
    2. 5.2. Market Concentration Rate Analysis, Top 3 and Top 5 Players
    3. 5.3. Strategic Developments
      1. 5.3.1. Acquisitions and Mergers
      2. 5.3.2. New Products
      3. 5.3.3. Research & Development Activities
  6. Chapter 6 Company Profiles
    1. 6.1. Fuling Global
      1. 6.1.1. Company Overview
      2. 6.1.2. Product/Service Portfolio
      3. 6.1.3. Fuling Global Sales, Revenue, and Gross Margin
      4. 6.1.4. Fuling Global Revenue and Growth Rate
      5. 6.1.5. Fuling Global Market Share
      6. 6.1.6. Recent Initiatives, Funding/VC Activities, and Technological Innovations
    2. 6.2. Footprint
      1. 6.2.1. Company Overview
      2. 6.2.2. Product/Service Portfolio
      3. 6.2.3. Footprint Sales, Revenue, and Gross Margin
      4. 6.2.4. Footprint Revenue and Growth Rate
      5. 6.2.5. Footprint Market Share
      6. 6.2.6. Recent Initiatives, Funding/VC Activities, and Technological Innovations
    3. 6.3. Charta Global
      1. 6.3.1. Company Overview
      2. 6.3.2. Product/Service Portfolio
      3. 6.3.3. Charta Global Sales, Revenue, and Gross Margin
      4. 6.3.4. Charta Global Revenue and Growth Rate
      5. 6.3.5. Charta Global Market Share
      6. 6.3.6. Recent Initiatives, Funding/VC Activities, and Technological Innovations
    4. 6.4. Canada Brown Eco Products
      1. 6.4.1. Company Overview
      2. 6.4.2. Product/Service Portfolio
      3. 6.4.3. Canada Brown Eco Products Sales, Revenue, and Gross Margin
      4. 6.4.4. Canada Brown Eco Products Revenue and Growth Rate
      5. 6.4.5. Canada Brown Eco Products Market Share
      6. 6.4.6. Recent Initiatives, Funding/VC Activities, and Technological Innovations
    5. 6.5. Bygreen
      1. 6.5.1. Company Overview
      2. 6.5.2. Product/Service Portfolio
      3. 6.5.3. Bygreen Sales, Revenue, and Gross Margin
      4. 6.5.4. Bygreen Revenue and Growth Rate
      5. 6.5.5. Bygreen Market Share
      6. 6.5.6. Recent Initiatives, Funding/VC Activities, and Technological Innovations
    6. 6.6. Biopak
      1. 6.6.1. Company Overview
      2. 6.6.2. Product/Service Portfolio
      3. 6.6.3. Biopak Sales, Revenue, and Gross Margin
      4. 6.6.4. Biopak Revenue and Growth Rate
      5. 6.6.5. Biopak Market Share
      6. 6.6.6. Recent Initiatives, Funding/VC Activities, and Technological Innovations
    7. 6.7. Hoffmaster Group
      1. 6.7.1. Company Overview
      2. 6.7.2. Product/Service Portfolio
      3. 6.7.3. Hoffmaster Group Sales, Revenue, and Gross Margin
      4. 6.7.4. Hoffmaster Group Revenue and Growth Rate
      5. 6.7.5. Hoffmaster Group Market Share
      6. 6.7.6. Recent Initiatives, Funding/VC Activities, and Technological Innovations
    8. 6.8. Transcend Packaging
      1. 6.8.1. Company Overview
      2. 6.8.2. Product/Service Portfolio
      3. 6.8.3. Transcend Packaging Sales, Revenue, and Gross Margin
      4. 6.8.4. Transcend Packaging Revenue and Growth Rate
      5. 6.8.5. Transcend Packaging Market Share
      6. 6.8.6. Recent Initiatives, Funding/VC Activities, and Technological Innovations
    9. 6.9. Royal Paper Industries
      1. 6.9.1. Company Overview
      2. 6.9.2. Product/Service Portfolio
      3. 6.9.3. Royal Paper Industries Sales, Revenue, and Gross Margin
      4. 6.9.4. Royal Paper Industries Revenue and Growth Rate
      5. 6.9.5. Royal Paper Industries Market Share
      6. 6.9.6. Recent Initiatives, Funding/VC Activities, and Technological Innovations
    10. 6.10. Huhtamaki OYJ
      1. 6.10.1. Company Overview
      2. 6.10.2. Product/Service Portfolio
      3. 6.10.3. Huhtamaki OYJ Sales, Revenue, and Gross Margin
      4. 6.10.4. Huhtamaki OYJ Revenue and Growth Rate
      5. 6.10.5. Huhtamaki OYJ Market Share
      6. 6.10.6. Recent Initiatives, Funding/VC Activities, and Technological Innovations
    11. 6.11. Tetra Pak
      1. 6.11.1. Company Overview
      2. 6.11.2. Product/Service Portfolio
      3. 6.11.3. Tetra Pak Sales, Revenue, and Gross Margin
      4. 6.11.4. Tetra Pak Revenue and Growth Rate
      5. 6.11.5. Tetra Pak Market Share
      6. 6.11.6. Recent Initiatives, Funding/VC Activities, and Technological Innovations
    12. 6.12. Hello Straw
      1. 6.12.1. Company Overview
      2. 6.12.2. Product/Service Portfolio
      3. 6.12.3. Hello Straw Sales, Revenue, and Gross Margin
      4. 6.12.4. Hello Straw Revenue and Growth Rate
      5. 6.12.5. Hello Straw Market Share
      6. 6.12.6. Recent Initiatives, Funding/VC Activities, and Technological Innovations
    13. 6.13. Nippon Paper Group
      1. 6.13.1. Company Overview
      2. 6.13.2. Product/Service Portfolio
      3. 6.13.3. Nippon Paper Group Sales, Revenue, and Gross Margin
      4. 6.13.4. Nippon Paper Group Revenue and Growth Rate
      5. 6.13.5. Nippon Paper Group Market Share
      6. 6.13.6. Recent Initiatives, Funding/VC Activities, and Technological Innovations
    14. 6.14. Soton Daily Necessity Co. Ltd
      1. 6.14.1. Company Overview
      2. 6.14.2. Product/Service Portfolio
      3. 6.14.3. Soton Daily Necessity Co. Ltd Sales, Revenue, and Gross Margin
      4. 6.14.4. Soton Daily Necessity Co. Ltd Revenue and Growth Rate
      5. 6.14.5. Soton Daily Necessity Co. Ltd Market Share
      6. 6.14.6. Recent Initiatives, Funding/VC Activities, and Technological Innovations
    15. 6.15. Shenzhen Grizzlies Industries Co. Ltd
      1. 6.15.1. Company Overview
      2. 6.15.2. Product/Service Portfolio
      3. 6.15.3. Shenzhen Grizzlies Industries Co. Ltd Sales, Revenue, and Gross Margin
      4. 6.15.4. Shenzhen Grizzlies Industries Co. Ltd Revenue and Growth Rate
      5. 6.15.5. Shenzhen Grizzlies Industries Co. Ltd Market Share
      6. 6.15.6. Recent Initiatives, Funding/VC Activities, and Technological Innovations
  7. Chapter 7 Paper Straw — Industry Analysis
    1. 7.1. Introduction and Taxonomy
    2. 7.2. Paper Straw Market – Key Trends
      1. 7.2.1. Market Drivers
      2. 7.2.2. Market Restraints
      3. 7.2.3. Market Opportunities
    3. 7.3. Value Chain Analysis
    4. 7.4. Key Mandates and Regulations
    5. 7.5. Technology Roadmap and Timeline
    6. 7.6. Paper Straw Market – Attractiveness Analysis
      1. 7.6.1. By Material
      2. 7.6.2. By Application
      3. 7.6.3. By Region
  8. Chapter 8 Industrial Chain, Sourcing Strategy, and Downstream Buyers
    1. 8.1. Paper Straw Industrial Chain Analysis
    2. 8.2. Downstream Buyers
    3. 8.3. Distributors/Traders List
  9. Chapter 9 Marketing Strategy Analysis
    1. 9.1. Marketing Channel
    2. 9.2. Direct Marketing
    3. 9.3. Indirect Marketing
    4. 9.4. Marketing Channel Development Trends
    5. 9.5. Economic/Political Environmental Change
  10. Chapter 10 Report Conclusion & Key Insights
    1. 10.1. Key Insights from Primary Interviews & Surveys Respondents
    2. 10.2. Key Takeaways from Analysts, Consultants, and Industry Leaders
  11. Chapter 11 Research Approach & Methodology
    1. 11.1. Report Description
    2. 11.2. Research Scope
    3. 11.3. Research Methodology
      1. 11.3.1. Secondary Research
      2. 11.3.2. Primary Research
      3. 11.3.3. Statistical Models
        1. 11.3.3.1. Company Share Analysis Model
        2. 11.3.3.2. Revenue Based Modeling
      4. 11.3.4. Research Limitations

      List of Figures

      Fig.1	Product Picture of Paper Straw
      Fig.2	Global Paper Straw Market, 2016 – 2026 (USD Million)
      Fig.3	Global Paper Straw Market Absolute Revenue Opportunity, 2016 – 2026 (USD Million)
      Fig.4	Global Paper Straw Market Incremental Revenue Opportunity, 2020 – 2026 (USD Million)
      Fig.5	Global Paper Straw Market Share, by Material, 2019 & 2026 (USD Million)
      Fig.6	Global Virgin Paper  Paper Straw Market, 2016 – 2026 (USD Million)
      Fig.7	Global Recycled Paper Paper Straw Market, 2016 – 2026 (USD Million)
      Fig.8	Global Paper Straw Market Share, by Application, 2019 & 2026 (USD Million)
      Fig.9	Global Foodservice  Paper Straw Market, 2016 – 2026 (USD Million)
      Fig.10	Global Institutional Paper Straw Market, 2016 – 2026 (USD Million)
      Fig.11	Global Household Paper Straw Market, 2016 – 2026 (USD Million)
      Fig.12	Global Paper Straw Market Share, by Region, 2019 & 2026 (USD Million)
      Fig.13	North America Paper Straw Market, 2016 – 2026 (USD Million)
      Fig.14	U.S. Paper Straw Market, 2016 – 2026 (USD Million)
      Fig.15	Canada Paper Straw Market, 2016 – 2026 (USD Million)
      Fig.16	Europe Paper Straw Market, 2016 – 2026 (USD Million)
      Fig.17	Germany Paper Straw Market, 2016 – 2026 (USD Million)
      Fig.18	France Paper Straw Market, 2016 – 2026 (USD Million)
      Fig.19	U.K. Paper Straw Market, 2016 – 2026 (USD Million)
      Fig.20	Italy Paper Straw Market, 2016 – 2026 (USD Million)
      Fig.21	Spain Paper Straw Market, 2016 – 2026 (USD Million)
      Fig.22	Rest of Europe Paper Straw Market, 2016 – 2026 (USD Million)
      Fig.23	Asia Pacific Paper Straw Market, 2016 – 2026 (USD Million)
      Fig.24	China Paper Straw Market, 2016 – 2026 (USD Million)
      Fig.25	Japan Paper Straw Market, 2016 – 2026 (USD Million)
      Fig.26	India Paper Straw Market, 2016 – 2026 (USD Million)
      Fig.27	South  Korea Paper Straw Market, 2016 – 2026 (USD Million)
      Fig.28	South-East Asia Paper Straw Market, 2016 – 2026 (USD Million)
      Fig.29	Rest of Asia Pacific Paper Straw Market, 2016 – 2026 (USD Million)
      Fig.30	Latin America Paper Straw Market, 2016 – 2026 (USD Million)
      Fig.31	Brazil Paper Straw Market, 2016 – 2026 (USD Million)
      Fig.32	Mexico Paper Straw Market, 2016 – 2026 (USD Million)
      Fig.33	Rest of Latin America Paper Straw Market, 2016 – 2026 (USD Million)
      Fig.34	The Middle-East and Africa Paper Straw Market, 2016 – 2026 (USD Million)
      Fig.35	GCC Countries Paper Straw Market, 2016 – 2026 (USD Million)
      Fig.36	South Africa Paper Straw Market, 2016 – 2026 (USD Million)
      Fig.37	Rest of Middle-East Africa Paper Straw Market, 2016 – 2026 (USD Million)
      Fig.38	Competitor Market Share – Revenue
      Fig.39	Fuling Global Revenue and Growth Rate
      Fig.40	Fuling Global Market Share
      Fig.41	Footprint Revenue and Growth Rate
      Fig.42	Footprint Market Share
      Fig.43	Charta Global Revenue and Growth Rate
      Fig.44	Charta Global Market Share
      Fig.45	Canada Brown Eco Products Revenue and Growth Rate
      Fig.46	Canada Brown Eco Products Market Share
      Fig.47	Bygreen Revenue and Growth Rate
      Fig.48	Bygreen Market Share
      Fig.49	Biopak Revenue and Growth Rate
      Fig.50	Biopak Market Share
      Fig.51	Hoffmaster Group Revenue and Growth Rate
      Fig.52	Hoffmaster Group Market Share
      Fig.53	Transcend Packaging Revenue and Growth Rate
      Fig.54	Transcend Packaging Market Share
      Fig.55	Royal Paper Industries Revenue and Growth Rate
      Fig.56	Royal Paper Industries Market Share
      Fig.57	Huhtamaki OYJ Revenue and Growth Rate
      Fig.58	Huhtamaki OYJ Market Share
      Fig.59	Tetra Pak Revenue and Growth Rate
      Fig.60	Tetra Pak Market Share
      Fig.61	Hello Straw Revenue and Growth Rate
      Fig.62	Hello Straw Market Share
      Fig.63	Nippon Paper Group Revenue and Growth Rate
      Fig.64	Nippon Paper Group Market Share
      Fig.65	Soton Daily Necessity Co. Ltd Revenue and Growth Rate
      Fig.66	Soton Daily Necessity Co. Ltd Market Share
      Fig.67	Shenzhen Grizzlies Industries Co. Ltd Revenue and Growth Rate
      Fig.68	Shenzhen Grizzlies Industries Co. Ltd Market Share
      Fig.69	Market Dynamics
      Fig.70	Global Paper Straw – Value Chain Analysis
      Fig.71	Key Mandates and Regulations
      Fig.72	Technology Roadmap and Timeline
      Fig.73	Market Attractiveness Analysis – By Material
      Fig.74	Market Attractiveness Analysis – By Application
      Fig.75	Market Attractiveness Analysis – By Region
      Fig.76	Paper Straw Industrial Chain Analysis
      Fig.77	Market Channels
      Fig.78	Marketing Channel Development Trend
      Fig.79	Growth in World Gross Product, 2008-2018
      

      List of Tables

      Table 1	Global Paper Straw Market, 2019 & 2026 (USD Million)
      Table 2	Global Paper Straw Market, by Material, 2016 – 2026 (USD Million)
      Table 3	Global Paper Straw Market, by Application, 2016 – 2026 (USD Million)
      Table 4	Global Paper Straw Market, by Region, 2016 – 2026 (USD Million)
      Table 5	North America Paper Straw Market, by Country, 2016 – 2026 (USD Million)
      Table 6	North America Paper Straw Market, by Material, 2016 – 2026 (USD Million)
      Table 7	North America Paper Straw Market, by Application, 2016 – 2026 (USD Million)
      Table 8	Europe Paper Straw Market, by Country, 2016 – 2026 (USD Million)
      Table 9	Europe Paper Straw Market, by Material, 2016 – 2026 (USD Million)
      Table 10 Europe Paper Straw Market, by Application, 2016 – 2026 (USD Million)
      Table 11 Asia Pacific Paper Straw Market, by Country, 2016 – 2026 (USD Million)
      Table 12 Asia Pacific Paper Straw Market, by Material, 2016 – 2026 (USD Million)
      Table 13 Asia Pacific Paper Straw Market, by Application, 2016 – 2026 (USD Million)
      Table 14 Latin America Paper Straw Market, by Country, 2016 – 2026 (USD Million)
      Table 15 Latin America Paper Straw Market, by Material, 2016 – 2026 (USD Million)
      Table 16 Latin America Paper Straw Market, by Application, 2016 – 2026 (USD Million)
      Table 17 The Middle-East and Africa Paper Straw Market, by Country, 2016 – 2026 (USD Million)
      Table 18 The Middle-East and Africa Paper Straw Market, by Material, 2016 – 2026 (USD Million)
      Table 19 The Middle-East and Africa Paper Straw Market, by Application, 2016 – 2026 (USD Million)
      Table 20 Global Paper Straw Market - Company Revenue Analysis, 2016 – 2019 (USD Million)
      Table 21 Global Paper Straw Market - Company Revenue Share Analysis, 2016 – 2019 (%)
      Table 22 Acquisitions and Mergers
      Table 23 Market Drivers – Impact Analysis
      Table 24 Market Restraints
      Table 25 Market Opportunities
      Table 26 Major Buyers of Paper Straw
      Table 27 Distributors/Traders of Paper Straw by Region
      

Industry Major Market Players

  • Fuling Global
  • Footprint
  • Charta Global
  • Canada Brown Eco Products
  • Bygreen
  • Biopak
  • Hoffmaster Group
  • Transcend Packaging
  • Royal Paper Industries
  • Huhtamaki OYJ
  • Tetra Pak
  • Hello Straw
  • Nippon Paper Group
  • Soton Daily Necessity Co. Ltd
  • Shenzhen Grizzlies Industries Co. Ltd