Search Market Research Report

Discover Our Latest Reports
Discover Our Featured Reports
Discover Top Selling Reports

Palm Methyl Ester Market Size, Share Global Analysis Report, 2020–2026

report img

Palm Methyl Ester Market By Application (Bio-fuel, Food, Lubricants, Surfactants, Agriculture, Solvents, Polymers, Metal Working Fluids, and Others): Global Industry Outlook, Market Size, Business Intelligence, Consumer Preferences, Statistical Surveys, Comprehensive Analysis, Historical Developments, Current Trends, and Forecast 2020–2026

Industry Insights

The palm methyl ester market report analyzes and notifies the industry statistics at the global as well as regional and country levels in order to acquire a thorough perspective of the entire palm methyl ester market. The historical and past insights are provided for FY 2016 to FY 2019 whereas projected trends are delivered for FY 2020 to FY 2026. The quantitative and numerical data is represented in terms of both volume (Kilo Tons) and value (USD Billion) from FY 2016 – 2026.

This specialized and expertise oriented industry research report scrutinizes the technical and commercial business outlook of the palm methyl ester industry. The report analyzes and declares the historical and current trends analysis of the palm methyl ester industry and subsequently recommends the projected trends anticipated to be observed in the palm methyl ester market during the upcoming years.

Palm Methyl Ester Market Size

To know more about this report | Request Free Sample Copy


logoKey Insights from Primary Research

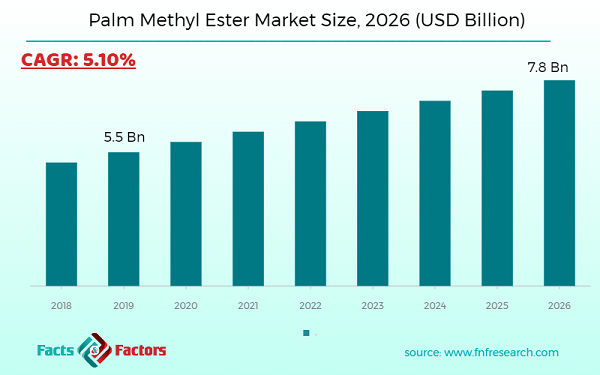
  • As per our primary respondents, the palm methyl ester market is set to grow annually at a rate of around 5.10%
  • It was established through primary research that the palm methyl ester market was valued at around USD 5.5 billion in 2019
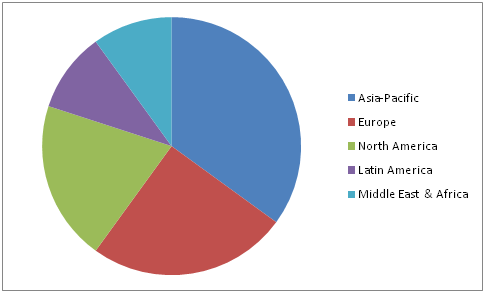
  • The Asia Pacific held the largest market share of the palm methyl ester in terms of revenue in 2018
  • The “lubricants” category, on the basis of application segmentation, was the leading revenue-generating category in 2018
  • The palm methyl ester is used as emulsifiers in the food industry

logoKey Recommendations from Analysts

  • As per our analysts, increasing demand for palm methyl ester in the biofuel industry is expected to drive the market for palm methyl ester market in coming years
  • Issues such as deforestation for plantation of the palm may hurdle the growth of the palm methyl ester market
  • Growing demand from the food industry for the palm methyl ester market is likely to offer new opportunities in the coming years
  • Latin America is expected to experience lucrative growth over a period of years due to the growing industrialization and food industry in Brazil
  • India, China, and Japan are expected to be the most potent markets in the near future due to increasing automotive and agricultural industry in these regions

logoGlobal Palm Methyl Ester Market Share – By Region

Palm Methyl Ester Market

To know more about this report | Request Free Sample Copy


The quantitative data is further underlined and reinforced by comprehensive qualitative data which comprises various across-the-board market dynamics. The rationales which directly or indirectly impact the palm methyl ester industry are exemplified through parameters such as growth drivers, restraints, challenges, and opportunities among other impacting factors.

Throughout our research report, we have encompassed all the proven models and tools of industry analysis and extensively illustrated all the key business strategies and business models adopted in the palm methyl ester industry. The report provides an all-inclusive and detailed competitive landscape prevalent in the palm methyl ester market.

The report utilizes established industry analysis tools and models such as Porter’s Five Forces framework to analyze and recognize critical business strategies adopted by various stakeholders involved in the entire value chain of the palm methyl ester industry. The palm methyl ester market report additionally employs SWOT analysis and PESTLE analysis models for further in-depth analysis.

The report study further includes an in-depth analysis of industry players' market shares and provides an overview of leading players' market position in the palm methyl ester sector. Key strategic developments in the palm methyl ester market competitive landscape such as acquisitions & mergers, inaugurations of different products and services, partnerships & joint ventures, MoU agreements, VC & funding activities, R&D activities, and geographic expansion among other noteworthy activities by key players of the palm methyl ester market are appropriately highlighted in the report.

An increasing trend for eco-friendly fuel is likely to drive the palm methyl ester market. Moreover, rising demand from the end-user industry such as the food industry, and lubricant agriculture is expected to trigger the growth of the palm methyl ester market in the coming years. The growing industrial sector is expected to aid the growth of the palm methyl ester market in the coming years. High accomplishment forms the government for use of bio-based fuel is predicted to bloom the palm methyl ester market in the forecast period. However, environmental concerns regarding the plantation of the palm may impede the growth of the palm methyl ester market. Nevertheless, ongoing research for exploiting properties and untapped opportunities of palm methyl ester is likely to positively impact on palm methyl ester market in the coming years.

The palm methyl ester market research report delivers an acute valuation and taxonomy of the palm methyl ester industry by practically splitting the market on the basis of different types, applications, and regions. Through the analysis of the historical and projected trends, all the segments and sub-segments were evaluated through the bottom-up approach, and different market sizes have been projected for FY 2020 to FY 2026. The regional segmentation of the palm methyl ester industry includes the complete classification of all the major continents including North America, Latin America, Europe, Asia Pacific, and the Middle East & Africa. Further, country-wise data for the palm methyl ester industry is provided for the leading economies of the world.

The palm methyl ester market is segmented based on Application. In terms of Application segmentation, the market is bifurcated into Biofuel, Food, Lubricants, Surfactants, Agriculture, Solvents, Polymers, Metal Working Fluids, and Others.

logoReport Scope

Report Attribute

Details

Market Size in 2019

USD 5.5 Billion

Projected Market Size in 2026

USD 7.8 Billion

CAGR Growth Rate

5.10% CAGR

Base Year

2019

Forecast Years

2020-2026

Key Market Players

Agricode Bio-Technology Pte Ltd., On Biz Enterprise, AM Biofuels SdnBhd, LOL OleochemicalsSdn. Bhd., Alternative Fuels Holdings SdnBhd, PG Worldwide Trade SDN BHD, RITS, Green and Natural Sdn Bhd., BioinventSdn Bhd., International Source, Natural Fuel PTE Ltd., Pure Diesel Co. Ltd., and others.

Key Segment

By Application, By Region

Major Regions Covered

North America, Europe, Asia Pacific, Latin America, and the Middle East & Africa

Purchase Options

Request customized purchase options to meet your research needs. Explore purchase options

logoSome of the essential players operating in the palm methyl ester market, but not restricted to include

  •  PG Worldwide Trade SDN BHD
  •  RITS
  •  LOL OleochemicalsSdn. Bhd.
  •  AM Biofuels Sdn Bhd.
  •  Green and Natural Sdn Bhd.
  •  Alternative Fuels Holdings Sdn Bhd
  •  On Biz Enterprise
  •  Pure Diesel Co. Ltd.
  •  BioinventSdn Bhd.
  •  International Source
  •  Natural Fuel PTE Ltd.
  •  Agricode Bio-Technology Pte Ltd.

The taxonomy of the palm methyl ester industry by its scope and segmentation is as follows:

logo By Application Segmentation Analysis (Customizable)

  • Bio-fuel
  • Food
  • Lubricants
  • Surfactants
  • Agriculture
  • Solvents
  • Polymers
  • Metal Working Fluids
  • Others

logoGlobal Palm Methyl Ester Market: Regional Segmentation Analysis (Customizable)

  • North America
    • The U.S.
    • Canada
  • Europe
    • Germany
    • The UK
    • France
    • Spain
    • Italy
    • Rest of Europe
  • Asia Pacific
    • China
    • Japan
    • India
    • South Korea
    • Southeast Asia
    • Rest of Asia Pacific
  • Latin America
    • Brazil
    • Mexico
    • Rest of Latin America
  • Middle East & Africa
    • GCC
    • South Africa
    • Rest of the Middle East & Africa

Table of Content

  1. CHAPTER 1. Executive Summary
  2. CHAPTER 2. Palm Methyl Ester market – Application Analysis
    1. 2.1. Global Palm Methyl Ester Market – Application Overview
    2. 2.2. Global Palm Methyl Ester Market Share, by Application, 2019 & 2026 (USD Billion)
    3. 2.3. Global Palm Methyl Ester Market share, by Application, 2019 & 2026 (Kilo Tons)
    4. 2.4. Bio-fuel
      1. 2.4.1. Global Bio-fuel Palm Methyl Ester Market, 2016-2026 (USD Billion)
      2. 2.4.2. Global Bio-fuel Palm Methyl Ester Market, 2016-2026 (Kilo Tons)
    5. 2.5. Food
      1. 2.5.1. Global Food Palm Methyl Ester Market, 2016-2026 (USD Billion)
      2. 2.5.2. Global Food Palm Methyl Ester Market, 2016-2026 (Kilo Tons)
    6. 2.6. Lubricants
      1. 2.6.1. Global Lubricants Palm Methyl Ester Market, 2016-2026 (USD Billion)
      2. 2.6.2. Global Lubricants Palm Methyl Ester Market, 2016-2026 (Kilo Tons)
    7. 2.7. Surfactants
      1. 2.7.1. Global Surfactants Palm Methyl Ester Market, 2016-2026 (USD Billion)
      2. 2.7.2. Global Surfactants Palm Methyl Ester Market, 2016-2026 (Kilo Tons)
    8. 2.8. Agriculture
      1. 2.8.1. Global Agriculture Palm Methyl Ester Market, 2016-2026 (USD Billion)
      2. 2.8.2. Global Agriculture Palm Methyl Ester Market, 2016-2026 (Kilo Tons)
    9. 2.9. Solvents
      1. 2.9.1. Global Solvents Palm Methyl Ester Market, 2016-2026 (USD Billion)
      2. 2.9.2. Global Solvents Palm Methyl Ester Market, 2016-2026 (Kilo Tons)
    10. 2.10. Polymers
      1. 2.10.1. Global Polymers Palm Methyl Ester Market, 2016-2026 (USD Billion)
      2. 2.10.2. Global Polymers Palm Methyl Ester Market, 2016-2026 (Kilo Tons)
    11. 2.11. Metal Working Fluids
      1. 2.11.1. Global Metal Working Fluids Palm Methyl Ester Market, 2016-2026 (USD Billion)
      2. 2.11.2. Global Metal Working Fluids Palm Methyl Ester Market, 2016-2026 (Kilo Tons)
    12. 2.12. Others
      1. 2.12.1. Global Others Palm Methyl Ester Market, 2016-2026 (USD Billion)
      2. 2.12.2. Global Others Palm Methyl Ester Market, 2016-2026 (Kilo Tons)
  3. CHAPTER 3. Palm Methyl Ester market – Regional Analysis
    1. 3.1. Global Palm Methyl Ester Market Regional Overview
    2. 3.2. Global Palm Methyl Ester Market Share, by Region, 2019 & 2026 (Value)
    3. 3.3. Global Palm Methyl Ester Market Share, by Region, 2019 & 2026 (Volume)
    4. 3.4. North America
      1. 3.4.1. North America Palm Methyl Ester Market size and forecast, 2016-2026
      2. 3.4.2. North America Palm Methyl Ester Market, by Country, 2019 - 2026 (USD Billion)
      3. 3.4.3. North America Market size and forecast, 2016-2026 (Kilo Tons)
      4. 3.4.4. North America Palm Methyl Ester Market, by Country, 2019 - 2026 (Kilo Tons)
      5. 3.4.5. North America Palm Methyl Ester Market, by Application, 2016-2026
        1. 3.4.5.1. North America Palm Methyl Ester Market, by Application, 2016-2026 (USD Billion)
        2. 3.4.5.2. North America Palm Methyl Ester Market, by Application, 2016-2026 (Kilo Tons)
      6. 3.4.6. U.S.
        1. 3.4.6.1. U.S. Market size and forecast, 2016-2026 (USD Billion)
        2. 3.4.6.2. U.S. Market size and forecast, 2016-2026 (Kilo Tons)
      7. 3.4.7. Canada
        1. 3.4.7.1. Canada Market size and forecast, 2016-2026 (USD Billion)
        2. 3.4.7.2. Canada Market size and forecast, 2016-2026 (Kilo Tons)
    5. 3.5. Europe
      1. 3.5.1. Europe Palm Methyl Ester Market size and forecast, 2016-2026
      2. 3.5.2. Europe Palm Methyl Ester Market, by Country, 2019 - 2026 (USD Billion)
      3. 3.5.3. Europe Market size and forecast, 2016-2026 (Kilo Tons)
      4. 3.5.4. Europe Palm Methyl Ester Market, by Country, 2019 - 2026 (Kilo Tons)
      5. 3.5.5. Europe Palm Methyl Ester Market, by Application, 2016-2026
        1. 3.5.5.1. Europe Palm Methyl Ester Market, by Application, 2016-2026 (USD Billion)
        2. 3.5.5.2. Europe Palm Methyl Ester Market, by Application, 2016-2026 (Kilo Tons)
      6. 3.5.6. Germany
        1. 3.5.6.1. Germany Market size and forecast, 2016-2026 (USD Billion)
        2. 3.5.6.2. Germany Market size and forecast, 2016-2026 (Kilo Tons)
      7. 3.5.7. France
        1. 3.5.7.1. France Market size and forecast, 2016-2026 (USD Billion)
        2. 3.5.7.2. France Market size and forecast, 2016-2026 (Kilo Tons)
      8. 3.5.8. U.K.
        1. 3.5.8.1. U.K. Market size and forecast, 2016-2026 (USD Billion)
        2. 3.5.8.2. U.K. Market size and forecast, 2016-2026 (Kilo Tons)
      9. 3.5.9. Italy
        1. 3.5.9.1. Italy Market size and forecast, 2016-2026 (USD Billion)
        2. 3.5.9.2. Italy Market size and forecast, 2016-2026 (Kilo Tons)
      10. 3.5.10. Spain
        1. 3.5.10.1. Spain Market size and forecast, 2016-2026 (USD Billion)
        2. 3.5.10.2. Spain Market size and forecast, 2016-2026 (Kilo Tons)
      11. 3.5.11. Rest of Europe
        1. 3.5.11.1. Rest of Europe Market size and forecast, 2016-2026 (USD Billion)
        2. 3.5.11.2. Rest of Europe Market size and forecast, 2016-2026 (Kilo Tons)
    6. 3.6. Asia Pacific
      1. 3.6.1. Asia Pacific Palm Methyl Ester Market size and forecast, 2016-2026
      2. 3.6.2. Asia Pacific Palm Methyl Ester Market, by Country, 2019 - 2026 (USD Billion)
      3. 3.6.3. Asia Pacific Market size and forecast, 2016-2026 (Kilo Tons)
      4. 3.6.4. Asia Pacific Palm Methyl Ester Market, by Country, 2019 - 2026 (Kilo Tons)
      5. 3.6.5. Asia Pacific Palm Methyl Ester Market, by Application, 2016-2026
        1. 3.6.5.1. Asia Pacific Palm Methyl Ester Market, by Application, 2016-2026 (USD Billion)
        2. 3.6.5.2. Asia Pacific Palm Methyl Ester Market, by Application, 2016-2026 (Kilo Tons)
      6. 3.6.6. China
        1. 3.6.6.1. China Market size and forecast, 2016-2026 (USD Billion)
        2. 3.6.6.2. China Market size and forecast, 2016-2026 (Kilo Tons)
      7. 3.6.7. Japan
        1. 3.6.7.1. Japan Market size and forecast, 2016-2026 (USD Billion)
        2. 3.6.7.2. Japan Market size and forecast, 2016-2026 (Kilo Tons)
      8. 3.6.8. India
        1. 3.6.8.1. India Market size and forecast, 2016-2026 (USD Billion)
        2. 3.6.8.2. India Market size and forecast, 2016-2026 (Kilo Tons)
      9. 3.6.9. South Korea
        1. 3.6.9.1. South Korea Market size and forecast, 2016-2026 (USD Billion)
        2. 3.6.9.2. South Korea Market size and forecast, 2016-2026 (Kilo Tons)
      10. 3.6.10. South-East Asia
        1. 3.6.10.1. South-East Asia Market size and forecast, 2016-2026 (USD Billion)
        2. 3.6.10.2. South-East Asia Market size and forecast, 2016-2026 (Kilo Tons)
      11. 3.6.11. Rest of Asia Pacific
        1. 3.6.11.1. Rest of Asia Pacific Market size and forecast, 2016-2026 (USD Billion)
        2. 3.6.11.2. Rest of Asia Pacific Market size and forecast, 2016-2026 (Kilo Tons)
    7. 3.7. Latin America
      1. 3.7.1. Latin America Palm Methyl Ester Market size and forecast, 2016-2026
      2. 3.7.2. Latin America Palm Methyl Ester Market, by Country, 2019 - 2026 (USD Billion)
      3. 3.7.3. Latin America Market size and forecast, 2016-2026 (Kilo Tons)
      4. 3.7.4. Latin America Palm Methyl Ester Market, by Country, 2019 - 2026 (Kilo Tons)
      5. 3.7.5. Latin America Palm Methyl Ester Market, by Application, 2016-2026
        1. 3.7.5.1. Latin America Palm Methyl Ester Market, by Application, 2016-2026 (USD Billion)
        2. 3.7.5.2. Latin America Palm Methyl Ester Market, by Application, 2016-2026 (Kilo Tons)
      6. 3.7.6. Brazil
        1. 3.7.6.1. Brazil Market size and forecast, 2016-2026 (USD Billion)
        2. 3.7.6.2. Brazil Market size and forecast, 2016-2026 (Kilo Tons)
      7. 3.7.7. Mexico
        1. 3.7.7.1. Mexico Market size and forecast, 2016-2026 (USD Billion)
        2. 3.7.7.2. Mexico Market size and forecast, 2016-2026 (Kilo Tons)
      8. 3.7.8. Rest of Latin America
        1. 3.7.8.1. Rest of Latin America Market size and forecast, 2016-2026 (USD Billion)
        2. 3.7.8.2. Rest of Latin America Market size and forecast, 2016-2026 (Kilo Tons)
    8. 3.8. The Middle-East and Africa
      1. 3.8.1. The Middle-East and Africa Palm Methyl Ester Market size and forecast, 2016-2026
      2. 3.8.2. The Middle-East and Africa Palm Methyl Ester Market, by Country, 2019 - 2026 (USD Billion)
      3. 3.8.3. The Middle-East and Africa Market size and forecast, 2016-2026 (Kilo Tons)
      4. 3.8.4. The Middle-East and Africa Palm Methyl Ester Market, by Country, 2019 - 2026 (Kilo Tons)
      5. 3.8.5. The Middle-East and Africa Palm Methyl Ester Market, by Application, 2016-2026
        1. 3.8.5.1. The Middle-East and Africa Palm Methyl Ester Market, by Application, 2016-2026 (USD Billion)
        2. 3.8.5.2. The Middle-East and Africa Palm Methyl Ester Market, by Application, 2016-2026 (Kilo Tons)
      6. 3.8.6. GCC Countries
        1. 3.8.6.1. GCC Countries Market size and forecast, 2016-2026 (USD Billion)
        2. 3.8.6.2. GCC Countries Market size and forecast, 2016-2026 (Kilo Tons)
      7. 3.8.7. South Africa
        1. 3.8.7.1. South Africa Market size and forecast, 2016-2026 (USD Billion)
        2. 3.8.7.2. South Africa Market size and forecast, 2016-2026 (Kilo Tons)
      8. 3.8.8. Rest of Middle-East Africa
        1. 3.8.8.1. Rest of Middle-East Africa Market size and forecast, 2016-2026 (USD Billion)
        2. 3.8.8.2. Rest of Middle-East Africa Market size and forecast, 2016-2026 (Kilo Tons)
  4. CHAPTER 4. Palm Methyl Ester Production, Consumption, Export, Import by Regions
    1. 4.1. Global Palm Methyl Ester production and revenue, 2016-2026 (USD Billion) (Kilo Tons)
    2. 4.2. Global Import and Export Analysis, by Region
  5. CHAPTER 5. Palm Methyl Ester market – Competitive Landscape
    1. 5.1. Competitor Market Share – Revenue
    2. 5.2. Market Concentration Rate Analysis, Top 3 and Top 5 Players
    3. 5.3. Competitor Market Share – Volume
    4. 5.4. Strategic Development
      1. 5.4.1. Acquisitions and Mergers
      2. 5.4.2. New Products
      3. 5.4.3. Research & Development Activities
  6. CHAPTER 6. Company Profiles
    1. 6.1. OnBiz Enterprise
      1. 6.1.1. Company Overview
      2. 6.1.2. OnBiz Enterprise Sales, Revenue, Price, and Gross Margin
      3. 6.1.3. Product portfolio
      4. 6.1.4. Recent initiatives
    2. 6.2. PG Worldwide Trade SDN BHD
      1. 6.2.1. Company Overview
      2. 6.2.2. PG Worldwide Trade SDN BHD Sales, Revenue, Price, and Gross Margin
      3. 6.2.3. Product portfolio
      4. 6.2.4. Recent initiatives
    3. 6.3. Pure Diesel Co. Ltd.
      1. 6.3.1. Company Overview
      2. 6.3.2. Pure Diesel Co. Ltd. Sales, Revenue, Price, and Gross Margin
      3. 6.3.3. Product portfolio
      4. 6.3.4. Recent initiatives
    4. 6.4. RITS
      1. 6.4.1. Company Overview
      2. 6.4.2. RITS Sales, Revenue, Price, and Gross Margin
      3. 6.4.3. Product portfolio
      4. 6.4.4. Recent initiatives
    5. 6.5. Bioinvent Sdn Bhd
      1. 6.5.1. Company Overview
      2. 6.5.2. Bioinvent Sdn Bhd Sales, Revenue, Price, and Gross Margin
      3. 6.5.3. Product portfolio
      4. 6.5.4. Recent initiatives
    6. 6.6. LOL Oleochemicals Sdn. Bhd
      1. 6.6.1. Company Overview
      2. 6.6.2. LOL Oleochemicals Sdn. Bhd Sales, Revenue, Price, and Gross Margin
      3. 6.6.3. Product portfolio
      4. 6.6.4. Recent initiatives
    7. 6.7. International Source
      1. 6.7.1. Company Overview
      2. 6.7.2. International Source Sales, Revenue, Price, and Gross Margin
      3. 6.7.3. Product portfolio
      4. 6.7.4. Recent initiatives
    8. 6.8. AM Biofuels Sdn Bhd.
      1. 6.8.1. Company Overview
      2. 6.8.2. AM Biofuels Sdn Bhd. Sales, Revenue, Price, and Gross Margin
      3. 6.8.3. Product portfolio
      4. 6.8.4. Recent initiatives
    9. 6.9. Natural Fuel PTE Ltd.
      1. 6.9.1. Company Overview
      2. 6.9.2. Natural Fuel PTE Ltd. Sales, Revenue, Price, and Gross Margin
      3. 6.9.3. Product portfolio
      4. 6.9.4. Recent initiatives
    10. 6.10. Green and Natural Sdn Bhd
      1. 6.10.1. Company Overview
      2. 6.10.2. Green and Natural Sdn Bhd Sales, Revenue, Price, and Gross Margin
      3. 6.10.3. Product portfolio
      4. 6.10.4. Recent initiatives
    11. 6.11. Agricode Bio-Technology Pte Ltd.
      1. 6.11.1. Company Overview
      2. 6.11.2. Agricode Bio-Technology Pte Ltd. Sales, Revenue, Price, and Gross Margin
      3. 6.11.3. Product portfolio
      4. 6.11.4. Recent initiatives
    12. 6.12. Alternative Fuels Holdings Sdn Bhd
      1. 6.12.1. Company Overview
      2. 6.12.2. Alternative Fuels Holdings Sdn Bhd Sales, Revenue, Price, and Gross Margin
      3. 6.12.3. Product portfolio
      4. 6.12.4. Recent initiatives
  7. CHAPTER 7. Palm Methyl Ester — Industry Analysis
    1. 7.1. Introduction and Taxonomy
    2. 7.2. Palm Methyl Ester Market – Key Trends
      1. 7.2.1. Market Drivers
      2. 7.2.2. Market Restraints
      3. 7.2.3. Market Opportunities
    3. 7.3. Value Chain Analysis
    4. 7.4. Key Mandates and Regulations
    5. 7.5. Technology Roadmap and Timeline
    6. 7.6. Palm Methyl Ester market – Attractiveness Analysis
      1. 7.6.1. By Application
      2. 7.6.2. By Region
  8. CHAPTER 8. Raw Material analysis
    1. 8.1. Palm Methyl Ester Key Raw Material Analysis
      1. 8.1.1. Key Raw Materials
      2. 8.1.2. Price Trend of Key Raw Materials
    2. 8.2. Key Suppliers of Raw Materials
    3. 8.3. Proportion of Manufacturing Cost Structure
      1. 8.3.1. Raw Materials
      2. 8.3.2. Labor Cost
    4. 8.4. Manufacturing Expenses Analysis of Palm Methyl Ester
  9. CHAPTER 9. Industrial Chain, Sourcing Strategy and Downstream Buyers
    1. 9.1. Palm Methyl Ester Industrial Chain Analysis
    2. 9.2. Upstream Raw Materials Sourcing
      1. 9.2.1. Risk Mitigation:
      2. 9.2.2. Supplier Relationships:
      3. 9.2.3. Business Processes:
      4. 9.2.4. Securing the Product:
    3. 9.3. Raw Materials Sources of Palm Methyl Ester Major Manufacturers in 2016
    4. 9.4. Downstream Buyers
    5. 9.5. Distributors/Traders List
  10. CHAPTER 10. Marketing Strategy Analysis, Distributors
    1. 10.1. Marketing Channel
    2. 10.2. Direct Marketing
    3. 10.3. Indirect Marketing
    4. 10.4. Marketing Channel Development Trend
    5. 10.5. Economic/Political Environmental Change
  11. CHAPTER 11. Report Conclusion
  12. CHAPTER 12. Research Approach & Methodology
    1. 12.1. Report Description
    2. 12.2. Research Scope
    3. 12.3. Research Methodology
      1. 12.3.1. Secondary Research
      2. 12.3.2. Primary Research
      3. 12.3.3. Models
        1. 12.3.3.1. Company Share Analysis Model
        2. 12.3.3.2. Revenue Based Modeling
        3. 12.3.3.3. Research Limitations

        List of Figures

        FIG. 1 Global Palm Methyl Ester Market, 2016-2026 (USD Billion)
        FIG. 2 Global Palm Methyl Ester Market Share, by Application, 2019 & 2026 (USD Billion)
        FIG. 3 Global Palm Methyl Ester Market share, by Application, 2019 & 2026 (Kilo Tons)
        FIG. 4 Global Bio-fuel Palm Methyl Ester Market, 2016-2026 (USD Billion)
        FIG. 5 Global Bio-fuel Palm Methyl Ester  Market, 2016-2026 (Kilo Tons)
        FIG. 6 Global Food Palm Methyl Ester Market, 2016-2026 (USD Billion)
        FIG. 7 Global Food Palm Methyl Ester  Market, 2016-2026 (Kilo Tons)
        FIG. 8 Global Lubricants Palm Methyl Ester Market, 2016-2026 (USD Billion)
        FIG. 9 Global Lubricants Palm Methyl Ester  Market, 2016-2026 (Kilo Tons)
        FIG. 10 Global Surfactants Palm Methyl Ester Market, 2016-2026 (USD Billion)
        FIG. 11 Global Surfactants Palm Methyl Ester  Market, 2016-2026 (Kilo Tons)
        FIG. 12 Global Agriculture Palm Methyl Ester Market, 2016-2026 (USD Billion)
        FIG. 13 Global Agriculture Palm Methyl Ester  Market, 2016-2026 (Kilo Tons)
        FIG. 14 Global Solvents Palm Methyl Ester Market, 2016-2026 (USD Billion)
        FIG. 15 Global Solvents Palm Methyl Ester  Market, 2016-2026 (Kilo Tons)
        FIG. 16 Global Polymers Palm Methyl Ester Market, 2016-2026 (USD Billion)
        FIG. 17 Global Polymers Palm Methyl Ester  Market, 2016-2026 (Kilo Tons)
        FIG. 18 Global Metal Working Fluids Palm Methyl Ester Market, 2016-2026 (USD Billion)
        FIG. 19 Global Metal Working Fluids Palm Methyl Ester  Market, 2016-2026 (Kilo Tons)
        FIG. 20 Global Others Palm Methyl Ester Market, 2016-2026 (USD Billion)
        FIG. 21 Global Others Palm Methyl Ester  Market, 2016-2026 (Kilo Tons)
        FIG. 22 Global Palm Methyl Ester Market Share, by Region, 2019 & 2026
        FIG. 23 Global Palm Methyl Ester Market Share, by Region, 2019 & 2026
        FIG. 24 North America Palm Methyl Ester Market, 2016-2026
        FIG. 25 North America Palm Methyl Ester  Market, 2016-2026 (Kilo Tons)
        FIG. 26 U.S. Palm Methyl Ester Market, 2016-2026
        FIG. 27 U.S. Palm Methyl Ester  Market, 2016-2026 (Kilo Tons)
        FIG. 28 Canada Palm Methyl Ester Market, 2016-2026
        FIG. 29 Canada Palm Methyl Ester  Market, 2016-2026 (Kilo Tons)
        FIG. 30 Europe Palm Methyl Ester Market, 2016-2026
        FIG. 31 Europe Palm Methyl Ester  Market, 2016-2026 (Kilo Tons)
        FIG. 32 Germany Palm Methyl Ester Market, 2016-2026
        FIG. 33 Germany Palm Methyl Ester  Market, 2016-2026 (Kilo Tons)
        FIG. 34 France Palm Methyl Ester Market, 2016-2026
        FIG. 35 France Palm Methyl Ester  Market, 2016-2026 (Kilo Tons)
        FIG. 36 U.K. Palm Methyl Ester Market, 2016-2026
        FIG. 37 U.K. Palm Methyl Ester  Market, 2016-2026 (Kilo Tons)
        FIG. 38 Italy Palm Methyl Ester Market, 2016-2026
        FIG. 39 Italy Palm Methyl Ester  Market, 2016-2026 (Kilo Tons)
        FIG. 40 Spain Palm Methyl Ester Market, 2016-2026
        FIG. 41 Spain Palm Methyl Ester  Market, 2016-2026 (Kilo Tons)
        FIG. 42 Rest of Europe Palm Methyl Ester Market, 2016-2026
        FIG. 43 Rest of Europe Palm Methyl Ester  Market, 2016-2026 (Kilo Tons)
        FIG. 44 Asia Pacific Palm Methyl Ester Market, 2016-2026
        FIG. 45 Asia Pacific Palm Methyl Ester  Market, 2016-2026 (Kilo Tons)
        FIG. 46 China Palm Methyl Ester Market, 2016-2026
        FIG. 47 China Palm Methyl Ester  Market, 2016-2026 (Kilo Tons)
        FIG. 48 Japan Palm Methyl Ester Market, 2016-2026
        FIG. 49 Japan Palm Methyl Ester  Market, 2016-2026 (Kilo Tons)
        FIG. 50 India Palm Methyl Ester Market, 2016-2026
        FIG. 51 India Palm Methyl Ester  Market, 2016-2026 (Kilo Tons)
        FIG. 52 South  Korea Palm Methyl Ester Market, 2016-2026
        FIG. 53 South  Korea Palm Methyl Ester  Market, 2016-2026 (Kilo Tons)
        FIG. 54 South-East Asia Palm Methyl Ester Market, 2016-2026
        FIG. 55 South-East Asia Palm Methyl Ester  Market, 2016-2026 (Kilo Tons)
        FIG. 56 Rest of Asia Pacific Palm Methyl Ester Market, 2016-2026
        FIG. 57 Rest of Asia Pacific Palm Methyl Ester  Market, 2016-2026 (Kilo Tons)
        FIG. 58 Latin America Palm Methyl Ester Market, 2016-2026
        FIG. 59 Latin America Palm Methyl Ester  Market, 2016-2026 (Kilo Tons)
        FIG. 60 Brazil Palm Methyl Ester Market, 2016-2026
        FIG. 61 Brazil Palm Methyl Ester  Market, 2016-2026 (Kilo Tons)
        FIG. 62 Mexico Palm Methyl Ester Market, 2016-2026
        FIG. 63 Mexico Palm Methyl Ester  Market, 2016-2026 (Kilo Tons)
        FIG. 64 Rest of Latin America Palm Methyl Ester Market, 2016-2026
        FIG. 65 Rest of Latin America Palm Methyl Ester  Market, 2016-2026 (Kilo Tons)
        FIG. 66 The Middle-East and Africa Palm Methyl Ester Market, 2016-2026
        FIG. 67 The Middle-East and Africa Palm Methyl Ester  Market, 2016-2026 (Kilo Tons)
        FIG. 68 GCC Countries Palm Methyl Ester Market, 2016-2026
        FIG. 69 GCC Countries Palm Methyl Ester  Market, 2016-2026 (Kilo Tons)
        FIG. 70 South Africa Palm Methyl Ester Market, 2016-2026
        FIG. 71 South Africa Palm Methyl Ester  Market, 2016-2026 (Kilo Tons)
        FIG. 72 Rest of Middle-East Africa Palm Methyl Ester Market, 2016-2026
        FIG. 73 Rest of Middle-East Africa Palm Methyl Ester  Market, 2016-2026 (Kilo Tons)
        FIG. 74 Global Palm Methyl Ester production and revenue, 2016-2026 (USD Billion) (Kilo Tons)
        FIG. 75 North America Palm Methyl Ester production and revenue, 2016-2026 (USD Billion) (Kilo Tons)
        FIG. 76 Europe Palm Methyl Ester production and revenue, 2016-2026 (USD Billion) (Kilo Tons)
        FIG. 77 Asia Pacific Palm Methyl Ester production and revenue, 2016-2026 (USD Billion) (Kilo Tons)
        FIG. 78 Latin America Palm Methyl Ester production and revenue, 2016-2026 (USD Billion) (Kilo Tons)
        FIG. 79 Middle East and Africa Palm Methyl Ester production and revenue, 2016-2026 (USD Billion) (Kilo Tons)
        FIG. 80 Competitor Market Share – Revenue
        FIG. 81 Competitor Market Share – Volume
        FIG. 82 OnBiz Enterprise Revenue and Growth Rate
        FIG. 83 OnBiz Enterprise Market Share
        FIG. 84 PG Worldwide Trade SDN BHD Revenue and Growth Rate
        FIG. 85 PG Worldwide Trade SDN BHD Market Share
        FIG. 86 Pure Diesel Co. Ltd. Revenue and Growth Rate
        FIG. 87 Pure Diesel Co. Ltd. Market Share
        FIG. 88 RITS Revenue and Growth Rate
        FIG. 89 RITS Market Share
        FIG. 90 Bioinvent Sdn Bhd Revenue and Growth Rate
        FIG. 91 Bioinvent Sdn Bhd Market Share
        FIG. 92 LOL Oleochemicals Sdn. Bhd Revenue and Growth Rate
        FIG. 93 LOL Oleochemicals Sdn. Bhd Market Share
        FIG. 94 International Source Revenue and Growth Rate
        FIG. 95 International Source Market Share
        FIG. 96 AM Biofuels Sdn Bhd. Revenue and Growth Rate
        FIG. 97 AM Biofuels Sdn Bhd. Market Share
        FIG. 98 Natural Fuel PTE Ltd. Revenue and Growth Rate
        FIG. 99 Natural Fuel PTE Ltd. Market Share
        FIG. 100 Green and Natural Sdn Bhd Revenue and Growth Rate
        FIG. 101 Green and Natural Sdn Bhd Market Share
        FIG. 102 Agricode Bio-Technology Pte Ltd. Revenue and Growth Rate
        FIG. 103 Agricode Bio-Technology Pte Ltd. Market Share
        FIG. 104 Alternative Fuels Holdings Sdn Bhd Revenue and Growth Rate
        FIG. 105 Alternative Fuels Holdings Sdn Bhd Market Share
        FIG. 106 Market Dynamics
        FIG. 107 Global Palm Methyl Ester – Value Chain Analysis
        FIG. 108 Key Mandates and Regulations
        FIG. 109 Technology Roadmap and Timeline
        FIG. 110 Market Attractiveness Analysis – By Application
        FIG. 111 Market Attractiveness Analysis – By Region
        FIG. 112 Manufacturing Cost Structure of Palm Methyl Ester
        FIG. 113 Palm Methyl Ester Industrial Chain Analysis
        FIG. 114 Market Channel
        FIG. 115 Marketing Channel Development Trend
        FIG. 116 Growth in World Gross Product, 2008-2019

        List of Tables

        TABLE 1 Global Palm Methyl Ester market, 2019 & 2026 (USD Billion)
        TABLE 2 Global Palm Methyl Ester market, by Application, 2016-2026 (USD Billion)
        TABLE 3 Global Palm Methyl Ester market, by Application, 2016-2026 (Kilo Tons)
        TABLE 4 Global Palm Methyl Ester market, by region, 2016-2026 (USD Billion)
        TABLE 5 Global Palm Methyl Ester market, by region, 2016-2026 (Kilo Tons)
        TABLE 6 North America Palm Methyl Ester Market, by Application, 2016-2026 (USD Billion)
        TABLE 7 North America Palm Methyl Ester Market, by Application, 2016-2026 (Kilo Tons)
        TABLE 8 Europe Palm Methyl Ester Market, by Application, 2016-2026 (USD Billion)
        TABLE 9 Europe Palm Methyl Ester Market, by Application, 2016-2026 (Kilo Tons)
        TABLE 10 Asia Pacific Palm Methyl Ester Market, by Application, 2016-2026 (USD Billion)
        TABLE 11 Asia Pacific Palm Methyl Ester Market, by Application, 2016-2026 (Kilo Tons)
        TABLE 12 Latin America Palm Methyl Ester Market, by Application, 2016-2026 (USD Billion)
        TABLE 13 Latin America Palm Methyl Ester Market, by Application, 2016-2026 (Kilo Tons)
        TABLE 14 The Middle-East and Africa Palm Methyl Ester Market, by Application, 2016-2026 (USD Billion)
        TABLE 15 The Middle-East and Africa Palm Methyl Ester Market, by Application, 2016-2026 (Kilo Tons)
        TABLE 16 North America Palm Methyl Ester Production, Consumption, Export, Import, 2016-2019
        TABLE 17 Europe Palm Methyl Ester Production, Consumption, Export, Import, 2016-2019
        TABLE 18 Asia Pacific Palm Methyl Ester Production, Consumption, Export, Import, 2016-2019
        TABLE 19 Latin America Palm Methyl Ester Production, Consumption, Export, Import, 2016-2019
        TABLE 20 Middle East & Africa Palm Methyl Ester Production, Consumption, Export, Import, 2016-2019
        TABLE 21 Global Palm Methyl Ester Market - Company Revenue Analysis 2016-2019 (USD Billion)
        TABLE 22 Global Palm Methyl Ester Market - Company Revenue Share Analysis 2016-2019(%)
        TABLE 23 Global Palm Methyl Ester Market - Company Volume Analysis 2016-2019 (Kilo Tons)
        TABLE 24 Global Palm Methyl Ester Market - Company Volume Share Analysis 2016-2019(%)
        TABLE 25 Acquisitions and Mergers
        TABLE 26 New Product/Service Launch
        TABLE 27 Research & Development Activities
        TABLE 28 Market Drivers
        TABLE 29 Market Restraints
        TABLE 30 Market Opportunities
        TABLE 31 Production Base and Market Concentration Rate of Raw Material
        TABLE 32 Key Suppliers of Raw Materials
        TABLE 33 Raw Materials Sources of Palm Methyl Ester Major Manufacturers in 2016
        TABLE 34 Major Buyers of Palm Methyl Ester
        TABLE 35 Distributors/Traders of Palm Methyl Ester by Region

Industry Major Market Players

  •  PG Worldwide Trade SDN BHD
  •  RITS
  •  LOL OleochemicalsSdn. Bhd.
  •  AM Biofuels Sdn Bhd.
  •  Green and Natural Sdn Bhd.
  •  Alternative Fuels Holdings Sdn Bhd
  •  On Biz Enterprise
  •  Pure Diesel Co. Ltd.
  •  BioinventSdn Bhd.
  •  International Source
  •  Natural Fuel PTE Ltd.
  •  Agricode Bio-Technology Pte Ltd.