Search Market Research Report

Discover Our Latest Reports
Discover Our Featured Reports
Discover Top Selling Reports

Paint Packaging Market Size, Share Global Analysis Report, 2020–2026

report img

Paint Packaging Market By Product Type (Bag-in-box, Pouches, Liquid Cartons, Paperboard Container, Pet Bottles, Cans, and Others), Material (Metals, Polyethylene (PE), Polypropylene (PP), Polyethylene Terephthalate (PET), and Others), and By End-Use (Professional, and Consumer): Global Industry Outlook, Market Size, Business Intelligence, Consumer Preferences, Statistical Surveys, Comprehensive Analysis, Historical Developments, Current Trends, and Forecast 2020–2026

Industry Insights

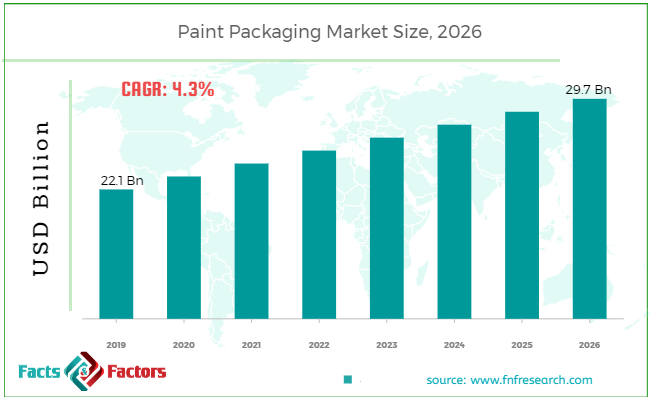
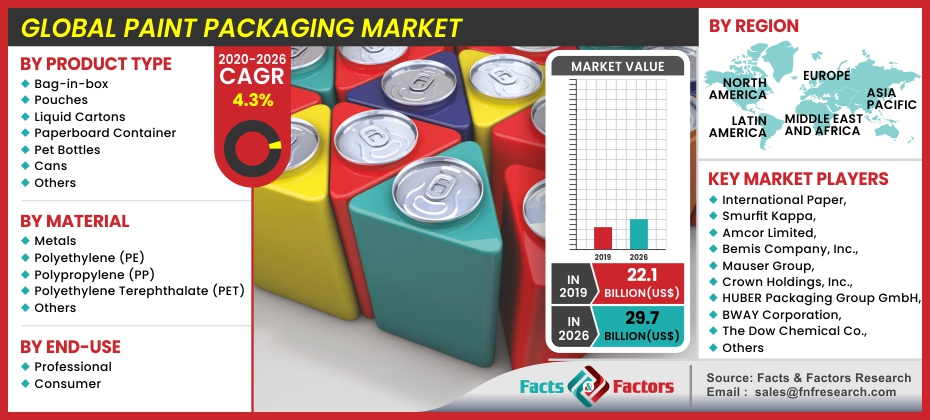
[185+ Pages Report] According to the report published by Facts Factors, the global paint packaging market size was worth around USD 22.1 billion in 2019 and is predicted to grow to around USD 29.7 billion by 2026 with a compound annual growth rate (CAGR) of roughly 4.3% between 2020 and 2026. The report analyzes the global paint packaging market drivers, restraints/challenges, and the effect they have on the demands during the projection period. In addition, the report explores emerging opportunities in the paint packaging market.

Paint Packaging Market Size

To know more about this report | Request Free Sample Copy

This specialized and expertise oriented industry research report scrutinizes the technical and commercial business outlook of the paint packaging industry. The report analyzes and declares the historical and current trends analysis of the paint packaging industry and subsequently recommends the projected trends anticipated to be observed in the paint packaging market during the upcoming years.


logoKey Insights from Primary Research

  • The global paint packaging market is anticipated to grow annually at a rate of around 4.3%
  • It was established through primary research that the market generated revenue of around USD 22.1 billion in 2019
  • The “Cans” category, based on product type segmentation, was the leading revenue-generating category in 2019
  • The “Metals” category, based on material segmentation, was the leading revenue-generating category in 2019
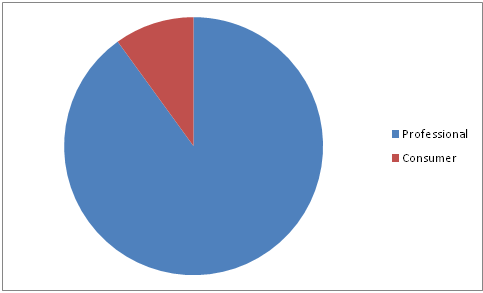
  • The “Professional” category, based on end-use segmentation, was the leading revenue-generating category in 2019

logoKey Recommendations from Analysts

  • The rising demand for paints from the global construction industry is driving the paint packaging market
  • The “Pouches” category based on product type segmentation is anticipated to be one of the fastest-growing categories in the forecast period
  • The “Polypropylene (PP)” category based on material segmentation is anticipated to be one of the fastest-growing categories in the forecast period
  • The “Consumer” category based on end-use segmentation is anticipated to be one of the fastest-growing categories in the forecast period
  • Asia Pacific region dominated the global paint packaging market in 2019 with a market share of more than 50%

logoGlobal Paint Packaging Market Share in 2019 – By End-Use

Paint Packaging Market

To know more about this report | Request Free Sample Copy


The paint packaging market report analyzes and notifies the industry statistics at the global as well as regional and country levels in order to acquire a thorough perspective of the entire paint packaging market. The historical and past insights are provided for FY 2016 to FY 2019 whereas projected trends are delivered for FY 2020 to FY 2026. The quantitative and numerical data is represented in terms of both volume (Kilo Tons) and value (USD Million) from FY 2016 – 2026.

Paint Packaging Market

To know more about this report | Request Free Sample Copy

The quantitative data is further underlined and reinforced by comprehensive qualitative data which comprises various across-the-board market dynamics. The rationales which directly or indirectly impact the paint packaging industry are exemplified through parameters such as growth drivers, restraints, challenges, and opportunities among other impacting factors.

Throughout our research report, we have encompassed all the proven models and tools of industry analysis and extensively illustrated all the key business strategies and business models adopted in the paint packaging industry. The report provides an all-inclusive and detailed competitive landscape prevalent in the paint packaging market.

The report utilizes established industry analysis tools and models such as Porter’s Five Forces framework to analyze and recognize critical business strategies adopted by various stakeholders involved in the entire value chain of the paint packaging industry. The paint packaging market report additionally employs SWOT analysis and PESTLE analysis models for further in-depth analysis.

The report study further includes an in-depth analysis of industry players' market shares and provides an overview of leading players' market position in the paint packaging sector. Key strategic developments in the paint packaging market competitive landscape such as acquisitions & mergers, inaugurations of different products and services, partnerships & joint ventures, MoU agreements, VC & funding activities, R&D activities, and geographic expansion among other noteworthy activities by key players of the paint packaging market are appropriately highlighted in the report.

The rising demand for paints from the global construction industry is driving the paint packaging market. The increasing use of paints for protecting exterior structures and buildings to protect them from tough environmental conditions is one of the reasons behind the growth of the paint packaging market.

Asia Pacific region dominated the global paint packaging market in 2019 with a market share of more than 50% and is anticipated to continue its dominance in the forecast years due to the rapidly growing construction industry in emerging countries such as India, China, and South Korea.

The paint packaging market research report delivers an acutevaluationand taxonomy of the paint packaging industry by practically splitting the market on the basis of different product types, materials,end-uses, and regions. Through the analysis of the historical and projected trends, all the segments and sub-segments were evaluated through the bottom-up approach, and different market sizes have been projected for FY 2020 to FY 2026.

logoReport Scope

Report Attribute

Details

Market Size in 2019

USD 22.1 Billion

Projected Market Size in 2026

USD 29.7 Billion

CAGR Growth Rate

4.3% CAGR

Base Year

2019

Forecast Years

2020-2026

Key Market Players

International Paper, Smurfit Kappa, Amcor Limited, Bemis Company, Inc., Mauser Group, Crown Holdings, Inc., HUBER Packaging Group GmbH, BWAY Corporation, The Dow Chemical Co., Tetra Pak International S.A., Mondi plc., WestRock Company, Orora Packaging Australia Pty Ltd, WestRock Company, Ball Corporation, RPC Superfos, PLZ Aeroscience, and Others

Key Segment

By Product, Material, End-Use, Applications, and Region

Major Regions Covered

North America, Europe, Asia Pacific, Latin America, and the Middle East & Africa

Purchase Options

Request customized purchase options to meet your research needs.Explore purchase options

The regional segmentation of the paint packaging industry includes the complete classification of all the major continents including North America, Latin America, Europe, Asia Pacific, and the Middle East & Africa. Further, country-wise data for the paint packaging industry is provided for the leading economies of the world.

The paint packaging market is segmented based on product type, material, and end-use. On the basis of product type segmentation, the market is classified into bag-in-box, pouches, liquid cartons, paperboard containers, pet bottles, cans, and others. In terms of material segmentation, the market is bifurcated into metals, Polyethylene (PE), Polypropylene (PP), Polyethylene Terephthalate (PET), and others. On the basis of end-use segmentation, the market is classified into professional, and consumer.

logoSome of the essential players operating in the paint packaging market, but not restricted to include

  •  Smurfit Kappa
  •  Amcor Limited
  •  Bemis Company, Inc.
  •  Mauser Group 
  •  Crown Holdings, Inc.
  •  HUBER Packaging Group GmbH
  •  BWAY Corporation
  •  The Dow Chemical Co.
  •  Tetra Pak International S.A.
  •  Mondi plc.
  •  WestRock Company
  •  Orora Packaging Australia Pty Ltd
  •  Ball Corporation
  •  RPC Superfos
  •  PLZ Aeroscience
  • International Paper

The taxonomy of the paint packaging market by its scope and segmentation is as follows:

logo By Product Type Segmentation Analysis

  • Bag-in-box
  • Pouches
  • Liquid Cartons
  • Paperboard Container
  • Pet Bottles
  • Cans
  • Others

logo By Material Segmentation Analysis

  • Metals
  • Polyethylene (PE)
  • Polypropylene (PP)
  • Polyethylene Terephthalate (PET)
  • Others

logo By End-Use Segmentation Analysis

  • Professional
  • Consumer

logo By Regional Segmentation Analysis

  • North America
    • The U.S.
    • Canada
  • Europe
    • Germany
    • The UK
    • France
    • Spain
    • Italy
    • Rest of Europe
  • Asia Pacific
    • China
    • Japan
    • India
    • South Korea
    • Southeast Asia
    • Rest of Asia Pacific
  • Latin America
    • Brazil
    • Mexico
    • Rest of Latin America
  • Middle East & Africa
    • GCC
    • South Africa
    • Rest of Middle East & Africa

Table of Content

  1. Chapter 1 Executive Summary
    1. 1.1. Introduction of Paint Packaging
    2. 1.2. Global Paint Packaging Market, 2019 & 2026 (USD Million)
    3. 1.3. Global Paint Packaging Market, 2016 – 2026 (USD Million) (Kilo Tons)
    4. 1.4. Global Paint Packaging Market Absolute Revenue Opportunity, 2016 – 2026 (USD Million)
    5. 1.5. Global Paint Packaging Market Incremental Revenue Opportunity, 2020 – 2026 (USD Million)
  2. Chapter 2 Paint Packaging Market – Product Type Analysis
    1. 2.1. Global Paint Packaging Market – Product Type Overview
    2. 2.2. Global Paint Packaging Market Share, by Product Type, 2019 & 2026 (USD Million)
    3. 2.3. Global Paint Packaging Market share, by Product Type, 2019 & 2026 (Kilo Tons)
    4. 2.4. Bag-in-box
      1. 2.4.1. Global Bag-in-box Paint Packaging Market, 2016 – 2026 (USD Million)
      2. 2.4.2. Global Bag-in-box Paint Packaging Market, 2016 – 2026 (Kilo Tons)
    5. 2.5. Pouches
      1. 2.5.1. Global Pouches Paint Packaging Market, 2016 – 2026 (USD Million)
      2. 2.5.2. Global Pouches Paint Packaging Market, 2016 – 2026 (Kilo Tons)
    6. 2.6. Liquid Cartons
      1. 2.6.1. Global Liquid Cartons Paint Packaging Market, 2016 – 2026 (USD Million)
      2. 2.6.2. Global Liquid Cartons Paint Packaging Market, 2016 – 2026 (Kilo Tons)
    7. 2.7. Paperboard Container
      1. 2.7.1. Global Paperboard Container Paint Packaging Market, 2016 – 2026 (USD Million)
      2. 2.7.2. Global Paperboard Container Paint Packaging Market, 2016 – 2026 (Kilo Tons)
    8. 2.8. Pet Bottles
      1. 2.8.1. Global Pet Bottles Paint Packaging Market, 2016 – 2026 (USD Million)
      2. 2.8.2. Global Pet Bottles Paint Packaging Market, 2016 – 2026 (Kilo Tons)
    9. 2.9. Cans
      1. 2.9.1. Global Cans Paint Packaging Market, 2016 – 2026 (USD Million)
      2. 2.9.2. Global Cans Paint Packaging Market, 2016 – 2026 (Kilo Tons)
    10. 2.10. Others
      1. 2.10.1. Global Others Paint Packaging Market, 2016 – 2026 (USD Million)
      2. 2.10.2. Global Others Paint Packaging Market, 2016 – 2026 (Kilo Tons)
  3. Chapter 3 Paint Packaging Market – Material Analysis
    1. 3.1. Global Paint Packaging Market – Material Overview
    2. 3.2. Global Paint Packaging Market Share, by Material, 2019 & 2026 (USD Million)
    3. 3.3. Global Paint Packaging Market share, by Material, 2019 & 2026 (Kilo Tons)
    4. 3.4. Metals
      1. 3.4.1. Global Metals Paint Packaging Market, 2016 – 2026 (USD Million)
      2. 3.4.2. Global Metals Paint Packaging Market, 2016 – 2026 (Kilo Tons)
    5. 3.5. Polyethylene (PE)
      1. 3.5.1. Global Polyethylene (PE) Paint Packaging Market, 2016 – 2026 (USD Million)
      2. 3.5.2. Global Polyethylene (PE) Paint Packaging Market, 2016 – 2026 (Kilo Tons)
    6. 3.6. Polypropylene (PP)
      1. 3.6.1. Global Polypropylene (PP) Paint Packaging Market, 2016 – 2026 (USD Million)
      2. 3.6.2. Global Polypropylene (PP) Paint Packaging Market, 2016 – 2026 (Kilo Tons)
    7. 3.7. Polyethylene Terephthalate (PET)
      1. 3.7.1. Global Polyethylene Terephthalate (PET) Paint Packaging Market, 2016 – 2026 (USD Million)
      2. 3.7.2. Global Polyethylene Terephthalate (PET) Paint Packaging Market, 2016 – 2026 (Kilo Tons)
    8. 3.8. Others
      1. 3.8.1. Global Others Paint Packaging Market, 2016 – 2026 (USD Million)
      2. 3.8.2. Global Others Paint Packaging Market, 2016 – 2026 (Kilo Tons)
  4. Chapter 4 Paint Packaging Market – End-Use Analysis
    1. 4.1. Global Paint Packaging Market – End-Use Overview
    2. 4.2. Global Paint Packaging Market Share, by End-Use, 2019 & 2026 (USD Million)
    3. 4.3. Global Paint Packaging Market share, by End-Use, 2019 & 2026 (Kilo Tons)
    4. 4.4. Professional
      1. 4.4.1. Global Professional Paint Packaging Market, 2016 – 2026 (USD Million)
      2. 4.4.2. Global Professional Paint Packaging Market, 2016 – 2026 (Kilo Tons)
    5. 4.5. Consumer
      1. 4.5.1. Global Consumer Paint Packaging Market, 2016 – 2026 (USD Million)
      2. 4.5.2. Global Consumer Paint Packaging Market, 2016 – 2026 (Kilo Tons)
  5. Chapter 5 Paint Packaging Market – Regional Analysis
    1. 5.1. Global Paint Packaging Market Regional Overview
    2. 5.2. Global Paint Packaging Market Share, by Region, 2019 & 2026 (USD Million)
    3. 5.3. Global Paint Packaging Market Share, by Region, 2019 & 2026 (Kilo Tons)
    4. 5.4. North America
      1. 5.4.1. North America Paint Packaging Market, 2016 – 2026 (USD Million)
        1. 5.4.1.1. North America Paint Packaging Market, by Country, 2016 – 2026 (USD Million)
      2. 5.4.2. North America Market, 2016 – 2026 (Kilo Tons)
        1. 5.4.2.1. North America Paint Packaging Market, by Country, 2016 – 2026 (Kilo Tons)
      3. 5.4.3. North America Paint Packaging Market, by Product Type, 2016 – 2026
        1. 5.4.3.1. North America Paint Packaging Market, by Product Type, 2016 – 2026 (USD Million)
        2. 5.4.3.2. North America Paint Packaging Market, by Product Type, 2016 – 2026 (Kilo Tons)
      4. 5.4.4. North America Paint Packaging Market, by Material, 2016 – 2026
        1. 5.4.4.1. North America Paint Packaging Market, by Material, 2016 – 2026 (USD Million)
        2. 5.4.4.2. North America Paint Packaging Market, by Material, 2016 – 2026 (Kilo Tons)
      5. 5.4.5. North America Paint Packaging Market, by End-Use, 2016 – 2026
        1. 5.4.5.1. North America Paint Packaging Market, by End-Use, 2016 – 2026 (USD Million)
        2. 5.4.5.2. North America Paint Packaging Market, by End-Use, 2016 – 2026 (Kilo Tons)
      6. 5.4.6. U.S.
        1. 5.4.6.1. U.S. Paint Packaging Market, 2016 – 2026 (USD Million)
        2. 5.4.6.2. U.S. Paint Packaging Market, 2016 – 2026 (Kilo Tons)
      7. 5.4.7. Canada
        1. 5.4.7.1. Canada Paint Packaging Market, 2016 – 2026 (USD Million)
        2. 5.4.7.2. Canada Paint Packaging Market, 2016 – 2026 (Kilo Tons)
    5. 5.5. Europe
      1. 5.5.1. Europe Paint Packaging Market, 2016 – 2026 (USD Million)
        1. 5.5.1.1. Europe Paint Packaging Market, by Country, 2016 – 2026 (USD Million)
      2. 5.5.2. Europe Market, 2016 – 2026 (Kilo Tons)
        1. 5.5.2.1. Europe Paint Packaging Market, by Country, 2016 – 2026 (Kilo Tons)
      3. 5.5.3. Europe Paint Packaging Market, by Product Type, 2016 – 2026
        1. 5.5.3.1. Europe Paint Packaging Market, by Product Type, 2016 – 2026 (USD Million)
        2. 5.5.3.2. Europe Paint Packaging Market, by Product Type, 2016 – 2026 (Kilo Tons)
      4. 5.5.4. Europe Paint Packaging Market, by Material, 2016 – 2026
        1. 5.5.4.1. Europe Paint Packaging Market, by Material, 2016 – 2026 (USD Million)
        2. 5.5.4.2. Europe Paint Packaging Market, by Material, 2016 – 2026 (Kilo Tons)
      5. 5.5.5. Europe Paint Packaging Market, by End-Use, 2016 – 2026
        1. 5.5.5.1. Europe Paint Packaging Market, by End-Use, 2016 – 2026 (USD Million)
        2. 5.5.5.2. Europe Paint Packaging Market, by End-Use, 2016 – 2026 (Kilo Tons)
      6. 5.5.6. Germany
        1. 5.5.6.1. Germany Paint Packaging Market, 2016 – 2026 (USD Million)
        2. 5.5.6.2. Germany Paint Packaging Market, 2016 – 2026 (Kilo Tons)
      7. 5.5.7. France
        1. 5.5.7.1. France Paint Packaging Market, 2016 – 2026 (USD Million)
        2. 5.5.7.2. France Paint Packaging Market, 2016 – 2026 (Kilo Tons)
      8. 5.5.8. U.K.
        1. 5.5.8.1. U.K. Paint Packaging Market, 2016 – 2026 (USD Million)
        2. 5.5.8.2. U.K. Paint Packaging Market, 2016 – 2026 (Kilo Tons)
      9. 5.5.9. Italy
        1. 5.5.9.1. Italy Paint Packaging Market, 2016 – 2026 (USD Million)
        2. 5.5.9.2. Italy Paint Packaging Market, 2016 – 2026 (Kilo Tons)
      10. 5.5.10. Spain
        1. 5.5.10.1. Spain Paint Packaging Market, 2016 – 2026 (USD Million)
        2. 5.5.10.2. Spain Paint Packaging Market, 2016 – 2026 (Kilo Tons)
      11. 5.5.11. Rest of Europe
        1. 5.5.11.1. Rest of Europe Paint Packaging Market, 2016 – 2026 (USD Million)
        2. 5.5.11.2. Rest of Europe Paint Packaging Market, 2016 – 2026 (Kilo Tons)
    6. 5.6. Asia Pacific
      1. 5.6.1. Asia Pacific Paint Packaging Market, 2016 – 2026 (USD Million)
        1. 5.6.1.1. Asia Pacific Paint Packaging Market, by Country, 2016 – 2026 (USD Million)
      2. 5.6.2. Asia Pacific Market, 2016 – 2026 (Kilo Tons)
        1. 5.6.2.1. Asia Pacific Paint Packaging Market, by Country, 2016 – 2026 (Kilo Tons)
      3. 5.6.3. Asia Pacific Paint Packaging Market, by Product Type, 2016 – 2026
        1. 5.6.3.1. Asia Pacific Paint Packaging Market, by Product Type, 2016 – 2026 (USD Million)
        2. 5.6.3.2. Asia Pacific Paint Packaging Market, by Product Type, 2016 – 2026 (Kilo Tons)
      4. 5.6.4. Asia Pacific Paint Packaging Market, by Material, 2016 – 2026
        1. 5.6.4.1. Asia Pacific Paint Packaging Market, by Material, 2016 – 2026 (USD Million)
        2. 5.6.4.2. Asia Pacific Paint Packaging Market, by Material, 2016 – 2026 (Kilo Tons)
      5. 5.6.5. Asia Pacific Paint Packaging Market, by End-Use, 2016 – 2026
        1. 5.6.5.1. Asia Pacific Paint Packaging Market, by End-Use, 2016 – 2026 (USD Million)
        2. 5.6.5.2. Asia Pacific Paint Packaging Market, by End-Use, 2016 – 2026 (Kilo Tons)
      6. 5.6.6. China
        1. 5.6.6.1. China Paint Packaging Market, 2016 – 2026 (USD Million)
        2. 5.6.6.2. China Paint Packaging Market, 2016 – 2026 (Kilo Tons)
      7. 5.6.7. Japan
        1. 5.6.7.1. Japan Paint Packaging Market, 2016 – 2026 (USD Million)
        2. 5.6.7.2. Japan Paint Packaging Market, 2016 – 2026 (Kilo Tons)
      8. 5.6.8. India
        1. 5.6.8.1. India Paint Packaging Market, 2016 – 2026 (USD Million)
        2. 5.6.8.2. India Paint Packaging Market, 2016 – 2026 (Kilo Tons)
      9. 5.6.9. South Korea
        1. 5.6.9.1. South Korea Paint Packaging Market, 2016 – 2026 (USD Million)
        2. 5.6.9.2. South Korea Paint Packaging Market, 2016 – 2026 (Kilo Tons)
      10. 5.6.10. South-East Asia
        1. 5.6.10.1. South-East Asia Paint Packaging Market, 2016 – 2026 (USD Million)
        2. 5.6.10.2. South-East Asia Paint Packaging Market, 2016 – 2026 (Kilo Tons)
      11. 5.6.11. Rest of Asia Pacific
        1. 5.6.11.1. Rest of Asia Pacific Paint Packaging Market, 2016 – 2026 (USD Million)
        2. 5.6.11.2. Rest of Asia Pacific Paint Packaging Market, 2016 – 2026 (Kilo Tons)
    7. 5.7. Latin America
      1. 5.7.1. Latin America Paint Packaging Market, 2016 – 2026 (USD Million)
        1. 5.7.1.1. Latin America Paint Packaging Market, by Country, 2016 – 2026 (USD Million)
      2. 5.7.2. Latin America Market, 2016 – 2026 (Kilo Tons)
        1. 5.7.2.1. Latin America Paint Packaging Market, by Country, 2016 – 2026 (Kilo Tons)
      3. 5.7.3. Latin America Paint Packaging Market, by Product Type, 2016 – 2026
        1. 5.7.3.1. Latin America Paint Packaging Market, by Product Type, 2016 – 2026 (USD Million)
        2. 5.7.3.2. Latin America Paint Packaging Market, by Product Type, 2016 – 2026 (Kilo Tons)
      4. 5.7.4. Latin America Paint Packaging Market, by Material, 2016 – 2026
        1. 5.7.4.1. Latin America Paint Packaging Market, by Material, 2016 – 2026 (USD Million)
        2. 5.7.4.2. Latin America Paint Packaging Market, by Material, 2016 – 2026 (Kilo Tons)
      5. 5.7.5. Latin America Paint Packaging Market, by End-Use, 2016 – 2026
        1. 5.7.5.1. Latin America Paint Packaging Market, by End-Use, 2016 – 2026 (USD Million)
        2. 5.7.5.2. Latin America Paint Packaging Market, by End-Use, 2016 – 2026 (Kilo Tons)
      6. 5.7.6. Brazil
        1. 5.7.6.1. Brazil Paint Packaging Market, 2016 – 2026 (USD Million)
        2. 5.7.6.2. Brazil Paint Packaging Market, 2016 – 2026 (Kilo Tons)
      7. 5.7.7. Mexico
        1. 5.7.7.1. Mexico Paint Packaging Market, 2016 – 2026 (USD Million)
        2. 5.7.7.2. Mexico Paint Packaging Market, 2016 – 2026 (Kilo Tons)
      8. 5.7.8. Rest of Latin America
        1. 5.7.8.1. Rest of Latin America Paint Packaging Market, 2016 – 2026 (USD Million)
        2. 5.7.8.2. Rest of Latin America Paint Packaging Market, 2016 – 2026 (Kilo Tons)
    8. 5.8. The Middle-East and Africa
      1. 5.8.1. The Middle-East and Africa Paint Packaging Market, 2016 – 2026 (USD Million)
        1. 5.8.1.1. The Middle-East and Africa Paint Packaging Market, by Country, 2016 – 2026 (USD Million)
      2. 5.8.2. The Middle-East and Africa Market, 2016 – 2026 (Kilo Tons)
        1. 5.8.2.1. The Middle-East and Africa Paint Packaging Market, by Country, 2016 – 2026 (Kilo Tons)
      3. 5.8.3. The Middle-East and Africa Paint Packaging Market, by Product Type, 2016 – 2026
        1. 5.8.3.1. The Middle-East and Africa Paint Packaging Market, by Product Type, 2016 – 2026 (USD Million)
        2. 5.8.3.2. The Middle-East and Africa Paint Packaging Market, by Product Type, 2016 – 2026 (Kilo Tons)
      4. 5.8.4. The Middle-East and Africa Paint Packaging Market, by Material, 2016 – 2026
        1. 5.8.4.1. The Middle-East and Africa Paint Packaging Market, by Material, 2016 – 2026 (USD Million)
        2. 5.8.4.2. The Middle-East and Africa Paint Packaging Market, by Material, 2016 – 2026 (Kilo Tons)
      5. 5.8.5. The Middle-East and Africa Paint Packaging Market, by End-Use, 2016 – 2026
        1. 5.8.5.1. The Middle-East and Africa Paint Packaging Market, by End-Use, 2016 – 2026 (USD Million)
        2. 5.8.5.2. The Middle-East and Africa Paint Packaging Market, by End-Use, 2016 – 2026 (Kilo Tons)
      6. 5.8.6. GCC Countries
        1. 5.8.6.1. GCC Countries Paint Packaging Market, 2016 – 2026 (USD Million)
        2. 5.8.6.2. GCC Countries Paint Packaging Market, 2016 – 2026 (Kilo Tons)
      7. 5.8.7. South Africa
        1. 5.8.7.1. South Africa Paint Packaging Market, 2016 – 2026 (USD Million)
        2. 5.8.7.2. South Africa Paint Packaging Market, 2016 – 2026 (Kilo Tons)
      8. 5.8.8. Rest of Middle-East Africa
        1. 5.8.8.1. Rest of Middle-East Africa Paint Packaging Market, 2016 – 2026 (USD Million)
        2. 5.8.8.2. Rest of Middle-East Africa Paint Packaging Market, 2016 – 2026 (Kilo Tons)
  6. Chapter 6 Paint Packaging Production, Consumption, Export, Import by Regions
    1. 6.1. Global Paint Packaging Production and Consumption, 2016 – 2026 (Kilo Tons)
    2. 6.2. Global Import and Export Analysis, by Region
  7. Chapter 7 Paint Packaging Market – Competitive Landscape
    1. 7.1. Competitor Market Share – Revenue
    2. 7.2. Market Concentration Rate Analysis, Top 3 and Top 5 Players
    3. 7.3. Competitor Market Share – Volume
    4. 7.4. Strategic Developments
      1. 7.4.1. Acquisitions and Mergers
      2. 7.4.2. New Products
      3. 7.4.3. Research & Development Activities
  8. Chapter 8 Company Profiles
    1. 8.1. The Dow Chemical Co.
      1. 8.1.1. Company Overview
      2. 8.1.2. Product/Service Portfolio
      3. 8.1.3. The Dow Chemical Co. Sales, Revenue, Price, and Gross Margin
      4. 8.1.4. The Dow Chemical Co. Revenue and Growth Rate
      5. 8.1.5. The Dow Chemical Co. Market Share
      6. 8.1.6. Recent Initiatives, Funding/VC Activities, and Technological Innovations
    2. 8.2. International Paper
      1. 8.2.1. Company Overview
      2. 8.2.2. Product/Service Portfolio
      3. 8.2.3. International Paper Sales, Revenue, Price, and Gross Margin
      4. 8.2.4. International Paper Revenue and Growth Rate
      5. 8.2.5. International Paper Market Share
      6. 8.2.6. Recent Initiatives, Funding/VC Activities, and Technological Innovations
    3. 8.3. Tetra Pak International S.A.
      1. 8.3.1. Company Overview
      2. 8.3.2. Product/Service Portfolio
      3. 8.3.3. Tetra Pak International S.A. Sales, Revenue, Price, and Gross Margin
      4. 8.3.4. Tetra Pak International S.A. Revenue and Growth Rate
      5. 8.3.5. Tetra Pak International S.A. Market Share
      6. 8.3.6. Recent Initiatives, Funding/VC Activities, and Technological Innovations
    4. 8.4. Smurfit Kappa
      1. 8.4.1. Company Overview
      2. 8.4.2. Product/Service Portfolio
      3. 8.4.3. Smurfit Kappa Sales, Revenue, Price, and Gross Margin
      4. 8.4.4. Smurfit Kappa Revenue and Growth Rate
      5. 8.4.5. Smurfit Kappa Market Share
      6. 8.4.6. Recent Initiatives, Funding/VC Activities, and Technological Innovations
    5. 8.5. Mondi plc.
      1. 8.5.1. Company Overview
      2. 8.5.2. Product/Service Portfolio
      3. 8.5.3. Mondi plc. Sales, Revenue, Price, and Gross Margin
      4. 8.5.4. Mondi plc. Revenue and Growth Rate
      5. 8.5.5. Mondi plc. Market Share
      6. 8.5.6. Recent Initiatives, Funding/VC Activities, and Technological Innovations
    6. 8.6. Amcor Limited
      1. 8.6.1. Company Overview
      2. 8.6.2. Product/Service Portfolio
      3. 8.6.3. Amcor Limited Sales, Revenue, Price, and Gross Margin
      4. 8.6.4. Amcor Limited Revenue and Growth Rate
      5. 8.6.5. Amcor Limited Market Share
      6. 8.6.6. Recent Initiatives, Funding/VC Activities, and Technological Innovations
    7. 8.7. WestRock Company
      1. 8.7.1. Company Overview
      2. 8.7.2. Product/Service Portfolio
      3. 8.7.3. WestRock Company Sales, Revenue, Price, and Gross Margin
      4. 8.7.4. WestRock Company Revenue and Growth Rate
      5. 8.7.5. WestRock Company Market Share
      6. 8.7.6. Recent Initiatives, Funding/VC Activities, and Technological Innovations
    8. 8.8. Bemis Company, Inc.
      1. 8.8.1. Company Overview
      2. 8.8.2. Product/Service Portfolio
      3. 8.8.3. Bemis Company, Inc. Sales, Revenue, Price, and Gross Margin
      4. 8.8.4. Bemis Company, Inc. Revenue and Growth Rate
      5. 8.8.5. Bemis Company, Inc. Market Share
      6. 8.8.6. Recent Initiatives, Funding/VC Activities, and Technological Innovations
    9. 8.9. Orora Packaging Australia Pty Ltd
      1. 8.9.1. Company Overview
      2. 8.9.2. Product/Service Portfolio
      3. 8.9.3. Orora Packaging Australia Pty Ltd Sales, Revenue, Price, and Gross Margin
      4. 8.9.4. Orora Packaging Australia Pty Ltd Revenue and Growth Rate
      5. 8.9.5. Orora Packaging Australia Pty Ltd Market Share
      6. 8.9.6. Recent Initiatives, Funding/VC Activities, and Technological Innovations
    10. 8.10. Mauser Group
      1. 8.10.1. Company Overview
      2. 8.10.2. Product/Service Portfolio
      3. 8.10.3. Mauser Group Sales, Revenue, Price, and Gross Margin
      4. 8.10.4. Mauser Group Revenue and Growth Rate
      5. 8.10.5. Mauser Group Market Share
      6. 8.10.6. Recent Initiatives, Funding/VC Activities, and Technological Innovations
    11. 8.11. WestRock Company
      1. 8.11.1. Company Overview
      2. 8.11.2. Product/Service Portfolio
      3. 8.11.3. WestRock Company Sales, Revenue, Price, and Gross Margin
      4. 8.11.4. WestRock Company Revenue and Growth Rate
      5. 8.11.5. WestRock Company Market Share
      6. 8.11.6. Recent Initiatives, Funding/VC Activities, and Technological Innovations
    12. 8.12. Ball Corporation
      1. 8.12.1. Company Overview
      2. 8.12.2. Product/Service Portfolio
      3. 8.12.3. Ball Corporation Sales, Revenue, Price, and Gross Margin
      4. 8.12.4. Ball Corporation Revenue and Growth Rate
      5. 8.12.5. Ball Corporation Market Share
      6. 8.12.6. Recent Initiatives, Funding/VC Activities, and Technological Innovations
    13. 8.13. Crown Holdings, Inc.
      1. 8.13.1. Company Overview
      2. 8.13.2. Product/Service Portfolio
      3. 8.13.3. Crown Holdings, Inc. Sales, Revenue, Price, and Gross Margin
      4. 8.13.4. Crown Holdings, Inc. Revenue and Growth Rate
      5. 8.13.5. Crown Holdings, Inc. Market Share
      6. 8.13.6. Recent Initiatives, Funding/VC Activities, and Technological Innovations
    14. 8.14. RPC Superfos
      1. 8.14.1. Company Overview
      2. 8.14.2. Product/Service Portfolio
      3. 8.14.3. RPC Superfos Sales, Revenue, Price, and Gross Margin
      4. 8.14.4. RPC Superfos Revenue and Growth Rate
      5. 8.14.5. RPC Superfos Market Share
      6. 8.14.6. Recent Initiatives, Funding/VC Activities, and Technological Innovations
    15. 8.15. HUBER Packaging Group GmbH
      1. 8.15.1. Company Overview
      2. 8.15.2. Product/Service Portfolio
      3. 8.15.3. HUBER Packaging Group GmbH Sales, Revenue, Price, and Gross Margin
      4. 8.15.4. HUBER Packaging Group GmbH Revenue and Growth Rate
      5. 8.15.5. HUBER Packaging Group GmbH Market Share
      6. 8.15.6. Recent Initiatives, Funding/VC Activities, and Technological Innovations
    16. 8.16. PLZ Aeroscience
      1. 8.16.1. Company Overview
      2. 8.16.2. Product/Service Portfolio
      3. 8.16.3. PLZ Aeroscience Sales, Revenue, Price, and Gross Margin
      4. 8.16.4. PLZ Aeroscience Revenue and Growth Rate
      5. 8.16.5. PLZ Aeroscience Market Share
      6. 8.16.6. Recent Initiatives, Funding/VC Activities, and Technological Innovations
    17. 8.17. BWAY Corporation
      1. 8.17.1. Company Overview
      2. 8.17.2. Product/Service Portfolio
      3. 8.17.3. BWAY Corporation Sales, Revenue, Price, and Gross Margin
      4. 8.17.4. BWAY Corporation Revenue and Growth Rate
      5. 8.17.5. BWAY Corporation Market Share
      6. 8.17.6. Recent Initiatives, Funding/VC Activities, and Technological Innovations
  9. Chapter 9 Paint Packaging — Industry Analysis
    1. 9.1. Introduction and Taxonomy
    2. 9.2. Paint Packaging Market – Key Trends
      1. 9.2.1. Market Drivers
      2. 9.2.2. Market Restraints
      3. 9.2.3. Market Opportunities
    3. 9.3. Value Chain Analysis
    4. 9.4. Key Mandates and Regulations
    5. 9.5. Technology Roadmap and Timeline
    6. 9.6. Paint Packaging Market – Attractiveness Analysis
      1. 9.6.1. By Product Type
      2. 9.6.2. By Material
      3. 9.6.3. By End-Use
      4. 9.6.4. By Region
  10. Chapter 10 Raw Material Analysis
    1. 10.1. Paint Packaging Key Raw Material Analysis
      1. 10.1.1. Key Raw Materials
      2. 10.1.2. Price Trend of Key Raw Materials
    2. 10.2. Key Suppliers of Raw Materials
    3. 10.3. Proportion of Manufacturing Cost Structure
      1. 10.3.1. Raw Materials Cost
      2. 10.3.2. Labor Cost
      3. 10.3.3. Manufacturing Expenses
      4. 10.3.4. Miscellaneous Expenses
    4. 10.4. Manufacturing Cost Analysis of Paint Packaging
  11. Chapter 11 Industrial Chain, Sourcing Strategy, and Downstream Buyers
    1. 11.1. Paint Packaging Industrial Chain Analysis
    2. 11.2. Upstream Raw Materials Sourcing
      1. 11.2.1. Risk Mitigation:
      2. 11.2.2. Supplier Relationships:
      3. 11.2.3. Business Processes:
      4. 11.2.4. Securing the Product:
    3. 11.3. Raw Materials Sources of Paint Packaging Major Manufacturers
    4. 11.4. Downstream Buyers
    5. 11.5. Distributors/Traders List
  12. Chapter 12 Marketing Strategy Analysis, Distributors
    1. 12.1. Marketing Channel
    2. 12.2. Direct Marketing
    3. 12.3. Indirect Marketing
    4. 12.4. Marketing Channel Development Trends
    5. 12.5. Economic/Political Environmental Change
  13. Chapter 13 Report Conclusion & Key Insights
    1. 13.1. Key Insights from Primary Interviews & Surveys Respondents
    2. 13.2. Key Takeaways from Analysts, Consultants, and Industry Leaders
  14. Chapter 14 Research Approach & Methodology
    1. 14.1. Report Description
    2. 14.2. Research Scope
    3. 14.3. Research Methodology
      1. 14.3.1. Secondary Research
      2. 14.3.2. Primary Research
      3. 14.3.3. Statistical Models
        1. 14.3.3.1. Company Share Analysis Model
        2. 14.3.3.2. Revenue Based Modeling
      4. 14.3.4. Research Limitations

      List of Figures

      Fig.1 Product Picture of Paint Packaging
      Fig.2 Global Paint Packaging Market, 2016 – 2026 (USD Million)
      Fig.3 Global Paint Packaging Market, 2016 – 2026 (Kilo Tons)
      Fig.4 Global Paint Packaging Market Absolute Revenue Opportunity, 2016 – 2026 (USD Million)
      Fig.5 Global Paint Packaging Market Incremental Revenue Opportunity, 2020 – 2026 (USD Million)
      Fig.6 Global Paint Packaging Market Share, by Product Type, 2019 & 2026 (USD Million)
      Fig.7 Global Paint Packaging Market Share, by Product Type, 2019 & 2026 (Kilo Tons)
      Fig.8 Global Bag-in-box Paint Packaging Market, 2016 – 2026 (USD Million)
      Fig.9 Global Bag-in-box Paint Packaging Market, 2016 – 2026 (Kilo Tons)
      Fig.10 Global Pouches Paint Packaging Market, 2016 – 2026 (USD Million)
      Fig.11 Global Pouches Paint Packaging Market, 2016 – 2026 (Kilo Tons)
      Fig.12 Global Liquid Cartons Paint Packaging Market, 2016 – 2026 (USD Million)
      Fig.13 Global Liquid Cartons Paint Packaging Market, 2016 – 2026 (Kilo Tons)
      Fig.14 Global Paperboard Container Paint Packaging Market, 2016 – 2026 (USD Million)
      Fig.15 Global Paperboard Container Paint Packaging Market, 2016 – 2026 (Kilo Tons)
      Fig.16 Global Pet Bottles Paint Packaging Market, 2016 – 2026 (USD Million)
      Fig.17 Global Pet Bottles Paint Packaging Market, 2016 – 2026 (Kilo Tons)
      Fig.18 Global Cans Paint Packaging Market, 2016 – 2026 (USD Million)
      Fig.19 Global Cans Paint Packaging Market, 2016 – 2026 (Kilo Tons)
      Fig.20 Global Others Paint Packaging Market, 2016 – 2026 (USD Million)
      Fig.21 Global Others Paint Packaging Market, 2016 – 2026 (Kilo Tons)
      Fig.22 Global Paint Packaging Market Share, by Material, 2019 & 2026 (USD Million)
      Fig.23 Global Paint Packaging Market Share, by Material, 2019 & 2026 (Kilo Tons)
      Fig.24 Global Metals Paint Packaging Market, 2016 – 2026 (USD Million)
      Fig.25 Global Metals Paint Packaging Market, 2016 – 2026 (Kilo Tons)
      Fig.26 Global Polyethylene (PE) Paint Packaging Market, 2016 – 2026 (USD Million)
      Fig.27 Global Polyethylene (PE) Paint Packaging Market, 2016 – 2026 (Kilo Tons)
      Fig.28 Global Polypropylene (PP) Paint Packaging Market, 2016 – 2026 (USD Million)
      Fig.29 Global Polypropylene (PP) Paint Packaging Market, 2016 – 2026 (Kilo Tons)
      Fig.30 Global Polyethylene Terephthalate (PET) Paint Packaging Market, 2016 – 2026 (USD Million)
      Fig.31 Global Polyethylene Terephthalate (PET) Paint Packaging Market, 2016 – 2026 (Kilo Tons)
      Fig.32 Global Others Paint Packaging Market, 2016 – 2026 (USD Million)
      Fig.33 Global Others Paint Packaging Market, 2016 – 2026 (Kilo Tons)
      Fig.34 Global Paint Packaging Market Share, by End-Use, 2019 & 2026 (USD Million)
      Fig.35 Global Paint Packaging Market Share, by End-Use, 2019 & 2026 (Kilo Tons)
      Fig.36 Global Professional Paint Packaging Market, 2016 – 2026 (USD Million)
      Fig.37 Global Professional Paint Packaging Market, 2016 – 2026 (Kilo Tons)
      Fig.38 Global Consumer Paint Packaging Market, 2016 – 2026 (USD Million)
      Fig.39 Global Consumer Paint Packaging Market, 2016 – 2026 (Kilo Tons)
      Fig.40 Global Paint Packaging Market Share, by Region, 2019 & 2026 (USD Million)
      Fig.41 Global Paint Packaging Market Share, by Region, 2019 & 2026 (Kilo Tons)
      Fig.42 North America Paint Packaging Market, 2016 – 2026 (USD Million)
      Fig.43 North America Paint Packaging Market, 2016 – 2026 (Kilo Tons)
      Fig.44 U.S. Paint Packaging Market, 2016 – 2026 (USD Million)
      Fig.45 U.S. Paint Packaging  Market, 2016 – 2026 (Kilo Tons)
      Fig.46 Canada Paint Packaging Market, 2016 – 2026 (USD Million)
      Fig.47 Canada Paint Packaging  Market, 2016 – 2026 (Kilo Tons)
      Fig.48 Europe Paint Packaging Market, 2016 – 2026 (USD Million)
      Fig.49 Europe Paint Packaging Market, 2016 – 2026 (Kilo Tons)
      Fig.50 Germany Paint Packaging Market, 2016 – 2026 (USD Million)
      Fig.51 Germany Paint Packaging  Market, 2016 – 2026 (Kilo Tons)
      Fig.52 France Paint Packaging Market, 2016 – 2026 (USD Million)
      Fig.53 France Paint Packaging  Market, 2016 – 2026 (Kilo Tons)
      Fig.54 U.K. Paint Packaging Market, 2016 – 2026 (USD Million)
      Fig.55 U.K. Paint Packaging  Market, 2016 – 2026 (Kilo Tons)
      Fig.56 Italy Paint Packaging Market, 2016 – 2026 (USD Million)
      Fig.57 Italy Paint Packaging  Market, 2016 – 2026 (Kilo Tons)
      Fig.58 Spain Paint Packaging Market, 2016 – 2026 (USD Million)
      Fig.59 Spain Paint Packaging  Market, 2016 – 2026 (Kilo Tons)
      Fig.60 Rest of Europe Paint Packaging Market, 2016 – 2026 (USD Million)
      Fig.61 Rest of Europe Paint Packaging  Market, 2016 – 2026 (Kilo Tons)
      Fig.62 Asia Pacific Paint Packaging Market, 2016 – 2026 (USD Million)
      Fig.63 Asia Pacific Paint Packaging Market, 2016 – 2026 (Kilo Tons)
      Fig.64 China Paint Packaging Market, 2016 – 2026 (USD Million)
      Fig.65 China Paint Packaging  Market, 2016 – 2026 (Kilo Tons)
      Fig.66 Japan Paint Packaging Market, 2016 – 2026 (USD Million)
      Fig.67 Japan Paint Packaging  Market, 2016 – 2026 (Kilo Tons)
      Fig.68 India Paint Packaging Market, 2016 – 2026 (USD Million)
      Fig.69 India Paint Packaging  Market, 2016 – 2026 (Kilo Tons)
      Fig.70 South  Korea Paint Packaging Market, 2016 – 2026 (USD Million)
      Fig.71 South  Korea Paint Packaging  Market, 2016 – 2026 (Kilo Tons)
      Fig.72 South-East Asia Paint Packaging Market, 2016 – 2026 (USD Million)
      Fig.73 South-East Asia Paint Packaging  Market, 2016 – 2026 (Kilo Tons)
      Fig.74 Rest of Asia Pacific Paint Packaging Market, 2016 – 2026 (USD Million)
      Fig.75 Rest of Asia Pacific Paint Packaging  Market, 2016 – 2026 (Kilo Tons)
      Fig.76 Latin America Paint Packaging Market, 2016 – 2026 (USD Million)
      Fig.77 Latin America Paint Packaging Market, 2016 – 2026 (Kilo Tons)
      Fig.78 Brazil Paint Packaging Market, 2016 – 2026 (USD Million)
      Fig.79 Brazil Paint Packaging  Market, 2016 – 2026 (Kilo Tons)
      Fig.80 Mexico Paint Packaging Market, 2016 – 2026 (USD Million)
      Fig.81 Mexico Paint Packaging  Market, 2016 – 2026 (Kilo Tons)
      Fig.82 Rest of Latin America Paint Packaging Market, 2016 – 2026 (USD Million)
      Fig.83 Rest of Latin America Paint Packaging  Market, 2016 – 2026 (Kilo Tons)
      Fig.84 The Middle-East and Africa Paint Packaging Market, 2016 – 2026 (USD Million)
      Fig.85 The Middle-East and Africa Paint Packaging Market, 2016 – 2026 (Kilo Tons)
      Fig.86 GCC Countries Paint Packaging Market, 2016 – 2026 (USD Million)
      Fig.87 GCC Countries Paint Packaging  Market, 2016 – 2026 (Kilo Tons)
      Fig.88 South Africa Paint Packaging Market, 2016 – 2026 (USD Million)
      Fig.89 South Africa Paint Packaging  Market, 2016 – 2026 (Kilo Tons)
      Fig.90 Rest of Middle-East Africa Paint Packaging Market, 2016 – 2026 (USD Million)
      Fig.91 Rest of Middle-East Africa Paint Packaging  Market, 2016 – 2026 (Kilo Tons)
      Fig.92 Global Paint Packaging Production and Consumption, 2016 – 2026 (Kilo Tons)
      Fig.93 North America Paint Packaging Production and Consumption, 2016 – 2026 (USD Million) (Kilo Tons)
      Fig.94 Europe Paint Packaging Production and Consumption, 2016 – 2026 (USD Million) (Kilo Tons)
      Fig.95 Asia Pacific Paint Packaging Production and Consumption, 2016 – 2026 (USD Million) (Kilo Tons)
      Fig.96 Latin America Paint Packaging Production and Consumption, 2016 – 2026 (USD Million) (Kilo Tons)
      Fig.97 The Middle-East and Africa Paint Packaging Production and Consumption, 2016 – 2026 (USD Million) (Kilo Tons)
      Fig.98 Competitor Market Share – Revenue
      Fig.99 Competitor Market Share – Volume
      Fig.100 The Dow Chemical Co. Revenue and Growth Rate
      Fig.101 The Dow Chemical Co. Market Share
      Fig.102 International Paper Revenue and Growth Rate
      Fig.103 International Paper Market Share
      Fig.104 Tetra Pak International S.A. Revenue and Growth Rate
      Fig.105 Tetra Pak International S.A. Market Share
      Fig.106 Smurfit Kappa Revenue and Growth Rate
      Fig.107 Smurfit Kappa Market Share
      Fig.108 Mondi plc. Revenue and Growth Rate
      Fig.109 Mondi plc. Market Share
      Fig.110 Amcor Limited Revenue and Growth Rate
      Fig.111 Amcor Limited Market Share
      Fig.112 WestRock Company Revenue and Growth Rate
      Fig.113 WestRock Company Market Share
      Fig.114 Bemis Company, Inc. Revenue and Growth Rate
      Fig.115 Bemis Company, Inc. Market Share
      Fig.116 Orora Packaging Australia Pty Ltd Revenue and Growth Rate
      Fig.117 Orora Packaging Australia Pty Ltd Market Share
      Fig.118 Mauser Group Revenue and Growth Rate
      Fig.119 Mauser Group Market Share
      Fig.120 WestRock Company Revenue and Growth Rate
      Fig.121 WestRock Company Market Share
      Fig.122 Ball Corporation Revenue and Growth Rate
      Fig.123 Ball Corporation Market Share
      Fig.124 Crown Holdings, Inc. Revenue and Growth Rate
      Fig.125 Crown Holdings, Inc. Market Share
      Fig.126 RPC Superfos Revenue and Growth Rate
      Fig.127 RPC Superfos Market Share
      Fig.128 HUBER Packaging Group GmbH Revenue and Growth Rate
      Fig.129 HUBER Packaging Group GmbH Market Share
      Fig.130 PLZ Aeroscience Revenue and Growth Rate
      Fig.131 PLZ Aeroscience Market Share
      Fig.132 BWAY Corporation Revenue and Growth Rate
      Fig.133 BWAY Corporation Market Share
      Fig.134 Market Dynamics
      Fig.135 Global Paint Packaging – Value Chain Analysis
      Fig.136 Key Mandates and Regulations
      Fig.137 Technology Roadmap and Timeline
      Fig.138 Market Attractiveness Analysis – By Product Type
      Fig.139 Market Attractiveness Analysis – By Material
      Fig.140 Market Attractiveness Analysis – By End-Use
      Fig.141 Market Attractiveness Analysis – By Region
      Fig.142 Manufacturing Cost Structure of Paint Packaging
      Fig.143 Paint Packaging Industrial Chain Analysis
      Fig.144 Market Channels
      Fig.145 Marketing Channel Development Trend
      Fig.146 Growth in World Gross Product, 2008-2018
      

      List of Tables

      Table 1 Global Paint Packaging Market, 2019 & 2026 (USD Million)
      Table 2 Global Paint Packaging Market, by Product Type, 2016 – 2026 (USD Million)
      Table 3 Global Paint Packaging Market, by Product Type, 2016 – 2026 (Kilo Tons)
      Table 4 Global Paint Packaging Market, by Material, 2016 – 2026 (USD Million)
      Table 5 Global Paint Packaging Market, by Material, 2016 – 2026 (Kilo Tons)
      Table 6 Global Paint Packaging Market, by End-Use, 2016 – 2026 (USD Million)
      Table 7 Global Paint Packaging Market, by End-Use, 2016 – 2026 (Kilo Tons)
      Table 8 Global Paint Packaging Market, by Region, 2016 – 2026 (USD Million)
      Table 9 Global Paint Packaging Market, by Region, 2016 – 2026 (Kilo Tons)
      Table 10 North America Paint Packaging Market, by Country, 2016 – 2026 (USD Million)
      Table 11 North America Paint Packaging Market, by Country, 2016 – 2026 (Kilo Tons)
      Table 12 North America Paint Packaging Market, by Product Type, 2016 – 2026 (USD Million)
      Table 13 North America Paint Packaging Market, by Product Type, 2016 – 2026 (Kilo Tons)
      Table 14 North America Paint Packaging Market, by Material, 2016 – 2026 (USD Million)
      Table 15 North America Paint Packaging Market, by Material, 2016 – 2026 (Kilo Tons)
      Table 16 North America Paint Packaging Market, by End-Use, 2016 – 2026 (USD Million)
      Table 17 North America Paint Packaging Market, by End-Use, 2016 – 2026 (Kilo Tons)
      Table 18 Europe Paint Packaging Market, by Country, 2016 – 2026 (USD Million)
      Table 19 Europe Paint Packaging Market, by Country, 2016 – 2026 (Kilo Tons)
      Table 20 Europe Paint Packaging Market, by Product Type, 2016 – 2026 (USD Million)
      Table 21 Europe Paint Packaging Market, by Product Type, 2016 – 2026 (Kilo Tons)
      Table 22 Europe Paint Packaging Market, by Material, 2016 – 2026 (USD Million)
      Table 23 Europe Paint Packaging Market, by Material, 2016 – 2026 (Kilo Tons)
      Table 24 Europe Paint Packaging Market, by End-Use, 2016 – 2026 (USD Million)
      Table 25 Europe Paint Packaging Market, by End-Use, 2016 – 2026 (Kilo Tons)
      Table 26 Asia Pacific Paint Packaging Market, by Country, 2016 – 2026 (USD Million)
      Table 27 Asia Pacific Paint Packaging Market, by Country, 2016 – 2026 (Kilo Tons)
      Table 28 Asia Pacific Paint Packaging Market, by Product Type, 2016 – 2026 (USD Million)
      Table 29 Asia Pacific Paint Packaging Market, by Product Type, 2016 – 2026 (Kilo Tons)
      Table 30 Asia Pacific Paint Packaging Market, by Material, 2016 – 2026 (USD Million)
      Table 31 Asia Pacific Paint Packaging Market, by Material, 2016 – 2026 (Kilo Tons)
      Table 32 Asia Pacific Paint Packaging Market, by End-Use, 2016 – 2026 (USD Million)
      Table 33 Asia Pacific Paint Packaging Market, by End-Use, 2016 – 2026 (Kilo Tons)
      Table 34 Latin America Paint Packaging Market, by Country, 2016 – 2026 (USD Million)
      Table 35 Latin America Paint Packaging Market, by Country, 2016 – 2026 (Kilo Tons)
      Table 36 Latin America Paint Packaging Market, by Product Type, 2016 – 2026 (USD Million)
      Table 37 Latin America Paint Packaging Market, by Product Type, 2016 – 2026 (Kilo Tons)
      Table 38 Latin America Paint Packaging Market, by Material, 2016 – 2026 (USD Million)
      Table 39 Latin America Paint Packaging Market, by Material, 2016 – 2026 (Kilo Tons)
      Table 40 Latin America Paint Packaging Market, by End-Use, 2016 – 2026 (USD Million)
      Table 41 Latin America Paint Packaging Market, by End-Use, 2016 – 2026 (Kilo Tons)
      Table 42 The Middle-East and Africa Paint Packaging Market, by Country, 2016 – 2026 (USD Million)
      Table 43 The Middle-East and Africa Paint Packaging Market, by Country, 2016 – 2026 (Kilo Tons)
      Table 44 The Middle-East and Africa Paint Packaging Market, by Product Type, 2016 – 2026 (USD Million)
      Table 45 The Middle-East and Africa Paint Packaging Market, by Product Type, 2016 – 2026 (Kilo Tons)
      Table 46 The Middle-East and Africa Paint Packaging Market, by Material, 2016 – 2026 (USD Million)
      Table 47 The Middle-East and Africa Paint Packaging Market, by Material, 2016 – 2026 (Kilo Tons)
      Table 48 The Middle-East and Africa Paint Packaging Market, by End-Use, 2016 – 2026 (USD Million)
      Table 49 The Middle-East and Africa Paint Packaging Market, by End-Use, 2016 – 2026 (Kilo Tons)
      Table 50 North America Paint Packaging Production, Consumption, Export, Import, 2016 – 2019
      Table 51 Europe Paint Packaging Production, Consumption, Export, Import, 2016 – 2019
      Table 52 Asia Pacific Paint Packaging Production, Consumption, Export, Import, 2016 – 2019
      Table 53 Latin America Paint Packaging Production, Consumption, Export, Import, 2016 – 2019
      Table 54 The Middle-East and Africa Paint Packaging Production, Consumption, Export, Import, 2016 – 2019
      Table 55 Global Paint Packaging Market - Company Revenue Analysis, 2016 – 2019 (USD Million)
      Table 56 Global Paint Packaging Market - Company Revenue Share Analysis, 2016 – 2019 (%)
      Table 57 Global Paint Packaging Market - Company Volume Analysis, 2016 – 2019 (Kilo Tons)
      Table 58 Global Paint Packaging Market - Company Volume Share Analysis, 2016 – 2019 (%)
      Table 59 Acquisitions and Mergers
      Table 60 Market Drivers – Impact Analysis
      Table 61 Market Restraints
      Table 62 Market Opportunities
      Table 63 Production Base and Market Concentration Rate of Raw Material
      Table 64 Key Suppliers of Raw Materials
      Table 65 Raw Materials Sources of Paint Packaging Major Manufacturers
      Table 66 Major Buyers of Paint Packaging
      Table 67 Distributors/Traders of Paint Packaging by Region
      

Industry Major Market Players

  •  International Paper
  •  Smurfit Kappa
  •  Amcor Limited
  •  Bemis Company, Inc.
  •  Mauser Group 
  •  Crown Holdings, Inc.
  •  HUBER Packaging Group GmbH
  •  BWAY Corporation
  •  The Dow Chemical Co.
  •  Tetra Pak International S.A.
  •  Mondi plc.
  •  WestRock Company
  •  Orora Packaging Australia Pty Ltd
  •  Ball Corporation
  •  RPC Superfos
  •  PLZ Aeroscience