Search Market Research Report

Discover Our Latest Reports
Discover Our Featured Reports
Discover Top Selling Reports

Orthokeratology Market Size, Share Global Analysis Report, , 2021 – 2026

report img

Orthokeratology Market By Lens Type (Fluorosilicone Acrylate, Silicone Acrylate, Balafilcon, and Oprifocon A), By Application (Myopia, Presbyopia, Hyperopia, and Astigmatism), and By Distribution Channel (Hospitals, Optometry Clinics, Ophthalmology Clinics, and Others): Global Industry Perspective, Comprehensive Analysis, and Forecast, 2021 – 2026

Industry Insights

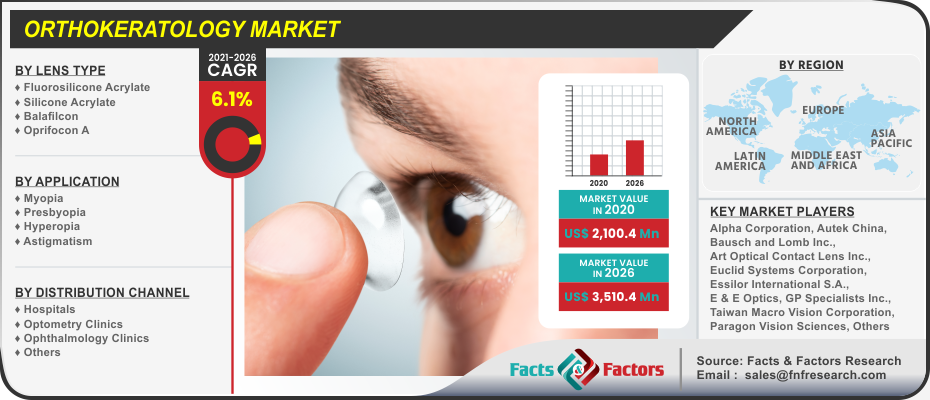
According to the report published by the Facts & Factors, global demand for the orthokeratology market was estimated at approximately USD 2,100.4 Million in 2020 and is expected to generate revenue of around USD 3,510.4 Million by the end of 2026, growing at a CAGR of around 6.1% between 2021 and 2026.

logoMarket Overview

Orthokeratology or Ortho-k refers to a process, which uses specially designed contact lenses for temporarily reshaping the outline of the cornea to lessen myopia (near-sightedness). It is a kind of non-surgical method that provides the advantage of reduced risk compared to refractive surgery. Also, the orthokeratology lens is called overnight contact lenses or corneal reshaping contact lenses for correcting or controlling myopia. Such lenses are prescribed for correcting the refractive errors, mainly near-sightedness, ahyperopia, and astigmatism.

logoIndustry Growth Factor

The major factors like the increase in the prevalence of myopia and high myopia across the globe are driving the global orthokeratology market growth. Moreover, myopia is a main public health concern and high myopia is ranked second, as the primary cause for visual impairment at the global level. In addition, the onset of visual complications from myopia takes place earlier than other causes of blindness like cataracts and as a result, its impact on quality of life is as well observed earlier. Furthermore, the continuous usage of smartphones, laptops, and tablets is also causing digital eye strain, which results in eye damage permanently among kids and the young population base. This, in turn, is fuelling the global market expansion. Young people whose near-sightedness is gradually growing are the most appropriate candidate for orthokeratology, thus raising the demand for orthokeratology.

However, restraining factors such as the lack of training of practitioners and wearers, the onset of microbial keratitis, the improper fitting process, the poor compliance to lens care regimens, and the loss to routine follow-ups might slow down the global orthokeratology market growth in the coming years. Also, fitting orthokeratology lenses are a more lengthy procedure and need more skill than fitting regular contact lenses. Besides, orthokeratology lenses involve a series of visits and possibly many sets of lenses. As a result, it augments the overall treatment expenses, leading to a reduction in market growth.

Orthokeratology Market

To know more about this report | Request Free Sample Copy

logoSegmentation Analysis

The global orthokeratology market has been classified into lens type, application, and distribution channel. On the basis of the type of lens type, the global orthokeratology market has been classified into fluorosilicone acrylate, silicone acrylate, balafilcon, and Oprifocon A. Based on the application, the global orthokeratology market has been divided into myopia, presbyopia, hyperopia, and astigmatism. In terms of distribution channel, the global orthokeratology market has been segmented into hospitals, optometry clinics, ophthalmology clinics, and others.

logoReport Scope

Report Attribute

Details

Market Size in 2020

USD 2,100.4 Million

Projected Market Size in 2026

USD 3,510.4 Million

CAGR Growth Rate

6.1% CAGR

Base Year

2020

Forecast Years

2021-2026

Key Market Players

Alpha Corporation, Bausch and Lomb Inc., Art Optical Contact Lens Inc., Autek China, Euclid Systems Corporation, Essilor International S.A., E & E Optics, GP Specialists Inc., Paragon Vision Sciences, Taiwan Macro Vision Corporation, and Others

Key Segment

By Lens Type, By Application, By Distribution Channel, and By Region

Major Regions Covered

North America, Europe, Asia Pacific, Latin America, and the Middle East & Africa

Purchase Options

Request customized purchase options to meet your research needs. Explore purchase options

logo Regional Analysis

The geographical split of the orthokeratology market comprises North America, Europe, Asia-Pacific, the Middle East and Africa, and Latin America. In terms of the region, North America is dominating the global market of orthokeratology. The high growth in this regional market can be attributed to continuing funding for the development of new products in the treatment of ophthalmologic conditions, the rapid rise of childhood myopia, and the increasing demand for ophthalmologists in this region.

Moreover, the Asia-Pacific orthokeratology market is expected to have a significant market growth rate during the forecast period. This can be attributed to the increasing number of individuals with refractive errors such as hyperopia, myopia, others, along with the rapid augment of childhood myopia in the region. Also, the expanded usage of smartphones, laptops, and tablets which causes digital eyes to strain, leads to permanent damage to eyes among kids and the young population base that is also propelling the regional market growth. Besides, the European region is projected to create a major revenue share in the global orthokeratology market because of the growing burden of short-sightedness among the regional population.

logo Competitive Players

Major market players covered in the global orthokeratology market include

  • Alpha Corporation
  • Bausch and Lomb Inc.
  • Art Optical Contact Lens Inc.
  • Autek China
  • Euclid Systems Corporation
  • Essilor International S.A.
  • E & E Optics
  • GP Specialists Inc.
  • Paragon Vision Sciences
  • Taiwan Macro Vision Corporation
  • The Cooper Companies Inc.
  • Menicon Co. Ltd.
  • TruForm Optics Inc.
  • Contex Inc.
  • MiracLens L.L.C.
  • Procornea

logo By Lens Type Segment Analysis

  • Fluorosilicone Acrylate
  • Silicone Acrylate
  • Balafilcon
  • Oprifocon A

logo By Application Segment Analysis

  • Myopia
  • Presbyopia
  • Hyperopia
  • Astigmatism

logo By Distribution Channel Segment Analysis

  • Hospitals
  • Optometry Clinics
  • Ophthalmology Clinics
  • Others

logo Regional Segment Analysis

  • North America
    • U.S.
    • Canada
  • Europe
    • U.K.
    • France
    • Germany
    • Rest of Europe
  • Asia Pacific
    • China
    • Japan
    • India
    • South Korea
    • Rest of Asia Pacific
  • Latin America
    • Brazil
    • Rest of Latin America
  • The Middle East and Africa
    • GCC Countries
    • South Africa
    • Rest of Middle East Africa

Table of Content

  1. Chapter 1 Executive Summary
    1. 1.1. Introduction of Orthokeratology
    2. 1.2. Global Orthokeratology Market, 2019 & 2026 (USD Million)
    3. 1.3. Global Orthokeratology Market, 2016 – 2026(USD Million)
    4. 1.4. Global Orthokeratology MarketAbsolute Revenue Opportunity, 2016 – 2026(USD Million)
    5. 1.5. Global Orthokeratology MarketIncremental Revenue Opportunity, 2020 – 2026(USD Million)
  2. Chapter 2 Orthokeratology Market – Lens Type Analysis
    1. 2.1. Global Orthokeratology Market – Lens Type Overview
    2. 2.2. Global Orthokeratology Market Share, by Lens Type, 2019 & 2026(USD Million)
    3. 2.3. Fluorosilicone Acrylate
      1. 2.3.1. Global Fluorosilicone Acrylate Orthokeratology Market, 2016 – 2026(USD Million)
    4. 2.4. Silicone Acrylate
      1. 2.4.1. Global Silicone Acrylate Orthokeratology Market, 2016 – 2026(USD Million)
    5. 2.5. Balafilcon
      1. 2.5.1. Global Balafilcon Orthokeratology Market, 2016 – 2026(USD Million)
    6. 2.6. Oprifocon A
      1. 2.6.1. Global Oprifocon A Orthokeratology Market, 2016 – 2026(USD Million)
  3. Chapter 3 Orthokeratology Market – Application Analysis
    1. 3.1. Global Orthokeratology Market – Application Overview
    2. 3.2. Global Orthokeratology Market Share, by Application, 2019 & 2026(USD Million)
    3. 3.3. Myopia
      1. 3.3.1. Global Myopia Orthokeratology Market, 2016 – 2026(USD Million)
    4. 3.4. Presbyopia
      1. 3.4.1. Global Presbyopia Orthokeratology Market, 2016 – 2026(USD Million)
    5. 3.5. Hyperopia
      1. 3.5.1. Global Hyperopia Orthokeratology Market, 2016 – 2026(USD Million)
    6. 3.6. Astigmatism
      1. 3.6.1. Global Astigmatism Orthokeratology Market, 2016 – 2026(USD Million)
  4. Chapter 4 Orthokeratology Market – Distribution Channel Analysis
    1. 4.1. Global Orthokeratology Market – Distribution Channel Overview
    2. 4.2. Global Orthokeratology Market Share, by Distribution Channel, 2019 & 2026(USD Million)
    3. 4.3. Hospitals
      1. 4.3.1. Global Hospitals Orthokeratology Market, 2016 – 2026(USD Million)
    4. 4.4. Optometry Clinics
      1. 4.4.1. Global Optometry Clinics Orthokeratology Market, 2016 – 2026(USD Million)
    5. 4.5. Ophthalmology Clinics
      1. 4.5.1. Global Ophthalmology Clinics Orthokeratology Market, 2016 – 2026(USD Million)
    6. 4.6. Others
      1. 4.6.1. Global Others Orthokeratology Market, 2016 – 2026(USD Million)
  5. Chapter 5 Orthokeratology Market – Regional Analysis
    1. 5.1. Global Orthokeratology Market Regional Overview
    2. 5.2. Global Orthokeratology Market Share, by Region, 2019 & 2026(USD Million)
    3. 5.3. North America
      1. 5.3.1. North America Orthokeratology Market, 2016 – 2026(USD Million)
        1. 5.3.1.1. North America Orthokeratology Market, by Country, 2016 - 2026(USD Million)
      2. 5.3.2. North America Orthokeratology Market, by Lens Type, 2016 – 2026
        1. 5.3.2.1. North America Orthokeratology Market, by Lens Type, 2016 – 2026(USD Million)
      3. 5.3.3. North America Orthokeratology Market, by Application, 2016 – 2026
        1. 5.3.3.1. North America Orthokeratology Market, by Application, 2016 – 2026(USD Million)
      4. 5.3.4. North America Orthokeratology Market, by Distribution Channel, 2016 – 2026
        1. 5.3.4.1. North America Orthokeratology Market, by Distribution Channel, 2016 – 2026(USD Million)
      5. 5.3.5. U.S.
        1. 5.3.5.1. U.S. Orthokeratology Market, 2016 – 2026(USD Million)
      6. 5.3.6. Canada
        1. 5.3.6.1. Canada Orthokeratology Market, 2016 – 2026(USD Million)
    4. 5.4. Europe
      1. 5.4.1. Europe Orthokeratology Market, 2016 – 2026(USD Million)
        1. 5.4.1.1. Europe Orthokeratology Market, by Country, 2016 - 2026(USD Million)
      2. 5.4.2. Europe Orthokeratology Market, by Lens Type, 2016 – 2026
        1. 5.4.2.1. Europe Orthokeratology Market, by Lens Type, 2016 – 2026(USD Million)
      3. 5.4.3. Europe Orthokeratology Market, by Application, 2016 – 2026
        1. 5.4.3.1. Europe Orthokeratology Market, by Application, 2016 – 2026(USD Million)
      4. 5.4.4. Europe Orthokeratology Market, by Distribution Channel, 2016 – 2026
        1. 5.4.4.1. Europe Orthokeratology Market, by Distribution Channel, 2016 – 2026(USD Million)
      5. 5.4.5. Germany
        1. 5.4.5.1. Germany Orthokeratology Market, 2016 – 2026(USD Million)
      6. 5.4.6. France
        1. 5.4.6.1. France Orthokeratology Market, 2016 – 2026(USD Million)
      7. 5.4.7. U.K.
        1. 5.4.7.1. U.K. Orthokeratology Market, 2016 – 2026(USD Million)
      8. 5.4.8. Italy
        1. 5.4.8.1. Italy Orthokeratology Market, 2016 – 2026(USD Million)
      9. 5.4.9. Spain
        1. 5.4.9.1. Spain Orthokeratology Market, 2016 – 2026(USD Million)
      10. 5.4.10. Rest of Europe
        1. 5.4.10.1. Rest of Europe Orthokeratology Market, 2016 – 2026(USD Million)
    5. 5.5. Asia Pacific
      1. 5.5.1. Asia Pacific Orthokeratology Market, 2016 – 2026(USD Million)
        1. 5.5.1.1. Asia Pacific Orthokeratology Market, by Country, 2016 - 2026(USD Million)
      2. 5.5.2. Asia Pacific Orthokeratology Market, by Lens Type, 2016 – 2026
        1. 5.5.2.1. Asia Pacific Orthokeratology Market, by Lens Type, 2016 – 2026(USD Million)
      3. 5.5.3. Asia Pacific Orthokeratology Market, by Application, 2016 – 2026
        1. 5.5.3.1. Asia Pacific Orthokeratology Market, by Application, 2016 – 2026(USD Million)
      4. 5.5.4. Asia Pacific Orthokeratology Market, by Distribution Channel, 2016 – 2026
        1. 5.5.4.1. Asia Pacific Orthokeratology Market, by Distribution Channel, 2016 – 2026(USD Million)
      5. 5.5.5. China
        1. 5.5.5.1. China Orthokeratology Market, 2016 – 2026(USD Million)
      6. 5.5.6. Japan
        1. 5.5.6.1. Japan Orthokeratology Market, 2016 – 2026(USD Million)
      7. 5.5.7. India
        1. 5.5.7.1. India Orthokeratology Market, 2016 – 2026(USD Million)
      8. 5.5.8. South Korea
        1. 5.5.8.1. South Korea Orthokeratology Market, 2016 – 2026(USD Million)
      9. 5.5.9. South-East Asia
        1. 5.5.9.1. South-East Asia Orthokeratology Market, 2016 – 2026(USD Million)
      10. 5.5.10. Rest of Asia Pacific
        1. 5.5.10.1. Rest of Asia Pacific Orthokeratology Market, 2016 – 2026(USD Million)
    6. 5.6. Latin America
      1. 5.6.1. Latin America Orthokeratology Market, 2016 – 2026(USD Million)
        1. 5.6.1.1. Latin America Orthokeratology Market, by Country, 2016 - 2026(USD Million)
      2. 5.6.2. Latin America Orthokeratology Market, by Lens Type, 2016 – 2026
        1. 5.6.2.1. Latin America Orthokeratology Market, by Lens Type, 2016 – 2026(USD Million)
      3. 5.6.3. Latin America Orthokeratology Market, by Application, 2016 – 2026
        1. 5.6.3.1. Latin America Orthokeratology Market, by Application, 2016 – 2026(USD Million)
      4. 5.6.4. Latin America Orthokeratology Market, by Distribution Channel, 2016 – 2026
        1. 5.6.4.1. Latin America Orthokeratology Market, by Distribution Channel, 2016 – 2026(USD Million)
      5. 5.6.5. Brazil
        1. 5.6.5.1. Brazil Orthokeratology Market, 2016 – 2026(USD Million)
      6. 5.6.6. Mexico
        1. 5.6.6.1. Mexico Orthokeratology Market, 2016 – 2026(USD Million)
      7. 5.6.7. Rest of Latin America
        1. 5.6.7.1. Rest of Latin America Orthokeratology Market, 2016 – 2026(USD Million)
    7. 5.7. The Middle-East and Africa
      1. 5.7.1. The Middle-East and Africa Orthokeratology Market, 2016 – 2026(USD Million)
        1. 5.7.1.1. The Middle-East and Africa Orthokeratology Market, by Country, 2016 - 2026(USD Million)
      2. 5.7.2. The Middle-East and Africa Orthokeratology Market, by Lens Type, 2016 – 2026
        1. 5.7.2.1. The Middle-East and Africa Orthokeratology Market, by Lens Type, 2016 – 2026(USD Million)
      3. 5.7.3. The Middle-East and Africa Orthokeratology Market, by Application, 2016 – 2026
        1. 5.7.3.1. The Middle-East and Africa Orthokeratology Market, by Application, 2016 – 2026(USD Million)
      4. 5.7.4. The Middle-East and Africa Orthokeratology Market, by Distribution Channel, 2016 – 2026
        1. 5.7.4.1. The Middle-East and Africa Orthokeratology Market, by Distribution Channel, 2016 – 2026(USD Million)
      5. 5.7.5. GCC Countries
        1. 5.7.5.1. GCC Countries Orthokeratology Market, 2016 – 2026(USD Million)
      6. 5.7.6. South Africa
        1. 5.7.6.1. South Africa Orthokeratology Market, 2016 – 2026(USD Million)
      7. 5.7.7. Rest of Middle-East Africa
        1. 5.7.7.1. Rest of Middle-East Africa Orthokeratology Market, 2016 – 2026(USD Million)
  6. Chapter 6 Orthokeratology Market – Competitive Landscape
    1. 6.1. Competitor Market Share – Revenue
    2. 6.2. Market Concentration Rate Analysis, Top 3 and Top 5 Players
    3. 6.3. Strategic Developments
      1. 6.3.1. Acquisitions and Mergers
      2. 6.3.2. New Products
      3. 6.3.3. Research & Development Activities
  7. Chapter 7 Company Profiles
    1. 7.1. Alpha Corporation
      1. 7.1.1. Company Overview
      2. 7.1.2. Product/ServicePortfolio
      3. 7.1.3. Alpha Corporation Sales, Revenue, and Gross Margin
      4. 7.1.4. Alpha Corporation Revenue and Growth Rate
      5. 7.1.5. Alpha Corporation Market Share
      6. 7.1.6. Recent Initiatives, Funding/VC Activities, and Technological Innovations
    2. 7.2. Bausch and Lomb Inc.
      1. 7.2.1. Company Overview
      2. 7.2.2. Product/ServicePortfolio
      3. 7.2.3. Bausch and Lomb Inc. Sales, Revenue, and Gross Margin
      4. 7.2.4. Bausch and Lomb Inc. Revenue and Growth Rate
      5. 7.2.5. Bausch and Lomb Inc. Market Share
      6. 7.2.6. Recent Initiatives, Funding/VC Activities, and Technological Innovations
    3. 7.3. Art Optical Contact Lens Inc.
      1. 7.3.1. Company Overview
      2. 7.3.2. Product/ServicePortfolio
      3. 7.3.3. Art Optical Contact Lens Inc. Sales, Revenue, and Gross Margin
      4. 7.3.4. Art Optical Contact Lens Inc. Revenue and Growth Rate
      5. 7.3.5. Art Optical Contact Lens Inc. Market Share
      6. 7.3.6. Recent Initiatives, Funding/VC Activities, and Technological Innovations
    4. 7.4. Autek China
      1. 7.4.1. Company Overview
      2. 7.4.2. Product/ServicePortfolio
      3. 7.4.3. Autek China Sales, Revenue, and Gross Margin
      4. 7.4.4. Autek China Revenue and Growth Rate
      5. 7.4.5. Autek China Market Share
      6. 7.4.6. Recent Initiatives, Funding/VC Activities, and Technological Innovations
    5. 7.5. Euclid Systems Corporation
      1. 7.5.1. Company Overview
      2. 7.5.2. Product/ServicePortfolio
      3. 7.5.3. Euclid Systems Corporation Sales, Revenue, and Gross Margin
      4. 7.5.4. Euclid Systems Corporation Revenue and Growth Rate
      5. 7.5.5. Euclid Systems Corporation Market Share
      6. 7.5.6. Recent Initiatives, Funding/VC Activities, and Technological Innovations
    6. 7.6. Essilor International S.A.
      1. 7.6.1. Company Overview
      2. 7.6.2. Product/ServicePortfolio
      3. 7.6.3. Essilor International S.A. Sales, Revenue, and Gross Margin
      4. 7.6.4. Essilor International S.A. Revenue and Growth Rate
      5. 7.6.5. Essilor International S.A. Market Share
      6. 7.6.6. Recent Initiatives, Funding/VC Activities, and Technological Innovations
    7. 7.7. E & E Optics
      1. 7.7.1. Company Overview
      2. 7.7.2. Product/ServicePortfolio
      3. 7.7.3. E & E Optics Sales, Revenue, and Gross Margin
      4. 7.7.4. E & E Optics Revenue and Growth Rate
      5. 7.7.5. E & E Optics Market Share
      6. 7.7.6. Recent Initiatives, Funding/VC Activities, and Technological Innovations
    8. 7.8. GP Specialists Inc.
      1. 7.8.1. Company Overview
      2. 7.8.2. Product/ServicePortfolio
      3. 7.8.3. GP Specialists Inc. Sales, Revenue, and Gross Margin
      4. 7.8.4. GP Specialists Inc. Revenue and Growth Rate
      5. 7.8.5. GP Specialists Inc. Market Share
      6. 7.8.6. Recent Initiatives, Funding/VC Activities, and Technological Innovations
    9. 7.9. Paragon Vision Sciences
      1. 7.9.1. Company Overview
      2. 7.9.2. Product/ServicePortfolio
      3. 7.9.3. Paragon Vision Sciences Sales, Revenue, and Gross Margin
      4. 7.9.4. Paragon Vision Sciences Revenue and Growth Rate
      5. 7.9.5. Paragon Vision Sciences Market Share
      6. 7.9.6. Recent Initiatives, Funding/VC Activities, and Technological Innovations
    10. 7.10. Taiwan Macro Vision Corporation
      1. 7.10.1. Company Overview
      2. 7.10.2. Product/ServicePortfolio
      3. 7.10.3. Taiwan Macro Vision Corporation Sales, Revenue, and Gross Margin
      4. 7.10.4. Taiwan Macro Vision Corporation Revenue and Growth Rate
      5. 7.10.5. Taiwan Macro Vision Corporation Market Share
      6. 7.10.6. Recent Initiatives, Funding/VC Activities, and Technological Innovations
    11. 7.11. The Cooper Companies Inc.
      1. 7.11.1. Company Overview
      2. 7.11.2. Product/ServicePortfolio
      3. 7.11.3. The Cooper Companies Inc. Sales, Revenue, and Gross Margin
      4. 7.11.4. The Cooper Companies Inc. Revenue and Growth Rate
      5. 7.11.5. The Cooper Companies Inc. Market Share
      6. 7.11.6. Recent Initiatives, Funding/VC Activities, and Technological Innovations
    12. 7.12. Menicon Co. Ltd.
      1. 7.12.1. Company Overview
      2. 7.12.2. Product/ServicePortfolio
      3. 7.12.3. Menicon Co. Ltd. Sales, Revenue, and Gross Margin
      4. 7.12.4. Menicon Co. Ltd. Revenue and Growth Rate
      5. 7.12.5. Menicon Co. Ltd. Market Share
      6. 7.12.6. Recent Initiatives, Funding/VC Activities, and Technological Innovations
    13. 7.13. TruForm Optics Inc.
      1. 7.13.1. Company Overview
      2. 7.13.2. Product/ServicePortfolio
      3. 7.13.3. TruForm Optics Inc. Sales, Revenue, and Gross Margin
      4. 7.13.4. TruForm Optics Inc. Revenue and Growth Rate
      5. 7.13.5. TruForm Optics Inc. Market Share
      6. 7.13.6. Recent Initiatives, Funding/VC Activities, and Technological Innovations
    14. 7.14. Contex Inc.
      1. 7.14.1. Company Overview
      2. 7.14.2. Product/ServicePortfolio
      3. 7.14.3. Contex Inc. Sales, Revenue, and Gross Margin
      4. 7.14.4. Contex Inc. Revenue and Growth Rate
      5. 7.14.5. Contex Inc. Market Share
      6. 7.14.6. Recent Initiatives, Funding/VC Activities, and Technological Innovations
    15. 7.15. MiracLens L.L.C.
      1. 7.15.1. Company Overview
      2. 7.15.2. Product/ServicePortfolio
      3. 7.15.3. MiracLens L.L.C. Sales, Revenue, and Gross Margin
      4. 7.15.4. MiracLens L.L.C. Revenue and Growth Rate
      5. 7.15.5. MiracLens L.L.C. Market Share
      6. 7.15.6. Recent Initiatives, Funding/VC Activities, and Technological Innovations
    16. 7.16. Procornea
      1. 7.16.1. Company Overview
      2. 7.16.2. Product/ServicePortfolio
      3. 7.16.3. Procornea Sales, Revenue, and Gross Margin
      4. 7.16.4. Procornea Revenue and Growth Rate
      5. 7.16.5. Procornea Market Share
      6. 7.16.6. Recent Initiatives, Funding/VC Activities, and Technological Innovations
  8. Chapter 8 Orthokeratology — Industry Analysis
    1. 8.1. Introduction and Taxonomy
    2. 8.2. Orthokeratology Market – Key Trends
      1. 8.2.1. Market Drivers
      2. 8.2.2. Market Restraints
      3. 8.2.3. Market Opportunities
    3. 8.3. Value Chain Analysis
    4. 8.4. Key Mandates and Regulations
    5. 8.5. Technology Roadmap and Timeline
    6. 8.6. Orthokeratology Market – Attractiveness Analysis
      1. 8.6.1. By Lens Type
      2. 8.6.2. By Application
      3. 8.6.3. By Distribution Channel
      4. 8.6.4. By Region
  9. Chapter 9 Industrial Chain, Sourcing Strategy, and Downstream Buyers
    1. 9.1. Orthokeratology Industrial Chain Analysis
    2. 9.2. Downstream Buyers
    3. 9.3. Distributors/Traders List
  10. Chapter 10 Marketing Strategy Analysis
    1. 10.1. Marketing Channel
    2. 10.2. Direct Marketing
    3. 10.3. Indirect Marketing
    4. 10.4. Marketing Channel Development Trends
    5. 10.5. Economic/Political Environmental Change
  11. Chapter 11 Report Conclusion& Key Insights
    1. 11.1. Key Insights from Primary Interviews & Surveys Respondents
    2. 11.2. Key Takeaways from Analysts, Consultants, and Industry Leaders
  12. Chapter 12 Research Approach & Methodology
    1. 12.1. Report Description
    2. 12.2. Research Scope
    3. 12.3. Research Methodology
      1. 12.3.1. Secondary Research
      2. 12.3.2. Primary Research
      3. 12.3.3. Statistical Models
        1. 12.3.3.1. Company Share Analysis Model
        2. 12.3.3.2. Revenue Based Modeling
      4. 12.3.4. Research Limitations

  • List of Figures

    Fig.1	Product Picture of  Orthokeratology
    Fig.2	Global  Orthokeratology  Market, 2016 – 2026(USD Million)
    Fig.3	Global  Orthokeratology  MarketAbsolute Revenue Opportunity, 2016 – 2026(USD Million)
    Fig.4	Global  Orthokeratology  MarketIncremental Revenue Opportunity, 2020 – 2026(USD Million)
    Fig.5	Global  Orthokeratology  Market Share, by Lens Type, 2019 & 2026(USD Million)
    Fig.6	Global Fluorosilicone Acrylate Orthokeratology  Market, 2016 – 2026(USD Million)
    Fig.7	Global Silicone Acrylate Orthokeratology  Market, 2016 – 2026(USD Million)
    Fig.8	Global Balafilcon Orthokeratology  Market, 2016 – 2026(USD Million)
    Fig.9	Global Oprifocon A Orthokeratology  Market, 2016 – 2026(USD Million)
    Fig.10	Global  Orthokeratology  Market Share, by Application, 2019 & 2026(USD Million)
    Fig.11	Global Myopia Orthokeratology  Market, 2016 – 2026(USD Million)
    Fig.12	Global Presbyopia Orthokeratology  Market, 2016 – 2026(USD Million)
    Fig.13	Global Hyperopia Orthokeratology  Market, 2016 – 2026(USD Million)
    Fig.14	Global Astigmatism Orthokeratology  Market, 2016 – 2026(USD Million)
    Fig.15	Global  Orthokeratology  Market Share, by Distribution Channel, 2019 & 2026(USD Million)
    Fig.16	Global Hospitals Orthokeratology  Market, 2016 – 2026(USD Million)
    Fig.17	Global Optometry Clinics Orthokeratology  Market, 2016 – 2026(USD Million)
    Fig.18	Global Ophthalmology Clinics Orthokeratology  Market, 2016 – 2026(USD Million)
    Fig.19	Global Others Orthokeratology  Market, 2016 – 2026(USD Million)
    Fig.20	Global  Orthokeratology  MarketShare, by Region, 2019 & 2026(USD Million)
    Fig.21	North America Orthokeratology  Market, 2016 – 2026(USD Million)
    Fig.22	U.S. Orthokeratology  Market, 2016 – 2026(USD Million)
    Fig.23	Canada Orthokeratology  Market, 2016 – 2026(USD Million)
    Fig.24	Europe Orthokeratology  Market, 2016 – 2026(USD Million)
    Fig.25	Germany Orthokeratology  Market, 2016 – 2026(USD Million)
    Fig.26	France Orthokeratology  Market, 2016 – 2026(USD Million)
    Fig.27	U.K. Orthokeratology  Market, 2016 – 2026(USD Million)
    Fig.28	Italy Orthokeratology  Market, 2016 – 2026(USD Million)
    Fig.29	Spain Orthokeratology  Market, 2016 – 2026(USD Million)
    Fig.30	Rest of Europe Orthokeratology  Market, 2016 – 2026(USD Million)
    Fig.31	Asia Pacific Orthokeratology  Market, 2016 – 2026(USD Million)
    Fig.32	China Orthokeratology  Market, 2016 – 2026(USD Million)
    Fig.33	Japan Orthokeratology  Market, 2016 – 2026(USD Million)
    Fig.34	India Orthokeratology  Market, 2016 – 2026(USD Million)
    Fig.35	South  Korea Orthokeratology  Market, 2016 – 2026(USD Million)
    Fig.36	South-East Asia Orthokeratology  Market, 2016 – 2026(USD Million)
    Fig.37	Rest of Asia Pacific Orthokeratology  Market, 2016 – 2026(USD Million)
    Fig.38	Latin America Orthokeratology  Market, 2016 – 2026(USD Million)
    Fig.39	Brazil Orthokeratology  Market, 2016 – 2026(USD Million)
    Fig.40	Mexico Orthokeratology  Market, 2016 – 2026(USD Million)
    Fig.41	Rest of Latin America Orthokeratology  Market, 2016 – 2026(USD Million)
    Fig.42	The Middle-East and Africa Orthokeratology  Market, 2016 – 2026(USD Million)
    Fig.43	GCC Countries Orthokeratology  Market, 2016 – 2026(USD Million)
    Fig.44	South Africa Orthokeratology  Market, 2016 – 2026(USD Million)
    Fig.45	Rest of Middle-East Africa Orthokeratology  Market, 2016 – 2026(USD Million)
    Fig.46	Competitor Market Share – Revenue
    Fig.47	Alpha Corporation Revenue and Growth Rate
    Fig.48	Alpha Corporation Market Share
    Fig.49	Bausch and Lomb Inc. Revenue and Growth Rate
    Fig.50	Bausch and Lomb Inc. Market Share
    Fig.51	Art Optical Contact Lens Inc. Revenue and Growth Rate
    Fig.52	Art Optical Contact Lens Inc. Market Share
    Fig.53	Autek China Revenue and Growth Rate
    Fig.54	Autek China Market Share
    Fig.55	Euclid Systems Corporation Revenue and Growth Rate
    Fig.56	Euclid Systems Corporation Market Share
    Fig.57	Essilor International S.A. Revenue and Growth Rate
    Fig.58	Essilor International S.A. Market Share
    Fig.59	E & E Optics Revenue and Growth Rate
    Fig.60	E & E Optics Market Share
    Fig.61	GP Specialists Inc. Revenue and Growth Rate
    Fig.62	GP Specialists Inc. Market Share
    Fig.63	Paragon Vision Sciences Revenue and Growth Rate
    Fig.64	Paragon Vision Sciences Market Share
    Fig.65	Taiwan Macro Vision Corporation Revenue and Growth Rate
    Fig.66	Taiwan Macro Vision Corporation Market Share
    Fig.67	The Cooper Companies Inc. Revenue and Growth Rate
    Fig.68	The Cooper Companies Inc. Market Share
    Fig.69	Menicon Co. Ltd. Revenue and Growth Rate
    Fig.70	Menicon Co. Ltd. Market Share
    Fig.71	TruForm Optics Inc. Revenue and Growth Rate
    Fig.72	TruForm Optics Inc. Market Share
    Fig.73	Contex Inc. Revenue and Growth Rate
    Fig.74	Contex Inc. Market Share
    Fig.75	MiracLens L.L.C. Revenue and Growth Rate
    Fig.76	MiracLens L.L.C. Market Share
    Fig.77	Procornea Revenue and Growth Rate
    Fig.78	Procornea Market Share
    Fig.79	Market Dynamics
    Fig.80	Global  Orthokeratology  – Value Chain Analysis
    Fig.81	Key Mandates and Regulations
    Fig.82	Technology Roadmap and Timeline
    Fig.83	Market Attractiveness Analysis – By Lens Type
    Fig.84	Market Attractiveness Analysis – By Application
    Fig.85	Market Attractiveness Analysis – By Distribution Channel
    Fig.86	Market Attractiveness Analysis – By Region
    Fig.87	Orthokeratology  Industrial Chain Analysis
    Fig.88	Market Channels
    Fig.89	Marketing Channel Development Trend
    Fig.90	Growth in World Gross Product, 2008-2018
    

    List of Tables

    Table 1	Global  Orthokeratology Market, 2019 & 2026(USD Million)
    Table 2	Global  Orthokeratology Market, by Lens Type, 2016 – 2026(USD Million)
    Table 3	Global  Orthokeratology Market, by Application, 2016 – 2026(USD Million)
    Table 4	Global  Orthokeratology Market, by Distribution Channel, 2016 – 2026(USD Million)
    Table 5	Global  Orthokeratology Market, by Region, 2016 – 2026(USD Million)
    Table 6	North America Orthokeratology  Market, by Country, 2016 – 2026(USD Million)
    Table 7	North America Orthokeratology  Market, by Lens Type, 2016 – 2026(USD Million)
    Table 8	North America Orthokeratology  Market, by Application, 2016 – 2026(USD Million)
    Table 9	North America Orthokeratology  Market, by Distribution Channel, 2016 – 2026(USD Million)
    Table 10 Europe Orthokeratology  Market, by Country, 2016 – 2026(USD Million)
    Table 11 Europe Orthokeratology  Market, by Lens Type, 2016 – 2026(USD Million)
    Table 12 Europe Orthokeratology  Market, by Application, 2016 – 2026(USD Million)
    Table 13 Europe Orthokeratology  Market, by Distribution Channel, 2016 – 2026(USD Million)
    Table 14 Asia Pacific Orthokeratology  Market, by Country, 2016 – 2026(USD Million)
    Table 15 Asia Pacific Orthokeratology  Market, by Lens Type, 2016 – 2026(USD Million)
    Table 16 Asia Pacific Orthokeratology  Market, by Application, 2016 – 2026(USD Million)
    Table 17 Asia Pacific Orthokeratology  Market, by Distribution Channel, 2016 – 2026(USD Million)
    Table 18 Latin America Orthokeratology  Market, by Country, 2016 – 2026(USD Million)
    Table 19 Latin America Orthokeratology  Market, by Lens Type, 2016 – 2026(USD Million)
    Table 20 Latin America Orthokeratology  Market, by Application, 2016 – 2026(USD Million)
    Table 21 Latin America Orthokeratology  Market, by Distribution Channel, 2016 – 2026(USD Million)
    Table 22 The Middle-East and Africa Orthokeratology  Market, by Country, 2016 – 2026(USD Million)
    Table 23 The Middle-East and Africa Orthokeratology  Market, by Lens Type, 2016 – 2026(USD Million)
    Table 24 The Middle-East and Africa Orthokeratology  Market, by Application, 2016 – 2026(USD Million)
    Table 25 The Middle-East and Africa Orthokeratology  Market, by Distribution Channel, 2016 – 2026(USD Million)
    Table 26 Global  Orthokeratology  Market - Company Revenue Analysis, 2016 – 2019(USD Million)
    Table 27 Global  Orthokeratology  Market - Company Revenue Share Analysis, 2016 – 2019(%)
    Table 28 Acquisitions and Mergers
    Table 29 Market Drivers – Impact Analysis
    Table 30 Market Restraints
    Table 31 Market Opportunities
    Table 32 Major Buyers of  Orthokeratology
    Table 33 Distributors/Traders of  Orthokeratology  by Region
    
  • Industry Major Market Players

    • Alpha Corporation
    • Bausch and Lomb Inc.
    • Art Optical Contact Lens Inc.
    • Autek China
    • Euclid Systems Corporation
    • Essilor International S.A.
    • E & E Optics
    • GP Specialists Inc.
    • Paragon Vision Sciences
    • Taiwan Macro Vision Corporation
    • The Cooper Companies Inc.
    • Menicon Co. Ltd.
    • TruForm Optics Inc.
    • Contex Inc.
    • MiracLens L.L.C.
    • Procornea