Search Market Research Report

Discover Our Latest Reports
Discover Our Featured Reports
Discover Top Selling Reports

Ortho Nitrochlorobenzene Market Size, Share Global Analysis Report, 2020–2026

report img

Ortho Nitrochlorobenzene Market By Application (Dyes and Dyestuff Intermediates, Agrochemical Intermediates, Rubber Chemicals, Others): Global Industry Outlook, Market Size, Business Intelligence, Consumer Preferences, Statistical Surveys, Comprehensive Analysis, Historical Developments, Current Trends, and Forecast 2020–2026

Industry Insights

The Ortho Nitrochlorobenzene Market report analyzes and notifies the industry statistics at the global as well as regional and country levels in order to acquire a thorough perspective of the entire ortho nitro chlorobenzene market. The historical and past insights are provided for FY 2016 to FY 2019 whereas projected trends are delivered for FY 2020 to FY 2026. The quantitative and numerical data is represented in terms of both volume (Kilotons) and value (USD Million) from FY 2016 – 2026.

This specialized and expertise-oriented industry research report scrutinizes the technical and commercial business outlook of the ortho nitro chlorobenzene industry. The report analyzes and declares the historical and current trends analysis of the ortho nitro chlorobenzene industry and subsequently recommends the projected trends anticipated to be observed in the ortho nitro chlorobenzene market during the upcoming years.

Ortho Nitrochlorobenzene Market Size,

To know more about this report | Request Free Sample Copy

logoKey Insights from Primary Research

  • According to the CXO,s working in the ortho nitro chlorobenzene industry, the market is predicted to witness a substantial growth of above 4% during the years 2020-2026 attributed to increasing demand for ortho nitro chlorobenzene in the agrochemical sector.
  • Due to the growing demand for ortho nitro chlorobenzene in the production of rubber, the market is expected to develop over USD 300 million by 2026. In 2019, the market accounted for more than USD 225 million.
  • By application segment, the agrochemical intermediates segment headed the market with more than USD 125 million, in 2019 and it is expected to grow over the forecast period owing to its use in agrochemical sectors in the manufacturing of pesticides such as herbicides, insecticides, and fungicides.
  • By geography, Asia Pacific is expected to be the fastest-growing market for ortho nitro chlorobenzene during the years to come. In 2019, the Asia-pacific held the market with a share of above 60%.
  • North America is anticipated to fuel the market due to the increasing demand in chemical companies.

logoKey Recommendations from Analysts

  • Our analysts recommend that the rubber chemical category is expected to be the fastest-growing market for ortho nitro chlorobenzene during the years to come due to the rapid growth in the rubber industry.
  • Due to the use of dye intermediates in different industry sectors like paints, printing inks, textiles, plastics, and paper, the dyes and dyestuff intermediates category is projected to bolster the market over the forecast period.
  • The European region is anticipated to grow over the forecast period attributed to the increasing number of chemical and automotive industries in his region.
  • The development in the chemical sectors, and the availability of new and improved substitutes for traditionally used chemicals leading to environmental concerns is creating opportunities in the market

logo
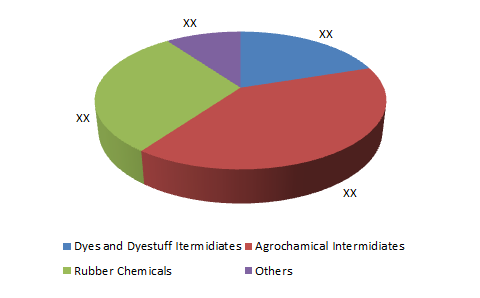
Market Attractiveness By Application Analysis

Ortho Nitrochlorobenzene Market

To know more about this report | Request Free Sample Copy

The quantitative data is further underlined and reinforced by comprehensive qualitative data which comprises various across-the-board market dynamics. The rationales which directly or indirectly impact the ortho nitro chlorobenzene industry are exemplified through parameters such as growth drivers, restraints, challenges, and opportunities among other impacting factors.

Throughout our research report, we have encompassed all the proven models and tools of industry analysis and extensively illustrated all the key business strategies and business models adopted in the ortho nitro chlorobenzene industry. The report provides an all-inclusive and detailed competitive landscape prevalent in the ortho-nitro chlorobenzene market.

The report utilizes established industry analysis tools and models such as Porter’s Five Forces framework to analyze and recognize critical business strategies adopted by various stakeholders involved in the entire value chain of the ortho nitro chlorobenzene industry. The ortho nitro chlorobenzene market report additionally employs SWOT analysis and PESTLE analysis models for further in-depth analysis.

The report study further includes an in-depth analysis of industry players' market shares and provides an overview of leading players' market position in the ortho nitro chlorobenzene sector. Key strategic developments in the ortho nitro chlorobenzene market competitive landscape such as acquisitions & mergers, inaugurations of different products and services, partnerships & joint ventures, MoU agreements, VC & funding activities, R&D activities, and geographic expansion among other noteworthy activities by key players of the ortho nitro chlorobenzene market are appropriately highlighted in the report.

Ortho-nitro chlorobenzene (ONCB) is the isomeric product. It is the process of nitration of chlorobenzene in the presence of sulphuric acid and nitric acid. Its formula is C6H4ClNO2 and molecular weight is 157ONCB. It is used as an antecedent for other products. The production of ONCB includes two processes such as nitration of chlorobenzene and diazotizing of O-Nitroaniline. The significant rise in agricultural products is driving the market growth. In most developed and developing countries, agriculture is an important sector. The growth in the agricultural sectors produces the demand for fertilizers. This, in turn, driving the OCNB market. Moreover, major players in the rubber processing chemical manufacturing industry are focusing on expanding their operations and facilities across the world to increase their footprint worldwide. This may also increase the market growth. On the other hand, the environmentally hazardous effect coupled with the non-operation of production facilities on full capacity is hindering the market growth. However, increased R&D activities, new innovations, and technological capabilities to strengthen the industry may create lucrative opportunities in the market.

The ortho nitro chlorobenzene market research report delivers an acute valuation and taxonomy of the ortho nitro chlorobenzene industry by practically splitting the market on the basis of different types, applications, and regions. Through the analysis of the historical and projected trends, all the segments and sub-segments were evaluated through the bottom-up approach, and different market sizes have been projected for FY 2020 to FY 2026. The regional segmentation of the ortho nitro chlorobenzene industry includes the complete classification of all the major continents including North America, Latin America, Europe, Asia Pacific, and the Middle East & Africa. Further, country-wise data for the ortho nitro chlorobenzene industry is provided for the leading economies of the world.

The ortho nitro chlorobenzene market is segmented based on the application. On the basis of application segmentation, the market is classified into dyes and dyestuff intermediates, agrochemical intermediates, rubber chemicals, and others.

logoReport Scope

Report Attribute

Details

Market Size in 2019

USD 225 Million

Projected Market Size in 2026

USD USD 300 Million

CAGR Growth Rate

4% CAGR

Base Year

2019

Forecast Years

2020-2026

Key Market Players

Jiaxing Zhonghua Chemical Co.Ltd, Anhui Bayi Chemical Industry, SARNA Chemical, Seya Industries, Jiangsu Yangnong Chemical Group co. Ltd, Aarti Industries Ltd, Liaoning Shixing Pharmaceutical & Chemical Co., Ltd., Kutch Chemical Industries Ltd, Panoli Intermediates, Chirag Organics, Jiangsu Yangnong Chemical Group, CHEMINTEL, and others.

Key Segment

By Application, By Region

Major Regions Covered

North America, Europe, Asia Pacific, Latin America, and the Middle East & Africa

Purchase Options

Request customized purchase options to meet your research needs. Explore purchase options

logoSome of the essential players operating in the ortho nitro chlorobenzene market, but not restricted include:

  •  Anhui Bayi Chemical Industry
  •  Jiaxing Zhonghua Chemical Co.Ltd
  •  Seya Industries
  •  SARNA Chemical
  •  Aarti Industries Ltd
  •  Jiangsu Yangnong Chemical Group co. Ltd
  •  Liaoning Shixing Pharmaceutical & Chemical Co. Ltd.
  •  Panoli Intermediates
  •  Kutch Chemical Industries Ltd
  •  Chirag Organics
  •  CHEMINTEL
  •  Jiangsu Yangnong Chemical Group

The taxonomy of the ortho nitro chlorobenzene industry by its scope and segmentation is as follows:

logoGlobal Ortho Nitro Chlorobenzene Market: By Application Segmentation Analysis

  • Dyes and Dyestuff Intermediates
  • Agrochemical Intermediates
  • Rubber Chemicals
  • Others

logoGlobal ortho nitro chlorobenzene Market: Regional Segmentation Analysis

  • North America
    • The U.S.
    • Canada
  • Europe
    • Germany
    • The UK
    • France
    • Spain
    • Italy
    • Rest of Europe
  • Asia Pacific
    • China
    • Japan
    • India
    • South Korea
    • Southeast Asia
    • Rest of Asia Pacific
  • Latin America
    • Brazil
    • Mexico
    • Rest of Latin America
  • Middle East & Africa
    • GCC
    • South Africa
    • Rest of Middle East & Africa

Table of Content

  1. CHAPTER 1. Executive Summary
  2. CHAPTER 2. Ortho Nitrochlorobenzene market – Application Analysis
    1. 2.1. Global Ortho Nitrochlorobenzene Market – Application Overview
    2. 2.2. Global Ortho Nitrochlorobenzene Market Share, by Application, 2019 & 2026 (USD Million)
    3. 2.3. Global Ortho Nitrochlorobenzene Market share, by Application, 2019 & 2026 (KiloTons)
    4. 2.4. Dyes and Dyestuff Itermidiates
      1. 2.4.1. Global Dyes and Dyestuff Itermidiates Ortho Nitrochlorobenzene Market, 2016-2026 (USD Million)
      2. 2.4.2. Global Dyes and Dyestuff Itermidiates Ortho Nitrochlorobenzene Market, 2016-2026 (KiloTons)
    5. 2.5. Agrochamical Intermidiates
      1. 2.5.1. Global Agrochamical Intermidiates Ortho Nitrochlorobenzene Market, 2016-2026 (USD Million)
      2. 2.5.2. Global Agrochamical Intermidiates Ortho Nitrochlorobenzene Market, 2016-2026 (KiloTons)
    6. 2.6. Rubber Chemicals
      1. 2.6.1. Global Rubber Chemicals Ortho Nitrochlorobenzene Market, 2016-2026 (USD Million)
      2. 2.6.2. Global Rubber Chemicals Ortho Nitrochlorobenzene Market, 2016-2026 (KiloTons)
    7. 2.7. Others
      1. 2.7.1. Global Others Ortho Nitrochlorobenzene Market, 2016-2026 (USD Million)
      2. 2.7.2. Global Others Ortho Nitrochlorobenzene Market, 2016-2026 (KiloTons)
  3. CHAPTER 3. Ortho Nitrochlorobenzene market – Regional Analysis
    1. 3.1. Global Ortho Nitrochlorobenzene Market Regional Overview
    2. 3.2. Global Ortho Nitrochlorobenzene Market Share, by Region, 2019 & 2026 (Value)
    3. 3.3. Global Ortho Nitrochlorobenzene Market Share, by Region, 2019 & 2026 (Volume)
    4. 3.4. North America
      1. 3.4.1. North America Ortho Nitrochlorobenzene Market size and forecast, 2016-2026
      2. 3.4.2. North America Ortho Nitrochlorobenzene Market, by Country, 2019 - 2026 (USD Million)
      3. 3.4.3. North America Market size and forecast, 2016-2026 (KiloTons)
      4. 3.4.4. North America Ortho Nitrochlorobenzene Market, by Country, 2019 - 2026 (KiloTons)
      5. 3.4.5. North America Ortho Nitrochlorobenzene Market, by Application, 2016-2026
        1. 3.4.5.1. North America Ortho Nitrochlorobenzene Market, by Application, 2016-2026 (USD Million)
        2. 3.4.5.2. North America Ortho Nitrochlorobenzene Market, by Application, 2016-2026 (KiloTons)
      6. 3.4.6. U.S.
        1. 3.4.6.1. U.S. Market size and forecast, 2016-2026 (USD Million)
        2. 3.4.6.2. U.S. Market size and forecast, 2016-2026 (KiloTons)
      7. 3.4.7. Canada
        1. 3.4.7.1. Canada Market size and forecast, 2016-2026 (USD Million)
        2. 3.4.7.2. Canada Market size and forecast, 2016-2026 (KiloTons)
    5. 3.5. Europe
      1. 3.5.1. Europe Ortho Nitrochlorobenzene Market size and forecast, 2016-2026
      2. 3.5.2. Europe Ortho Nitrochlorobenzene Market, by Country, 2019 - 2026 (USD Million)
      3. 3.5.3. Europe Market size and forecast, 2016-2026 (KiloTons)
      4. 3.5.4. Europe Ortho Nitrochlorobenzene Market, by Country, 2019 - 2026 (KiloTons)
      5. 3.5.5. Europe Ortho Nitrochlorobenzene Market, by Application, 2016-2026
        1. 3.5.5.1. Europe Ortho Nitrochlorobenzene Market, by Application, 2016-2026 (USD Million)
        2. 3.5.5.2. Europe Ortho Nitrochlorobenzene Market, by Application, 2016-2026 (KiloTons)
      6. 3.5.6. Germany
        1. 3.5.6.1. Germany Market size and forecast, 2016-2026 (USD Million)
        2. 3.5.6.2. Germany Market size and forecast, 2016-2026 (KiloTons)
      7. 3.5.7. France
        1. 3.5.7.1. France Market size and forecast, 2016-2026 (USD Million)
        2. 3.5.7.2. France Market size and forecast, 2016-2026 (KiloTons)
      8. 3.5.8. U.K.
        1. 3.5.8.1. U.K. Market size and forecast, 2016-2026 (USD Million)
        2. 3.5.8.2. U.K. Market size and forecast, 2016-2026 (KiloTons)
      9. 3.5.9. Italy
        1. 3.5.9.1. Italy Market size and forecast, 2016-2026 (USD Million)
        2. 3.5.9.2. Italy Market size and forecast, 2016-2026 (KiloTons)
      10. 3.5.10. Spain
        1. 3.5.10.1. Spain Market size and forecast, 2016-2026 (USD Million)
        2. 3.5.10.2. Spain Market size and forecast, 2016-2026 (KiloTons)
      11. 3.5.11. Rest of Europe
        1. 3.5.11.1. Rest of Europe Market size and forecast, 2016-2026 (USD Million)
        2. 3.5.11.2. Rest of Europe Market size and forecast, 2016-2026 (KiloTons)
    6. 3.6. Asia Pacific
      1. 3.6.1. Asia Pacific Ortho Nitrochlorobenzene Market size and forecast, 2016-2026
      2. 3.6.2. Asia Pacific Ortho Nitrochlorobenzene Market, by Country, 2019 - 2026 (USD Million)
      3. 3.6.3. Asia Pacific Market size and forecast, 2016-2026 (KiloTons)
      4. 3.6.4. Asia Pacific Ortho Nitrochlorobenzene Market, by Country, 2019 - 2026 (KiloTons)
      5. 3.6.5. Asia Pacific Ortho Nitrochlorobenzene Market, by Application, 2016-2026
        1. 3.6.5.1. Asia Pacific Ortho Nitrochlorobenzene Market, by Application, 2016-2026 (USD Million)
        2. 3.6.5.2. Asia Pacific Ortho Nitrochlorobenzene Market, by Application, 2016-2026 (KiloTons)
      6. 3.6.6. China
        1. 3.6.6.1. China Market size and forecast, 2016-2026 (USD Million)
        2. 3.6.6.2. China Market size and forecast, 2016-2026 (KiloTons)
      7. 3.6.7. Japan
        1. 3.6.7.1. Japan Market size and forecast, 2016-2026 (USD Million)
        2. 3.6.7.2. Japan Market size and forecast, 2016-2026 (KiloTons)
      8. 3.6.8. India
        1. 3.6.8.1. India Market size and forecast, 2016-2026 (USD Million)
        2. 3.6.8.2. India Market size and forecast, 2016-2026 (KiloTons)
      9. 3.6.9. South Korea
        1. 3.6.9.1. South Korea Market size and forecast, 2016-2026 (USD Million)
        2. 3.6.9.2. South Korea Market size and forecast, 2016-2026 (KiloTons)
      10. 3.6.10. South-East Asia
        1. 3.6.10.1. South-East Asia Market size and forecast, 2016-2026 (USD Million)
        2. 3.6.10.2. South-East Asia Market size and forecast, 2016-2026 (KiloTons)
      11. 3.6.11. Rest of Asia Pacific
        1. 3.6.11.1. Rest of Asia Pacific Market size and forecast, 2016-2026 (USD Million)
        2. 3.6.11.2. Rest of Asia Pacific Market size and forecast, 2016-2026 (KiloTons)
    7. 3.7. Latin America
      1. 3.7.1. Latin America Ortho Nitrochlorobenzene Market size and forecast, 2016-2026
      2. 3.7.2. Latin America Ortho Nitrochlorobenzene Market, by Country, 2019 - 2026 (USD Million)
      3. 3.7.3. Latin America Market size and forecast, 2016-2026 (KiloTons)
      4. 3.7.4. Latin America Ortho Nitrochlorobenzene Market, by Country, 2019 - 2026 (KiloTons)
      5. 3.7.5. Latin America Ortho Nitrochlorobenzene Market, by Application, 2016-2026
        1. 3.7.5.1. Latin America Ortho Nitrochlorobenzene Market, by Application, 2016-2026 (USD Million)
        2. 3.7.5.2. Latin America Ortho Nitrochlorobenzene Market, by Application, 2016-2026 (KiloTons)
      6. 3.7.6. Brazil
        1. 3.7.6.1. Brazil Market size and forecast, 2016-2026 (USD Million)
        2. 3.7.6.2. Brazil Market size and forecast, 2016-2026 (KiloTons)
      7. 3.7.7. Mexico
        1. 3.7.7.1. Mexico Market size and forecast, 2016-2026 (USD Million)
        2. 3.7.7.2. Mexico Market size and forecast, 2016-2026 (KiloTons)
      8. 3.7.8. Rest of Latin America
        1. 3.7.8.1. Rest of Latin America Market size and forecast, 2016-2026 (USD Million)
        2. 3.7.8.2. Rest of Latin America Market size and forecast, 2016-2026 (KiloTons)
    8. 3.8. The Middle-East and Africa
      1. 3.8.1. The Middle-East and Africa Ortho Nitrochlorobenzene Market size and forecast, 2016-2026
      2. 3.8.2. The Middle-East and Africa Ortho Nitrochlorobenzene Market, by Country, 2019 - 2026 (USD Million)
      3. 3.8.3. The Middle-East and Africa Market size and forecast, 2016-2026 (KiloTons)
      4. 3.8.4. The Middle-East and Africa Ortho Nitrochlorobenzene Market, by Country, 2019 - 2026 (KiloTons)
      5. 3.8.5. The Middle-East and Africa Ortho Nitrochlorobenzene Market, by Application, 2016-2026
        1. 3.8.5.1. The Middle-East and Africa Ortho Nitrochlorobenzene Market, by Application, 2016-2026 (USD Million)
        2. 3.8.5.2. The Middle-East and Africa Ortho Nitrochlorobenzene Market, by Application, 2016-2026 (KiloTons)
      6. 3.8.6. GCC Countries
        1. 3.8.6.1. GCC Countries Market size and forecast, 2016-2026 (USD Million)
        2. 3.8.6.2. GCC Countries Market size and forecast, 2016-2026 (KiloTons)
      7. 3.8.7. South Africa
        1. 3.8.7.1. South Africa Market size and forecast, 2016-2026 (USD Million)
        2. 3.8.7.2. South Africa Market size and forecast, 2016-2026 (KiloTons)
      8. 3.8.8. Rest of Middle-East Africa
        1. 3.8.8.1. Rest of Middle-East Africa Market size and forecast, 2016-2026 (USD Million)
        2. 3.8.8.2. Rest of Middle-East Africa Market size and forecast, 2016-2026 (KiloTons)
  4. CHAPTER 4. Ortho Nitrochlorobenzene Production, Consumption, Export, Import by Regions
    1. 4.1. Global Ortho Nitrochlorobenzene production and revenue, 2016-2026 (USD Million) (KiloTons)
    2. 4.2. Global Import and Export Analysis, by Region
  5. CHAPTER 5. Ortho Nitrochlorobenzene market – Competitive Landscape
    1. 5.1. Competitor Market Share – Revenue
    2. 5.2. Market Concentration Rate Analysis, Top 3 and Top 5 Players
    3. 5.3. Competitor Market Share – Volume
    4. 5.4. Strategic Development
      1. 5.4.1. Acquisitions and Mergers
      2. 5.4.2. New Products
      3. 5.4.3. Research & Development Activities
  6. CHAPTER 6. Company Profiles
    1. 6.1. Anhui Bayi Chemical Industry
      1. 6.1.1. Company Overview
      2. 6.1.2. Anhui Bayi Chemical Industry Sales, Revenue, Price, and Gross Margin
      3. 6.1.3. Product portfolio
      4. 6.1.4. Recent initiatives
    2. 6.2. Jiaxing Zhonghua Chemical Co.Ltd
      1. 6.2.1. Company Overview
      2. 6.2.2. Jiaxing Zhonghua Chemical Co.Ltd Sales, Revenue, Price, and Gross Margin
      3. 6.2.3. Product portfolio
      4. 6.2.4. Recent initiatives
    3. 6.3. Seya Industries
      1. 6.3.1. Company Overview
      2. 6.3.2. Seya Industries Sales, Revenue, Price, and Gross Margin
      3. 6.3.3. Product portfolio
      4. 6.3.4. Recent initiatives
    4. 6.4. SARNA Chemical
      1. 6.4.1. Company Overview
      2. 6.4.2. SARNA Chemical Sales, Revenue, Price, and Gross Margin
      3. 6.4.3. Product portfolio
      4. 6.4.4. Recent initiatives
    5. 6.5. Aarti Industries Ltd
      1. 6.5.1. Company Overview
      2. 6.5.2. Aarti Industries Ltd Sales, Revenue, Price, and Gross Margin
      3. 6.5.3. Product portfolio
      4. 6.5.4. Recent initiatives
    6. 6.6. Jiangsu Yangnong Chemical Group co. Ltd
      1. 6.6.1. Company Overview
      2. 6.6.2. Jiangsu Yangnong Chemical Group co. Ltd Sales, Revenue, Price, and Gross Margin
      3. 6.6.3. Product portfolio
      4. 6.6.4. Recent initiatives
    7. 6.7. Liaoning Shixing Pharmaceutical & Chemical Co. Ltd.
      1. 6.7.1. Company Overview
      2. 6.7.2. Liaoning Shixing Pharmaceutical & Chemical Co. Ltd. Sales, Revenue, Price, and Gross Margin
      3. 6.7.3. Product portfolio
      4. 6.7.4. Recent initiatives
    8. 6.8. Panoli Intermidiates
      1. 6.8.1. Company Overview
      2. 6.8.2. Panoli Intermidiates Sales, Revenue, Price, and Gross Margin
      3. 6.8.3. Product portfolio
      4. 6.8.4. Recent initiatives
    9. 6.9. Kutch Chemical Industries Ltd
      1. 6.9.1. Company Overview
      2. 6.9.2. Kutch Chemical Industries Ltd Sales, Revenue, Price, and Gross Margin
      3. 6.9.3. Product portfolio
      4. 6.9.4. Recent initiatives
    10. 6.10. Chirag Organics
      1. 6.10.1. Company Overview
      2. 6.10.2. Chirag Organics Sales, Revenue, Price, and Gross Margin
      3. 6.10.3. Product portfolio
      4. 6.10.4. Recent initiatives
    11. 6.11. CHEMINTEL
      1. 6.11.1. Company Overview
      2. 6.11.2. CHEMINTEL Sales, Revenue, Price, and Gross Margin
      3. 6.11.3. Product portfolio
      4. 6.11.4. Recent initiatives
    12. 6.12. Jiangsu Yangnong Chemical Group
      1. 6.12.1. Company Overview
      2. 6.12.2. Jiangsu Yangnong Chemical Group Sales, Revenue, Price, and Gross Margin
      3. 6.12.3. Product portfolio
      4. 6.12.4. Recent initiatives
  7. CHAPTER 7. Ortho Nitrochlorobenzene — Industry Analysis
    1. 7.1. Introduction and Taxonomy
    2. 7.2. Ortho Nitrochlorobenzene Market – Key Trends
      1. 7.2.1. Market Drivers
      2. 7.2.2. Market Restraints
      3. 7.2.3. Market Opportunities
    3. 7.3. Value Chain Analysis
    4. 7.4. Key Mandates and Regulations
    5. 7.5. Technology Roadmap and Timeline
    6. 7.6. Ortho Nitrochlorobenzene market – Attractiveness Analysis
      1. 7.6.1. By Application
      2. 7.6.2. By Region
  8. CHAPTER 8. Raw Material analysis
    1. 8.1. Ortho Nitrochlorobenzene Key Raw Material Analysis
      1. 8.1.1. Key Raw Materials
      2. 8.1.2. Price Trend of Key Raw Materials
    2. 8.2. Key Suppliers of Raw Materials
    3. 8.3. Proportion of Manufacturing Cost Structure
      1. 8.3.1. Raw Materials
      2. 8.3.2. Labor Cost
    4. 8.4. Manufacturing Expenses Analysis of Ortho Nitrochlorobenzene
  9. CHAPTER 9. Industrial Chain, Sourcing Strategy and Downstream Buyers
    1. 9.1. Ortho Nitrochlorobenzene Industrial Chain Analysis
    2. 9.2. Upstream Raw Materials Sourcing
      1. 9.2.1. Risk Mitigation:
      2. 9.2.2. Supplier Relationships:
      3. 9.2.3. Business Processes:
      4. 9.2.4. Securing the Product:
    3. 9.3. Raw Materials Sources of Ortho Nitrochlorobenzene Major Manufacturers in 2016
    4. 9.4. Downstream Buyers
    5. 9.5. Distributors/Traders List
  10. CHAPTER 10. Marketing Strategy Analysis, Distributors
    1. 10.1. Marketing Channel
    2. 10.2. Direct Marketing
    3. 10.3. Indirect Marketing
    4. 10.4. Marketing Channel Development Trend
    5. 10.5. Economic/Political Environmental Change
  11. CHAPTER 11. Report Conclusion
  12. CHAPTER 12. Research Approach & Methodology
    1. 12.1. Report Description
    2. 12.2. Research Scope
    3. 12.3. Research Methodology
      1. 12.3.1. Secondary Research
      2. 12.3.2. Primary Research
      3. 12.3.3. Models
        1. 12.3.3.1. Company Share Analysis Model
        2. 12.3.3.2. Revenue Based Modeling
        3. 12.3.3.3. Research Limitations

        List of Figures

        FIG. 1 Global Ortho Nitrochlorobenzene Market, 2016-2026 (USD Million)
        FIG. 2 Global Ortho Nitrochlorobenzene Market Share, by Application, 2019 & 2026 (USD Million)
        FIG. 3 Global Ortho Nitrochlorobenzene Market share, by Application, 2019 & 2026 (KiloTons)
        FIG. 4 Global Dyes and Dyestuff Itermidiates Ortho Nitrochlorobenzene Market, 2016-2026 (USD Million)
        FIG. 5 Global Dyes and Dyestuff Itermidiates Ortho Nitrochlorobenzene  Market, 2016-2026 (KiloTons)
        FIG. 6 Global Agrochamical Intermidiates Ortho Nitrochlorobenzene Market, 2016-2026 (USD Million)
        FIG. 7 Global Agrochamical Intermidiates Ortho Nitrochlorobenzene  Market, 2016-2026 (KiloTons)
        FIG. 8 Global Rubber Chemicals Ortho Nitrochlorobenzene Market, 2016-2026 (USD Million)
        FIG. 9 Global Rubber Chemicals Ortho Nitrochlorobenzene  Market, 2016-2026 (KiloTons)
        FIG. 10 Global Others Ortho Nitrochlorobenzene Market, 2016-2026 (USD Million)
        FIG. 11 Global Others Ortho Nitrochlorobenzene  Market, 2016-2026 (KiloTons)
        FIG. 12 Global Ortho Nitrochlorobenzene Market Share, by Region, 2019 & 2026
        FIG. 13 Global Ortho Nitrochlorobenzene Market Share, by Region, 2019 & 2026
        FIG. 14 North America Ortho Nitrochlorobenzene Market, 2016-2026
        FIG. 15 North America Ortho Nitrochlorobenzene  Market, 2016-2026 (KiloTons)
        FIG. 16 U.S. Ortho Nitrochlorobenzene Market, 2016-2026
        FIG. 17 U.S. Ortho Nitrochlorobenzene  Market, 2016-2026 (KiloTons)
        FIG. 18 Canada Ortho Nitrochlorobenzene Market, 2016-2026
        FIG. 19 Canada Ortho Nitrochlorobenzene  Market, 2016-2026 (KiloTons)
        FIG. 20 Europe Ortho Nitrochlorobenzene Market, 2016-2026
        FIG. 21 Europe Ortho Nitrochlorobenzene  Market, 2016-2026 (KiloTons)
        FIG. 22 Germany Ortho Nitrochlorobenzene Market, 2016-2026
        FIG. 23 Germany Ortho Nitrochlorobenzene  Market, 2016-2026 (KiloTons)
        FIG. 24 France Ortho Nitrochlorobenzene Market, 2016-2026
        FIG. 25 France Ortho Nitrochlorobenzene  Market, 2016-2026 (KiloTons)
        FIG. 26 U.K. Ortho Nitrochlorobenzene Market, 2016-2026
        FIG. 27 U.K. Ortho Nitrochlorobenzene  Market, 2016-2026 (KiloTons)
        FIG. 28 Italy Ortho Nitrochlorobenzene Market, 2016-2026
        FIG. 29 Italy Ortho Nitrochlorobenzene  Market, 2016-2026 (KiloTons)
        FIG. 30 Spain Ortho Nitrochlorobenzene Market, 2016-2026
        FIG. 31 Spain Ortho Nitrochlorobenzene  Market, 2016-2026 (KiloTons)
        FIG. 32 Rest of Europe Ortho Nitrochlorobenzene Market, 2016-2026
        FIG. 33 Rest of Europe Ortho Nitrochlorobenzene  Market, 2016-2026 (KiloTons)
        FIG. 34 Asia Pacific Ortho Nitrochlorobenzene Market, 2016-2026
        FIG. 35 Asia Pacific Ortho Nitrochlorobenzene  Market, 2016-2026 (KiloTons)
        FIG. 36 China Ortho Nitrochlorobenzene Market, 2016-2026
        FIG. 37 China Ortho Nitrochlorobenzene  Market, 2016-2026 (KiloTons)
        FIG. 38 Japan Ortho Nitrochlorobenzene Market, 2016-2026
        FIG. 39 Japan Ortho Nitrochlorobenzene  Market, 2016-2026 (KiloTons)
        FIG. 40 India Ortho Nitrochlorobenzene Market, 2016-2026
        FIG. 41 India Ortho Nitrochlorobenzene  Market, 2016-2026 (KiloTons)
        FIG. 42 South  Korea Ortho Nitrochlorobenzene Market, 2016-2026
        FIG. 43 South  Korea Ortho Nitrochlorobenzene  Market, 2016-2026 (KiloTons)
        FIG. 44 South-East Asia Ortho Nitrochlorobenzene Market, 2016-2026
        FIG. 45 South-East Asia Ortho Nitrochlorobenzene  Market, 2016-2026 (KiloTons)
        FIG. 46 Rest of Asia Pacific Ortho Nitrochlorobenzene Market, 2016-2026
        FIG. 47 Rest of Asia Pacific Ortho Nitrochlorobenzene  Market, 2016-2026 (KiloTons)
        FIG. 48 Latin America Ortho Nitrochlorobenzene Market, 2016-2026
        FIG. 49 Latin America Ortho Nitrochlorobenzene  Market, 2016-2026 (KiloTons)
        FIG. 50 Brazil Ortho Nitrochlorobenzene Market, 2016-2026
        FIG. 51 Brazil Ortho Nitrochlorobenzene  Market, 2016-2026 (KiloTons)
        FIG. 52 Mexico Ortho Nitrochlorobenzene Market, 2016-2026
        FIG. 53 Mexico Ortho Nitrochlorobenzene  Market, 2016-2026 (KiloTons)
        FIG. 54 Rest of Latin America Ortho Nitrochlorobenzene Market, 2016-2026
        FIG. 55 Rest of Latin America Ortho Nitrochlorobenzene  Market, 2016-2026 (KiloTons)
        FIG. 56 The Middle-East and Africa Ortho Nitrochlorobenzene Market, 2016-2026
        FIG. 57 The Middle-East and Africa Ortho Nitrochlorobenzene  Market, 2016-2026 (KiloTons)
        FIG. 58 GCC Countries Ortho Nitrochlorobenzene Market, 2016-2026
        FIG. 59 GCC Countries Ortho Nitrochlorobenzene  Market, 2016-2026 (KiloTons)
        FIG. 60 South Africa Ortho Nitrochlorobenzene Market, 2016-2026
        FIG. 61 South Africa Ortho Nitrochlorobenzene  Market, 2016-2026 (KiloTons)
        FIG. 62 Rest of Middle-East Africa Ortho Nitrochlorobenzene Market, 2016-2026
        FIG. 63 Rest of Middle-East Africa Ortho Nitrochlorobenzene  Market, 2016-2026 (KiloTons)
        FIG. 64 Global Ortho Nitrochlorobenzene production and revenue, 2016-2026 (USD Million) (KiloTons)
        FIG. 65 North America Ortho Nitrochlorobenzene production and revenue, 2016-2026 (USD Million) (KiloTons)
        FIG. 66 Europe Ortho Nitrochlorobenzene production and revenue, 2016-2026 (USD Million) (KiloTons)
        FIG. 67 Asia Pacific Ortho Nitrochlorobenzene production and revenue, 2016-2026 (USD Million) (KiloTons)
        FIG. 68 Latin America Ortho Nitrochlorobenzene production and revenue, 2016-2026 (USD Million) (KiloTons)
        FIG. 69 Middle East and Africa Ortho Nitrochlorobenzene production and revenue, 2016-2026 (USD Million) (KiloTons)
        FIG. 70 Competitor Market Share – Revenue
        FIG. 71 Competitor Market Share – Volume
        FIG. 72 Anhui Bayi Chemical Industry Revenue and Growth Rate
        FIG. 73 Anhui Bayi Chemical Industry Market Share
        FIG. 74 Jiaxing Zhonghua Chemical Co.Ltd Revenue and Growth Rate
        FIG. 75 Jiaxing Zhonghua Chemical Co.Ltd Market Share
        FIG. 76 Seya Industries Revenue and Growth Rate
        FIG. 77 Seya Industries Market Share
        FIG. 78 SARNA Chemical Revenue and Growth Rate
        FIG. 79 SARNA Chemical Market Share
        FIG. 80 Aarti Industries Ltd Revenue and Growth Rate
        FIG. 81 Aarti Industries Ltd Market Share
        FIG. 82 Jiangsu Yangnong Chemical Group co. Ltd Revenue and Growth Rate
        FIG. 83 Jiangsu Yangnong Chemical Group co. Ltd Market Share
        FIG. 84 Liaoning Shixing Pharmaceutical & Chemical Co. Ltd. Revenue and Growth Rate
        FIG. 85 Liaoning Shixing Pharmaceutical & Chemical Co. Ltd. Market Share
        FIG. 86 Panoli Intermidiates Revenue and Growth Rate
        FIG. 87 Panoli Intermidiates Market Share
        FIG. 88 Kutch Chemical Industries Ltd Revenue and Growth Rate
        FIG. 89 Kutch Chemical Industries Ltd Market Share
        FIG. 90 Chirag Organics Revenue and Growth Rate
        FIG. 91 Chirag Organics Market Share
        FIG. 92 CHEMINTEL Revenue and Growth Rate
        FIG. 93 CHEMINTEL Market Share
        FIG. 94 Jiangsu Yangnong Chemical Group Revenue and Growth Rate
        FIG. 95 Jiangsu Yangnong Chemical Group Market Share
        FIG. 96 Market Dynamics
        FIG. 97 Global Ortho Nitrochlorobenzene – Value Chain Analysis
        FIG. 98 Key Mandates and Regulations
        FIG. 99 Technology Roadmap and Timeline
        FIG. 100 Market Attractiveness Analysis – By Application
        FIG. 101 Market Attractiveness Analysis – By Region
        FIG. 102 Manufacturing Cost Structure of Ortho Nitrochlorobenzene
        FIG. 103 Ortho Nitrochlorobenzene Industrial Chain Analysis
        FIG. 104 Market Channel
        FIG. 105 Marketing Channel Development Trend
        FIG. 106 Growth in World Gross Product, 2008-2019

        List of Tables

        TABLE 1 Global Ortho Nitrochlorobenzene market, 2019 & 2026 (USD Million)
        TABLE 2 Global Ortho Nitrochlorobenzene market, by Application, 2016-2026 (USD Million)
        TABLE 3 Global Ortho Nitrochlorobenzene market, by Application, 2016-2026 (KiloTons)
        TABLE 4 Global Ortho Nitrochlorobenzene market, by region, 2016-2026 (USD Million)
        TABLE 5 Global Ortho Nitrochlorobenzene market, by region, 2016-2026 (KiloTons)
        TABLE 6 North America Ortho Nitrochlorobenzene Market, by Application, 2016-2026 (USD Million)
        TABLE 7 North America Ortho Nitrochlorobenzene Market, by Application, 2016-2026 (KiloTons)
        TABLE 8 Europe Ortho Nitrochlorobenzene Market, by Application, 2016-2026 (USD Million)
        TABLE 9 Europe Ortho Nitrochlorobenzene Market, by Application, 2016-2026 (KiloTons)
        TABLE 10 Asia Pacific Ortho Nitrochlorobenzene Market, by Application, 2016-2026 (USD Million)
        TABLE 11 Asia Pacific Ortho Nitrochlorobenzene Market, by Application, 2016-2026 (KiloTons)
        TABLE 12 Latin America Ortho Nitrochlorobenzene Market, by Application, 2016-2026 (USD Million)
        TABLE 13 Latin America Ortho Nitrochlorobenzene Market, by Application, 2016-2026 (KiloTons)
        TABLE 14 The Middle-East and Africa Ortho Nitrochlorobenzene Market, by Application, 2016-2026 (USD Million)
        TABLE 15 The Middle-East and Africa Ortho Nitrochlorobenzene Market, by Application, 2016-2026 (KiloTons)
        TABLE 16 North America Ortho Nitrochlorobenzene Production, Consumption, Export, Import, 2016-2019
        TABLE 17 Europe Ortho Nitrochlorobenzene Production, Consumption, Export, Import, 2016-2019
        TABLE 18 Asia Pacific Ortho Nitrochlorobenzene Production, Consumption, Export, Import, 2016-2019
        TABLE 19 Latin America Ortho Nitrochlorobenzene Production, Consumption, Export, Import, 2016-2019
        TABLE 20 Middle East & Africa Ortho Nitrochlorobenzene Production, Consumption, Export, Import, 2016-2019
        TABLE 21 Global Ortho Nitrochlorobenzene Market - Company Revenue Analysis 2016-2019 (USD Million)
        TABLE 22 Global Ortho Nitrochlorobenzene Market - Company Revenue Share Analysis 2016-2019(%)
        TABLE 23 Global Ortho Nitrochlorobenzene Market - Company Volume Analysis 2016-2019 (KiloTons)
        TABLE 24 Global Ortho Nitrochlorobenzene Market - Company Volume Share Analysis 2016-2019(%)
        TABLE 25 Acquisitions and Mergers
        TABLE 26 New Product/Service Launch
        TABLE 27 Research & Development Activities
        TABLE 28 Market Drivers
        TABLE 29 Market Restraints
        TABLE 30 Market Opportunities
        TABLE 31 Production Base and Market Concentration Rate of Raw Material
        TABLE 32 Key Suppliers of Raw Materials
        TABLE 33 Raw Materials Sources of Ortho Nitrochlorobenzene Major Manufacturers in 2016
        TABLE 34 Major Buyers of Ortho Nitrochlorobenzene
        TABLE 35 Distributors/Traders of Ortho Nitrochlorobenzene by Region
        

Industry Major Market Players

  •  Anhui Bayi Chemical Industry
  •  Jiaxing Zhonghua Chemical Co.Ltd
  •  Seya Industries
  •  SARNA Chemical
  •  Aarti Industries Ltd
  •  Jiangsu Yangnong Chemical Group co. Ltd
  •  Liaoning Shixing Pharmaceutical & Chemical Co. Ltd.
  •  Panoli Intermediates
  •  Kutch Chemical Industries Ltd
  •  Chirag Organics
  •  CHEMINTEL
  •  Jiangsu Yangnong Chemical Group