Search Market Research Report

Discover Our Latest Reports
Discover Our Featured Reports
Discover Top Selling Reports

Optical Fiber Preform Market Size, Share Global Analysis Report, 2020–2026

report img

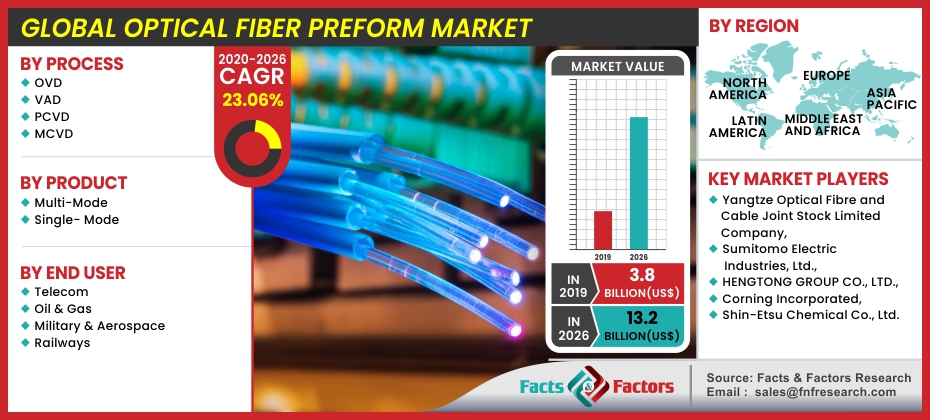
Optical Fiber Preform Market By Process (OVD, VAD, PCVD, MCVD), By Product (Multi-Mode, Single- Mode) and By End User (Telecom, Oil & Gas, Military & Aerospace, Railways): Global Industry Outlook, Market Size, Business Intelligence, Consumer Preferences, Statistical Surveys, Comprehensive Analysis, Historical Developments, Current Trends, and Forecast 2020–2026

Industry Insights

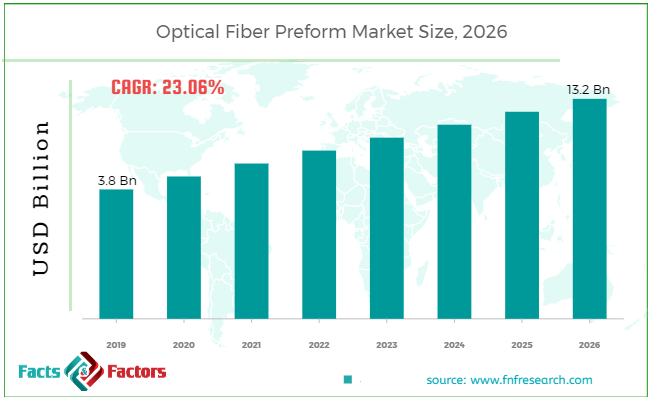
[225+ Pages Report] According to the report published by Facts Factors, the global optical fiber preform market size was worth around USD 3.8 billion in 2019 and is predicted to grow to around USD 13.2 billion by 2026 with a compound annual growth rate (CAGR) of roughly 23.06% between 2020 and 2026. The report analyzes the global optical fiber preform market drivers, restraints/challenges, and the effect they have on the demands during the projection period. In addition, the report explores emerging opportunities in the optical fiber preform market.

Optical Fiber Preform Market Size

To know more about this report | Request Free Sample Copy

This specialized and expertise-oriented industry research report scrutinizes the technical and commercial business outlook of the Optical Fiber Preform industry. The report analyzes and declares the historical and current trends analysis of the Optical Fiber Preform industry and subsequently recommends the projected trends anticipated to be observed in the Optical Fiber Preform market during the upcoming years.


logoKey Insights from Primary Research

  • Wide-ranging interviews with CXO’s of the major players operating in the global optical fiber preform market, the analysis of the primary research concludes that the global optical fiber preform market to undergo an excellent double-digit growth of nearly 23.06% over the forecast period.
  • In the year 2019, the market was valued at approximately USD 3.8 Billion, in 2019 and is expected to be valued over USD 13.2 Billion by 2026.
  • On the basis of the process, the OVD segment is expected to dominate the global market share. The telecom segment is expected to create major market pull in coming years. The multi-mode optical fiber is expected to generate significant revenue during the forecast period.
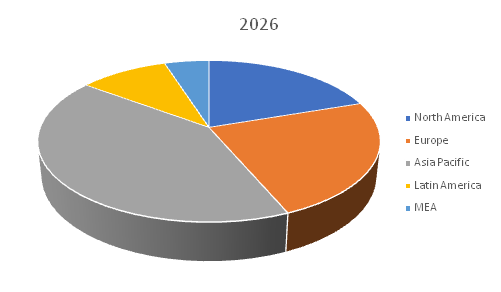
  • Asia Pacific region is expected to be the fastest growing region for optical fiber preform market over the forecast period. The region is also expected to register highest CAGR during the forecast period.

logoKey Recommendations from Analysts

  • Our analysts recommend for increased focus towards the Asia Pacific region as it is expected to have significant rise in fiber-rich network infrastructure in the near future. The presence of rising economies and growing data traffic provide immense potential of market growth in the region.
  • The strategic developments such as acquisitions and mergers, and regional expansion by the major companies is likely to provide greater market opportunities for the global optical fiber preform manufacturers up-coming years.
  • Our analysts recommend that the Asia Pacific region is predicted to witness a significant growth attributed to the growing demand for optical fiber preform from China, Japan and India.  
  • The North America and the European region are also expected to generate significant revenue during the studied period. The regional presence in the Asia Pacific, Europe and North America regions are expected to provide greater opportunities for business development.

logoMarket Share Analysis by Region

Optical Fiber Preform Market

To know more about this report | Request Free Sample Copy


The Optical Fiber Preform market report analyzes and notifies the industry statistics at the global as well as regional and country levels in order to acquire a thorough perspective of the entire Optical Fiber Preform market. The historical and past insights are provided for FY 2016 to FY 2019 whereas projected trends are delivered for FY 2020 to FY 2026. The quantitative and numerical data is represented in terms of value (USD Billion) from FY 2016 – 2026.

The quantitative data is further underlined and reinforced by comprehensive qualitative data which comprises various across-the-board market dynamics. The rationales which directly or indirectly impact the Optical Fiber Preform industry are exemplified through parameters such as growth drivers, restraints, challenges, and opportunities among other impacting factors.

Optical Fiber Preform Market

To know more about this report | Request Free Sample Copy

Throughout our research report, we have encompassed all the proven models and tools of industry analysis and extensively illustrated all the key business strategies and business models adopted in the Optical Fiber Preform industry. The report provides an all-inclusive and detailed competitive landscape prevalent in the Optical Fiber Preform market.

The report utilizes established industry analysis tools and models such as Porter’s Five Forces framework to analyze and recognize critical business strategies adopted by various stakeholders involved in the entire value chain of the Optical Fiber Preform industry. The Optical Fiber Preform market report additionally employs SWOT analysis and PESTLE analysis models for further in-depth analysis.

The report study further includes an in-depth analysis of industry players' market shares and provides an overview of leading players' market position in the Optical Fiber Preform sector. Key strategic developments in the Optical Fiber Preform market competitive landscape such as acquisitions & mergers, inaugurations of different products and services, partnerships & joint ventures, MoU agreements, VC & funding activities, R&D activities, and geographic expansion among other noteworthy activities by key players of the Optical Fiber Preform market are appropriately highlighted in the report.

The rising demand for high bandwidth communication, changing fiber-rich network infrastructure, and a high rise in the data traffic are the major factors driving the global optical fiber preform market.

Additionally, the research and development for innovation in optical fibers for its enhanced performance in various applications in the end-use fields are further expected to cement market growth.

The Optical Fiber Preform market research report delivers an acute valuation and taxonomy of the Optical Fiber Preform industry by practically splitting the market based on process, product, end-user, and regions. Through the analysis of the historical and projected trends, all the segments and sub-segments were evaluated through the bottom-up approach, and different market sizes have been projected for FY 2020 to FY 2026.

logoReport Scope

Report Attribute

Details

Market Size in 2019

USD 3.8 Billion

Projected Market Size in 2026

USD 13.2 Billion

CAGR Growth Rate

23.06% CAGR

Base Year

2019

Forecast Years

2020-2026

Key Market Players

Yangtze Optical Fibre and Cable Joint Stock Limited Company, Shin-Etsu Chemical Co., Ltd, Sumitomo Electric Industries, Ltd., HENGTONG GROUP CO., LTD. and Corning Incorporated, and Others

Key Segment

By Process, Product, End User, and Region

Major Regions Covered

North America, Europe, Asia Pacific, Latin America, and the Middle East & Africa

Purchase Options

Request customized purchase options to meet your research needs.Explore purchase options

The regional segmentation of the Optical Fiber Preform industry includes the complete classification of all the major continents including North America, Latin America, Europe, Asia Pacific, and Middle East & Africa. Further, country-wise data for the Optical Fiber Preform industry is provided for the leading economies of the world.

The Optical Fiber Preform market is segmented based on process, product, end-user, and region. On the basis of process segmentation, the market is classified into OVD, VAD, PCVD, and MCVD. On the basis of product segmentation, the market is segregated into multi-mode and single-mode. On the basis of end-user segmentation, the market is segmented into telecom, oil & gas, military & aerospace, and railways.

logoSome of the essential players operating in the Optical Fiber Preform market, but not restricted to include

  • Sumitomo Electric Industries Ltd.
  • HENGTONG GROUP CO. LTD.
  • Corning Incorporated
  • Shin-Etsu Chemical Co. Ltd.
  • Yangtze Optical Fibre and Cable Joint Stock Limited Company

The taxonomy of the Optical Fiber Preform industry by its scope and segmentation is as follows:

logoBy Process Segmentation Analysis

  • OVD
  • VAD
  • PCVD
  • MCVD

logoBy Product Segmentation Analysis

  • Multi-Mode
  • Single- Mode

logoBy End User Segmentation Analysis

  • Telecom
  • Oil & Gas
  • Military & Aerospace
  • Railways

logoBy Regional Segmentation Analysis

  • North America
    • The U.S.
    • Canada
  • Europe
    • Germany
    • The UK
    • France
    • Spain
    • Italy
    • Rest of Europe
  • Asia Pacific
    • China
    • Japan
    • India
    • South Korea
    • Southeast Asia
    • Rest of Asia Pacific
  • Latin America
    • Brazil
    • Mexico
    • Rest of Latin America
  • Middle East & Africa
    • GCC
    • South Africa
    • Rest of Middle East & Africa

Table of Content

  1. Chapter 1 Executive Summary
    1. 1.1. Introduction of Optical Fiber Preform
    2. 1.2. Global Optical Fiber Preform Market, 2019 & 2026 (USD Billion)
    3. 1.3. Global Optical Fiber Preform Market, 2016 – 2026 (USD Billion)
    4. 1.4. Global Optical Fiber Preform Market Absolute Revenue Opportunity, 2016 – 2026 (USD Billion)
    5. 1.5. Global Optical Fiber Preform Market Incremental Revenue Opportunity, 2020 – 2026 (USD Billion)
  2. Chapter 2 Optical Fiber Preform Market – Process Analysis
    1. 2.1. Global Optical Fiber Preform Market – Process Overview
    2. 2.2. Global Optical Fiber Preform Market Share, by Process, 2019 & 2026 (USD Billion)
    3. 2.3. OVD
      1. 2.3.1. Global OVD Optical Fiber Preform Market, 2016 – 2026 (USD Billion)
    4. 2.4. VAD
      1. 2.4.1. Global VAD Optical Fiber Preform Market, 2016 – 2026 (USD Billion)
    5. 2.5. PCVD
      1. 2.5.1. Global PCVD Optical Fiber Preform Market, 2016 – 2026 (USD Billion)
    6. 2.6. MCVD
      1. 2.6.1. Global MCVD Optical Fiber Preform Market, 2016 – 2026 (USD Billion)
  3. Chapter 3 Optical Fiber Preform Market – Product Analysis
    1. 3.1. Global Optical Fiber Preform Market – Product Overview
    2. 3.2. Global Optical Fiber Preform Market Share, by Product, 2019 & 2026 (USD Billion)
    3. 3.3. Multi-Mode
      1. 3.3.1. Global Multi-Mode Optical Fiber Preform Market, 2016 – 2026 (USD Billion)
    4. 3.4. Single- Mode
      1. 3.4.1. Global Single- Mode Optical Fiber Preform Market, 2016 – 2026 (USD Billion)
  4. Chapter 4 Optical Fiber Preform Market – End User Analysis
    1. 4.1. Global Optical Fiber Preform Market – End User Overview
    2. 4.2. Global Optical Fiber Preform Market Share, by End User, 2019 & 2026 (USD Billion)
    3. 4.3. Telecom
      1. 4.3.1. Global Telecom Optical Fiber Preform Market, 2016 – 2026 (USD Billion)
    4. 4.4. Oil & Gas
      1. 4.4.1. Global Oil & Gas Optical Fiber Preform Market, 2016 – 2026 (USD Billion)
    5. 4.5. Military & Aerospace
      1. 4.5.1. Global Military & Aerospace Optical Fiber Preform Market, 2016 – 2026 (USD Billion)
    6. 4.6. Railways
      1. 4.6.1. Global Railways Optical Fiber Preform Market, 2016 – 2026 (USD Billion)
  5. Chapter 5 Optical Fiber Preform Market – Regional Analysis
    1. 5.1. Global Optical Fiber Preform Market Regional Overview
    2. 5.2. Global Optical Fiber Preform Market Share, by Region, 2019 & 2026 (USD Billion)
    3. 5.3. North America
      1. 5.3.1. North America Optical Fiber Preform Market, 2016 – 2026 (USD Billion)
        1. 5.3.1.1. North America Optical Fiber Preform Market, by Country, 2016 - 2026 (USD Billion)
      2. 5.3.2. North America Optical Fiber Preform Market, by Process, 2016 – 2026
        1. 5.3.2.1. North America Optical Fiber Preform Market, by Process, 2016 – 2026 (USD Billion)
      3. 5.3.3. North America Optical Fiber Preform Market, by Product, 2016 – 2026
        1. 5.3.3.1. North America Optical Fiber Preform Market, by Product, 2016 – 2026 (USD Billion)
      4. 5.3.4. North America Optical Fiber Preform Market, by End User, 2016 – 2026
        1. 5.3.4.1. North America Optical Fiber Preform Market, by End User, 2016 – 2026 (USD Billion)
      5. 5.3.5. U.S.
        1. 5.3.5.1. U.S. Optical Fiber Preform Market, 2016 – 2026 (USD Billion)
      6. 5.3.6. Canada
        1. 5.3.6.1. Canada Optical Fiber Preform Market, 2016 – 2026 (USD Billion)
    4. 5.4. Europe
      1. 5.4.1. Europe Optical Fiber Preform Market, 2016 – 2026 (USD Billion)
        1. 5.4.1.1. Europe Optical Fiber Preform Market, by Country, 2016 - 2026 (USD Billion)
      2. 5.4.2. Europe Optical Fiber Preform Market, by Process, 2016 – 2026
        1. 5.4.2.1. Europe Optical Fiber Preform Market, by Process, 2016 – 2026 (USD Billion)
      3. 5.4.3. Europe Optical Fiber Preform Market, by Product, 2016 – 2026
        1. 5.4.3.1. Europe Optical Fiber Preform Market, by Product, 2016 – 2026 (USD Billion)
      4. 5.4.4. Europe Optical Fiber Preform Market, by End User, 2016 – 2026
        1. 5.4.4.1. Europe Optical Fiber Preform Market, by End User, 2016 – 2026 (USD Billion)
      5. 5.4.5. Germany
        1. 5.4.5.1. Germany Optical Fiber Preform Market, 2016 – 2026 (USD Billion)
      6. 5.4.6. France
        1. 5.4.6.1. France Optical Fiber Preform Market, 2016 – 2026 (USD Billion)
      7. 5.4.7. U.K.
        1. 5.4.7.1. U.K. Optical Fiber Preform Market, 2016 – 2026 (USD Billion)
      8. 5.4.8. Italy
        1. 5.4.8.1. Italy Optical Fiber Preform Market, 2016 – 2026 (USD Billion)
      9. 5.4.9. Spain
        1. 5.4.9.1. Spain Optical Fiber Preform Market, 2016 – 2026 (USD Billion)
      10. 5.4.10. Rest of Europe
        1. 5.4.10.1. Rest of Europe Optical Fiber Preform Market, 2016 – 2026 (USD Billion)
    5. 5.5. Asia Pacific
      1. 5.5.1. Asia Pacific Optical Fiber Preform Market, 2016 – 2026 (USD Billion)
        1. 5.5.1.1. Asia Pacific Optical Fiber Preform Market, by Country, 2016 - 2026 (USD Billion)
      2. 5.5.2. Asia Pacific Optical Fiber Preform Market, by Process, 2016 – 2026
        1. 5.5.2.1. Asia Pacific Optical Fiber Preform Market, by Process, 2016 – 2026 (USD Billion)
      3. 5.5.3. Asia Pacific Optical Fiber Preform Market, by Product, 2016 – 2026
        1. 5.5.3.1. Asia Pacific Optical Fiber Preform Market, by Product, 2016 – 2026 (USD Billion)
      4. 5.5.4. Asia Pacific Optical Fiber Preform Market, by End User, 2016 – 2026
        1. 5.5.4.1. Asia Pacific Optical Fiber Preform Market, by End User, 2016 – 2026 (USD Billion)
      5. 5.5.5. China
        1. 5.5.5.1. China Optical Fiber Preform Market, 2016 – 2026 (USD Billion)
      6. 5.5.6. Japan
        1. 5.5.6.1. Japan Optical Fiber Preform Market, 2016 – 2026 (USD Billion)
      7. 5.5.7. India
        1. 5.5.7.1. India Optical Fiber Preform Market, 2016 – 2026 (USD Billion)
      8. 5.5.8. South Korea
        1. 5.5.8.1. South Korea Optical Fiber Preform Market, 2016 – 2026 (USD Billion)
      9. 5.5.9. South-East Asia
        1. 5.5.9.1. South-East Asia Optical Fiber Preform Market, 2016 – 2026 (USD Billion)
      10. 5.5.10. Rest of Asia Pacific
        1. 5.5.10.1. Rest of Asia Pacific Optical Fiber Preform Market, 2016 – 2026 (USD Billion)
    6. 5.6. Latin America
      1. 5.6.1. Latin America Optical Fiber Preform Market, 2016 – 2026 (USD Billion)
        1. 5.6.1.1. Latin America Optical Fiber Preform Market, by Country, 2016 - 2026 (USD Billion)
      2. 5.6.2. Latin America Optical Fiber Preform Market, by Process, 2016 – 2026
        1. 5.6.2.1. Latin America Optical Fiber Preform Market, by Process, 2016 – 2026 (USD Billion)
      3. 5.6.3. Latin America Optical Fiber Preform Market, by Product, 2016 – 2026
        1. 5.6.3.1. Latin America Optical Fiber Preform Market, by Product, 2016 – 2026 (USD Billion)
      4. 5.6.4. Latin America Optical Fiber Preform Market, by End User, 2016 – 2026
        1. 5.6.4.1. Latin America Optical Fiber Preform Market, by End User, 2016 – 2026 (USD Billion)
      5. 5.6.5. Brazil
        1. 5.6.5.1. Brazil Optical Fiber Preform Market, 2016 – 2026 (USD Billion)
      6. 5.6.6. Mexico
        1. 5.6.6.1. Mexico Optical Fiber Preform Market, 2016 – 2026 (USD Billion)
      7. 5.6.7. Rest of Latin America
        1. 5.6.7.1. Rest of Latin America Optical Fiber Preform Market, 2016 – 2026 (USD Billion)
    7. 5.7. The Middle-East and Africa
      1. 5.7.1. The Middle-East and Africa Optical Fiber Preform Market, 2016 – 2026 (USD Billion)
        1. 5.7.1.1. The Middle-East and Africa Optical Fiber Preform Market, by Country, 2016 - 2026 (USD Billion)
      2. 5.7.2. The Middle-East and Africa Optical Fiber Preform Market, by Process, 2016 – 2026
        1. 5.7.2.1. The Middle-East and Africa Optical Fiber Preform Market, by Process, 2016 – 2026 (USD Billion)
      3. 5.7.3. The Middle-East and Africa Optical Fiber Preform Market, by Product, 2016 – 2026
        1. 5.7.3.1. The Middle-East and Africa Optical Fiber Preform Market, by Product, 2016 – 2026 (USD Billion)
      4. 5.7.4. The Middle-East and Africa Optical Fiber Preform Market, by End User, 2016 – 2026
        1. 5.7.4.1. The Middle-East and Africa Optical Fiber Preform Market, by End User, 2016 – 2026 (USD Billion)
      5. 5.7.5. GCC Countries
        1. 5.7.5.1. GCC Countries Optical Fiber Preform Market, 2016 – 2026 (USD Billion)
      6. 5.7.6. South Africa
        1. 5.7.6.1. South Africa Optical Fiber Preform Market, 2016 – 2026 (USD Billion)
      7. 5.7.7. Rest of Middle-East Africa
        1. 5.7.7.1. Rest of Middle-East Africa Optical Fiber Preform Market, 2016 – 2026 (USD Billion)
  6. Chapter 6 Optical Fiber Preform Market – Competitive Landscape
    1. 6.1. Competitor Market Share – Revenue
    2. 6.2. Market Concentration Rate Analysis, Top 3 and Top 5 Players
    3. 6.3. Strategic Developments
      1. 6.3.1. Acquisitions and Mergers
      2. 6.3.2. New Products
      3. 6.3.3. Research & Development Activities
  7. Chapter 7 Company Profiles
    1. 7.1. Yangtze Optical Fibre and Cable Joint Stock Limited Company
      1. 7.1.1. Company Overview
      2. 7.1.2. Product/Service Portfolio
      3. 7.1.3. Yangtze Optical Fibre and Cable Joint Stock Limited Company Sales, Revenue, and Gross Margin
      4. 7.1.4. Yangtze Optical Fibre and Cable Joint Stock Limited Company Revenue and Growth Rate
      5. 7.1.5. Yangtze Optical Fibre and Cable Joint Stock Limited Company Market Share
      6. 7.1.6. Recent Initiatives, Funding/VC Activities, and Technological Innovations
    2. 7.2. Corning Incorporated
      1. 7.2.1. Company Overview
      2. 7.2.2. Product/Service Portfolio
      3. 7.2.3. Corning Incorporated Sales, Revenue, and Gross Margin
      4. 7.2.4. Corning Incorporated Revenue and Growth Rate
      5. 7.2.5. Corning Incorporated Market Share
      6. 7.2.6. Recent Initiatives, Funding/VC Activities, and Technological Innovations
    3. 7.3. Sumitomo Electric Industries, Ltd.
      1. 7.3.1. Company Overview
      2. 7.3.2. Product/Service Portfolio
      3. 7.3.3. Sumitomo Electric Industries, Ltd. Sales, Revenue, and Gross Margin
      4. 7.3.4. Sumitomo Electric Industries, Ltd. Revenue and Growth Rate
      5. 7.3.5. Sumitomo Electric Industries, Ltd. Market Share
      6. 7.3.6. Recent Initiatives, Funding/VC Activities, and Technological Innovations
    4. 7.4. HENGTONG GROUP CO., LTD.
      1. 7.4.1. Company Overview
      2. 7.4.2. Product/Service Portfolio
      3. 7.4.3. HENGTONG GROUP CO., LTD. Sales, Revenue, and Gross Margin
      4. 7.4.4. HENGTONG GROUP CO., LTD. Revenue and Growth Rate
      5. 7.4.5. HENGTONG GROUP CO., LTD. Market Share
      6. 7.4.6. Recent Initiatives, Funding/VC Activities, and Technological Innovations
    5. 7.5. Shin-Etsu Chemical Co., Ltd
      1. 7.5.1. Company Overview
      2. 7.5.2. Product/Service Portfolio
      3. 7.5.3. Shin-Etsu Chemical Co., Ltd Sales, Revenue, and Gross Margin
      4. 7.5.4. Shin-Etsu Chemical Co., Ltd Revenue and Growth Rate
      5. 7.5.5. Shin-Etsu Chemical Co., Ltd Market Share
      6. 7.5.6. Recent Initiatives, Funding/VC Activities, and Technological Innovations
  8. Chapter 8 Optical Fiber Preform — Industry Analysis
    1. 8.1. Introduction and Taxonomy
    2. 8.2. Optical Fiber Preform Market – Key Trends
      1. 8.2.1. Market Drivers
      2. 8.2.2. Market Restraints
      3. 8.2.3. Market Opportunities
    3. 8.3. Value Chain Analysis
    4. 8.4. Key Mandates and Regulations
    5. 8.5. Technology Roadmap and Timeline
    6. 8.6. Optical Fiber Preform Market – Attractiveness Analysis
      1. 8.6.1. By Process
      2. 8.6.2. By Product
      3. 8.6.3. By End User
      4. 8.6.4. By Region
  9. Chapter 9 Industrial Chain, Sourcing Strategy, and Downstream Buyers
    1. 9.1. Optical Fiber Preform Industrial Chain Analysis
    2. 9.2. Downstream Buyers
    3. 9.3. Distributors/Traders List
  10. Chapter 10 Marketing Strategy Analysis
    1. 10.1. Marketing Channel
    2. 10.2. Direct Marketing
    3. 10.3. Indirect Marketing
    4. 10.4. Marketing Channel Development Trends
    5. 10.5. Economic/Political Environmental Change
  11. Chapter 11 Report Conclusion & Key Insights
    1. 11.1. Key Insights from Primary Interviews & Surveys Respondents
    2. 11.2. Key Takeaways from Analysts, Consultants, and Industry Leaders
  12. Chapter 12 Research Approach & Methodology
    1. 12.1. Report Description
    2. 12.2. Research Scope
    3. 12.3. Research Methodology
      1. 12.3.1. Secondary Research
      2. 12.3.2. Primary Research
      3. 12.3.3. Statistical Models
        1. 12.3.3.1. Company Share Analysis Model
        2. 12.3.3.2. Revenue Based Modeling
      4. 12.3.4. Research Limitations

      List of Figures

      Fig.1 Product Picture of Optical Fiber Preform
      Fig.2 Global Optical Fiber Preform Market, 2016 – 2026 (USD Billion)
      Fig.3 Global Optical Fiber Preform Market Absolute Revenue Opportunity, 2016 – 2026 (USD Billion)
      Fig.4 Global Optical Fiber Preform Market Incremental Revenue Opportunity, 2020 – 2026 (USD Billion)
      Fig.5 Global Optical Fiber Preform Market Share, by Process, 2019 & 2026 (USD Billion)
      Fig.6 Global OVD Optical Fiber Preform Market, 2016 – 2026 (USD Billion)
      Fig.7 Global VAD Optical Fiber Preform Market, 2016 – 2026 (USD Billion)
      Fig.8 Global PCVD Optical Fiber Preform Market, 2016 – 2026 (USD Billion)
      Fig.9 Global MCVD Optical Fiber Preform Market, 2016 – 2026 (USD Billion)
      Fig.10 Global Optical Fiber Preform Market Share, by Product, 2019 & 2026 (USD Billion)
      Fig.11 Global Multi-Mode Optical Fiber Preform Market, 2016 – 2026 (USD Billion)
      Fig.12 Global Single- Mode  Optical Fiber Preform Market, 2016 – 2026 (USD Billion)
      Fig.13 Global Optical Fiber Preform Market Share, by End User, 2019 & 2026 (USD Billion)
      Fig.14 Global Telecom Optical Fiber Preform Market, 2016 – 2026 (USD Billion)
      Fig.15 Global Oil & Gas Optical Fiber Preform Market, 2016 – 2026 (USD Billion)
      Fig.16 Global Military & Aerospace Optical Fiber Preform Market, 2016 – 2026 (USD Billion)
      Fig.17 Global Railways Optical Fiber Preform Market, 2016 – 2026 (USD Billion)
      Fig.18 Global Optical Fiber Preform Market Share, by Region, 2019 & 2026 (USD Billion)
      Fig.19 North America Optical Fiber Preform Market, 2016 – 2026 (USD Billion)
      Fig.20 U.S. Optical Fiber Preform Market, 2016 – 2026 (USD Billion)
      Fig.21 Canada Optical Fiber Preform Market, 2016 – 2026 (USD Billion)
      Fig.22 Europe Optical Fiber Preform Market, 2016 – 2026 (USD Billion)
      Fig.23 Germany Optical Fiber Preform Market, 2016 – 2026 (USD Billion)
      Fig.24 France Optical Fiber Preform Market, 2016 – 2026 (USD Billion)
      Fig.25 U.K. Optical Fiber Preform Market, 2016 – 2026 (USD Billion)
      Fig.26 Italy Optical Fiber Preform Market, 2016 – 2026 (USD Billion)
      Fig.27 Spain Optical Fiber Preform Market, 2016 – 2026 (USD Billion)
      Fig.28 Rest of Europe Optical Fiber Preform Market, 2016 – 2026 (USD Billion)
      Fig.29 Asia Pacific Optical Fiber Preform Market, 2016 – 2026 (USD Billion)
      Fig.30 China Optical Fiber Preform Market, 2016 – 2026 (USD Billion)
      Fig.31 Japan Optical Fiber Preform Market, 2016 – 2026 (USD Billion)
      Fig.32 India Optical Fiber Preform Market, 2016 – 2026 (USD Billion)
      Fig.33 South  Korea Optical Fiber Preform Market, 2016 – 2026 (USD Billion)
      Fig.34 South-East Asia Optical Fiber Preform Market, 2016 – 2026 (USD Billion)
      Fig.35 Rest of Asia Pacific Optical Fiber Preform Market, 2016 – 2026 (USD Billion)
      Fig.36 Latin America Optical Fiber Preform Market, 2016 – 2026 (USD Billion)
      Fig.37 Brazil Optical Fiber Preform Market, 2016 – 2026 (USD Billion)
      Fig.38 Mexico Optical Fiber Preform Market, 2016 – 2026 (USD Billion)
      Fig.39 Rest of Latin America Optical Fiber Preform Market, 2016 – 2026 (USD Billion)
      Fig.40 The Middle-East and Africa Optical Fiber Preform Market, 2016 – 2026 (USD Billion)
      Fig.41 GCC Countries Optical Fiber Preform Market, 2016 – 2026 (USD Billion)
      Fig.42 South Africa Optical Fiber Preform Market, 2016 – 2026 (USD Billion)
      Fig.43 Rest of Middle-East Africa Optical Fiber Preform Market, 2016 – 2026 (USD Billion)
      Fig.44 Competitor Market Share – Revenue
      Fig.45 Yangtze Optical Fibre and Cable Joint Stock Limited Company Revenue and Growth Rate
      Fig.46 Yangtze Optical Fibre and Cable Joint Stock Limited Company Market Share
      Fig.47 Corning Incorporated Revenue and Growth Rate
      Fig.48 Corning Incorporated Market Share
      Fig.49 Sumitomo Electric Industries, Ltd. Revenue and Growth Rate
      Fig.50 Sumitomo Electric Industries, Ltd. Market Share
      Fig.51 HENGTONG GROUP CO., LTD. Revenue and Growth Rate
      Fig.52 HENGTONG GROUP CO., LTD. Market Share
      Fig.53 Shin-Etsu Chemical Co., Ltd Revenue and Growth Rate
      Fig.54 Shin-Etsu Chemical Co., Ltd Market Share
      Fig.55 Market Dynamics
      Fig.56 Global Optical Fiber Preform – Value Chain Analysis
      Fig.57 Key Mandates and Regulations
      Fig.58 Technology Roadmap and Timeline
      Fig.59 Market Attractiveness Analysis – By Process
      Fig.60 Market Attractiveness Analysis – By Product
      Fig.61 Market Attractiveness Analysis – By End User
      Fig.62 Market Attractiveness Analysis – By Region
      Fig.63 Optical Fiber Preform Industrial Chain Analysis
      Fig.64 Market Channels
      Fig.65 Marketing Channel Development Trend
      Fig.66 Growth in World Gross Product, 2008-2018


      List of Tables

      Table 1 Global Optical Fiber Preform Market, 2019 & 2026 (USD Billion)
      Table 2 Global Optical Fiber Preform Market, by Process, 2016 – 2026 (USD Billion)
      Table 3 Global Optical Fiber Preform Market, by Product, 2016 – 2026 (USD Billion)
      Table 4 Global Optical Fiber Preform Market, by End User, 2016 – 2026 (USD Billion)
      Table 5 Global Optical Fiber Preform Market, by Region, 2016 – 2026 (USD Billion)
      Table 6 North America Optical Fiber Preform Market, by Country, 2016 – 2026 (USD Billion)
      Table 7 North America Optical Fiber Preform Market, by Process, 2016 – 2026 (USD Billion)
      Table 8 North America Optical Fiber Preform Market, by Product, 2016 – 2026 (USD Billion)
      Table 9 North America Optical Fiber Preform Market, by End User, 2016 – 2026 (USD Billion)
      Table 10 Europe Optical Fiber Preform Market, by Country, 2016 – 2026 (USD Billion)
      Table 11 Europe Optical Fiber Preform Market, by Process, 2016 – 2026 (USD Billion)
      Table 12 Europe Optical Fiber Preform Market, by Product, 2016 – 2026 (USD Billion)
      Table 13 Europe Optical Fiber Preform Market, by End User, 2016 – 2026 (USD Billion)
      Table 14 Asia Pacific Optical Fiber Preform Market, by Country, 2016 – 2026 (USD Billion)
      Table 15 Asia Pacific Optical Fiber Preform Market, by Process, 2016 – 2026 (USD Billion)
      Table 16 Asia Pacific Optical Fiber Preform Market, by Product, 2016 – 2026 (USD Billion)
      Table 17 Asia Pacific Optical Fiber Preform Market, by End User, 2016 – 2026 (USD Billion)
      Table 18 Latin America Optical Fiber Preform Market, by Country, 2016 – 2026 (USD Billion)
      Table 19 Latin America Optical Fiber Preform Market, by Process, 2016 – 2026 (USD Billion)
      Table 20 Latin America Optical Fiber Preform Market, by Product, 2016 – 2026 (USD Billion)
      Table 21 Latin America Optical Fiber Preform Market, by End User, 2016 – 2026 (USD Billion)
      Table 22 The Middle-East and Africa Optical Fiber Preform Market, by Country, 2016 – 2026 (USD Billion)
      Table 23 The Middle-East and Africa Optical Fiber Preform Market, by Process, 2016 – 2026 (USD Billion)
      Table 24 The Middle-East and Africa Optical Fiber Preform Market, by Product, 2016 – 2026 (USD Billion)
      Table 25 The Middle-East and Africa Optical Fiber Preform Market, by End User, 2016 – 2026 (USD Billion)
      Table 26 Global Optical Fiber Preform Market - Company Revenue Analysis, 2016 – 2019 (USD Billion)
      Table 27 Global Optical Fiber Preform Market - Company Revenue Share Analysis, 2016 – 2019 (%)
      Table 28 Acquisitions and Mergers
      Table 29 Market Drivers – Impact Analysis
      Table 30 Market Restraints
      Table 31 Market Opportunities
      Table 32 Major Buyers of Optical Fiber Preform
      Table 33 Distributors/Traders of Optical Fiber Preform by Region
       

Industry Major Market Players

  • Yangtze Optical Fibre and Cable Joint Stock Limited Company
  • Sumitomo Electric Industries Ltd.
  • HENGTONG GROUP CO. LTD.
  • Corning Incorporated
  • Shin-Etsu Chemical Co. Ltd.